SlideShare a Scribd company logo
Instrumenting the
real-time web:
Running node.js in production

Bryan Cantrill
VP, Engineering

bryan@joyent.com
@bcantrill
“Real-time web?”

   • The term has enjoyed some popularity, but there is
     clearly confusion about the definition of “real-time”
   • A real-time system is one in which the correctness of the
     system is relative to its timeliness
   • A hard real-time system is one which the latency
     constraints are rigid: violation constitutes total system
     failure (e.g., an actuator on a physical device)
   • A soft real-time system is one in which latency
     constraints are more flexible: violation is undesirable but
     non-fatal (e.g., a video game or MP3 player)
   • Historically, the only real-time aspect of the web has
     been in some of its static content (e.g. video, audio)
The rise of the real-time web

    • The rise of mobile + HTML5 has given rise to a new
     breed of web application: ones in which dynamic data
     has real-time semantics
    • These data-intensive real-time applications present new
     semantics for web-facing applications
    • These present new data semantics for web applications:
     CRUD, ACID, BASE, CAP — meet DIRT!
The challenge of DIRTy apps

   • DIRTy applications tend to have the human in the loop
      • Good news: deadlines are soft — microseconds only
        matter when they add up to tens of milliseconds

      • Bad news: because humans are in the loop, demand
        for the system can be non-linear

   • One must deal not only with the traditional challenge of
     scalability, but also the challenge of a real-time system!
Building DIRTy apps

   • Embedded real-time systems are sufficiently controlled
     that latency bubbles can be architected away
   • Web-facing systems are far too sloppy to expect this!
   • Focus must shift from preventing latency bubbles to
     preventing latency bubbles from cascading
   • Operations that can induce latency (network, I/O, etc.)
     must not be able to take the system out with them!
   • Implies purely asynchronous and evented architectures,
     which are notoriously difficult to implement...
Enter node.js

   • node.js is a JavaScript-based framework for building
     event-oriented servers:
      var http = require(‘http’);

      http.createServer(function (req, res) {
             res.writeHead(200, {'Content-Type': 'text/plain'});
             res.end('Hello Worldn');
      }).listen(8124, "127.0.0.1");

      console.log(‘Server running at http://127.0.0.1:8124!’);
node.js as building block

    • node.js is a confluence of three ideas:
       • JavaScriptʼs rich support for asynchrony (i.e. closures)
       • High-performance JavaScript VMs (e.g. V8)
       • The system abstractions that God intended (i.e. UNIX)
    • Because everything is asynchronous, node.js is ideal for
     delivering scale in the presence of long-latency events!
The primacy of latency

   • As the correctness of the system is its timeliness, we
     must be able to measure the system to verify it
   • In a real-time system, it does not make sense to
     measure operations per second!
   • The only metric that matters is latency
   • This is dangerous to distill to a single number; the
     distribution of latency over time is essential
   • This poses both instrumentation and visualization
     challenges!
Instrumenting for latency

    • Instrumenting for latency requires modifying the system
     twice: as an operation starts and as it finishes
    • During an operation, the system must track — on a per-
     operation basis — the start time of the operation
    • Upon operation completion, the resulting stored data
     cannot be a scalar — the distribution is essential when
     understanding latency
    • Instrumentation must be systemic; must be able to
     reach to the sources of latency deep within the system
    • These constraints eliminate static instrumentation; we
     need a better way to instrument the system
Enter DTrace

   • Facility for dynamic instrumentation of production
     systems originally developed circa 2003 for Solaris 10
   • Open sourced (along with the rest of Solaris) in 2005;
     subsequently ported to many other systems (MacOS X,
     FreeBSD, NetBSD, QNX, nascent Linux port)
   • Support for arbitrary actions, arbitrary predicates, in
     situ data aggregation, statically-defined instrumentation
   • Designed for safe, ad hoc use in production: concise
     answers to arbitrary questions
   • Particularly well suited to real-time: the original design
     center was the understanding of latency bubbles
DTrace + Node?

   • DTrace instruments the system holistically, which is to
    say, from the kernel, which poses a challenge for
    interpreted environments
   • User-level statically defined tracing (USDT) providers
    describe semantically relevant points of instrumentation
   • Some interpreted environments (e.g., Ruby, Python,
    PHP, Erlang) have added USDT providers that
    instrument the interpreter itself
   • This approach is very fine-grained (e.g., every function
    call) and doesnʼt work in JITʼd environments
   • We decided to take a different tack for Node
DTrace for node.js

    • Given the nature of the paths that we wanted to
     instrument, we introduced a function into JavaScript that
     Node can call to get into USDT-instrumented C++
    • Introduces disabled probe effect: calling from JavaScript
     into C++ costs even when probes are not enabled
    • We use USDT is-enabled probes to minimize disabled
     probe effect once in C++
    • If (and only if) the probe is enabled, we prepare a
     structure for the kernel that allows for translation into a
     structure that is familiar to node programmers
Node USDT Provider

   • Example one-liners:
     dtrace -n ‘node*:::http-server-request{
        printf(“%s of %s from %sn”, args[0]->method,
            args[0]->url, args[1]->remoteAddress)}‘

     dtrace -n http-server-request’{@[args[1]->remoteAddress] = count()}‘

     dtrace -n gc-start’{self->ts = timestamp}’ 
        -n gc-done’/self->ts/{@ = quantize(timestamp - self->ts)}’


   • A script to measure HTTP latency:
     http-server-request
     {
            self->ts[args[1]->fd] = timestamp;
     }

     http-server-response
     /self->ts[args[0]->fd]/
     {
            @[zonename] = quantize(timestamp - self->ts[args[0]->fd]);
     }
User-defined USDT probes in node.js

   • Our USDT technique has been generalized by Chris
     Andrews in his node-dtrace-provider npm module:
       https://github.com/chrisa/node-dtrace-provider
   • Used by Joyentʼs Mark Cavage in his ldap.js to measure
     and validate operation latency
   • But how to visualize operation latency?
Visualizing latency

    • Could visualize latency as a scalar (i.e., average):


    • This hides outliers — and in a real-time system, it is the
     outliers that you care about!
    • Using percentiles helps to convey distribution — but
     crucial detail remains hidden
Visualizing latency as a heatmap

    • Latency is much better visualized as a heatmap, with
     time on the x-axis, latency on the y-axis, and frequency
     represented with color saturation:


    • Many patterns are now visible (as in this example of
     MySQL query latency), but critical data is still hidden
Visualizing latency as a 4D heatmap

   • Can use hue to represent higher dimensionality: time on
     the x-axis, latency on the y-axis, frequency via color
     saturation, and hue representing the new dimension:


   • In this example, the higher dimension is the MySQL
     database table associated with the operation
Visualizing node.js latency

    • Using the USDT probes as foundation, we developed a
     cloud analytics facility that visualizes latency in real-time
     via four dimensional heatmaps:


    • Facility is available via Joyentʼs no.de service, Joyentʼs
     public cloud, or Joyentʼs SmartDataCenter
Debugging latency

   • Latency visualization is essential for understanding
     where latency is being induced in a complicated system,
     but how can we determine why?
   • This requires associating an external event — an I/O
     request, a network packet, a profiling interrupt — with
     the code thatʼs inducing it
   • For node.js — like other dynamic environments — this is
     historically very difficult: the VM is opaque to the OS
   • Using DTraceʼs helper mechanism, we have developed
     a V8 ustack helper that allows OS-level events to be
     correlated to the node.js-backtrace that induced them
   • Available for node 0.6.7 on Joyentʼs SmartOS
Visualizing node.js CPU latency

   • Using the node.js ustack helper and the DTrace profile
     provider, we can determine the relative frequency of
     stack backtraces in terms of CPU consumption
   • Stacks can be visualized with flame graphs, a stack
     visualization developed by Joyentʼs Brendan Gregg:
node.js in production

    • node.js is particularly amenable for the DIRTy apps that
     typify the real-time web
    • The ability to understand latency must be considered
     when deploying node.js-based systems into production!
    • Understanding latency requires dynamic instrumentation
     and novel visualization
    • At Joyent, we have added DTrace-based dynamic
     instrumentation for node.js to SmartOS, and novel
     visualization into our cloud and software offerings
    • Better production support — better observability, better
     debuggability — remains an important area of node.js
     development!
Thank you!

   • @ryah and @rmustacc for Node DTrace USDT
    integration
   • @dapsays, @rmustacc, @rob_ellis and @notmatt for
    cloud analytics
   • @chrisandrews for node-dtrace-provider and
    @mcavage for putting it to such great use in ldap.js
   • @dapsays for the V8 DTrace ustack helper
   • @brendangregg for both the heatmap and flame graph
    visualizations
   • More information: http://dtrace.org/blogs/dap,
    http://dtrace.org/blogs/brendan and http://smartos.org

More Related Content

What's hot (20)

PPTX
純粋関数型アルゴリズム入門
Kimikazu Kato
 
PDF
自作GPUへの道
Daisuke Kamikawa
 
PDF
Matrix calculus
Sungbin Lim
 
PPTX
4K Checkerboard in Battlefield 1 and Mass Effect Andromeda
Electronic Arts / DICE
 
PDF
敵対的学習に対するラデマッハ複雑度
Masa Kato
 
PPTX
2021 10-12.linx device-tree
Shin-ya Koga
 
PDF
深層生成モデルを用いたマルチモーダルデータの半教師あり学習
Masahiro Suzuki
 
PPTX
AutoTVM紹介
tomohiro kato
 
PDF
はじパタ 10章 クラスタリング 前半
Katsushi Yamashita
 
PDF
パターン認識と機械学習 §6.2 カーネル関数の構成
Prunus 1350
 
PPT
Secrets of CryENGINE 3 Graphics Technology
Tiago Sousa
 
PPTX
Low-level Shader Optimization for Next-Gen and DX11 by Emil Persson
AMD Developer Central
 
PPT
A Bit More Deferred Cry Engine3
guest11b095
 
PDF
三次元表現まとめ(深層学習を中心に)
Tomohiro Motoda
 
PDF
スパースモデリング、スパースコーディングとその数理(第11回WBA若手の会)
narumikanno0918
 
PPTX
ニューラルチューリングマシン入門
naoto moriyama
 
PDF
CPU / GPU高速化セミナー!性能モデルの理論と実践:実践編
Fixstars Corporation
 
PDF
Popcntによるハミング距離計算
Norishige Fukushima
 
PDF
[DL輪読会]A Higher-Dimensional Representation for Topologically Varying Neural R...
Deep Learning JP
 
PDF
確率的主成分分析
Mika Yoshimura
 
純粋関数型アルゴリズム入門
Kimikazu Kato
 
自作GPUへの道
Daisuke Kamikawa
 
Matrix calculus
Sungbin Lim
 
4K Checkerboard in Battlefield 1 and Mass Effect Andromeda
Electronic Arts / DICE
 
敵対的学習に対するラデマッハ複雑度
Masa Kato
 
2021 10-12.linx device-tree
Shin-ya Koga
 
深層生成モデルを用いたマルチモーダルデータの半教師あり学習
Masahiro Suzuki
 
AutoTVM紹介
tomohiro kato
 
はじパタ 10章 クラスタリング 前半
Katsushi Yamashita
 
パターン認識と機械学習 §6.2 カーネル関数の構成
Prunus 1350
 
Secrets of CryENGINE 3 Graphics Technology
Tiago Sousa
 
Low-level Shader Optimization for Next-Gen and DX11 by Emil Persson
AMD Developer Central
 
A Bit More Deferred Cry Engine3
guest11b095
 
三次元表現まとめ(深層学習を中心に)
Tomohiro Motoda
 
スパースモデリング、スパースコーディングとその数理(第11回WBA若手の会)
narumikanno0918
 
ニューラルチューリングマシン入門
naoto moriyama
 
CPU / GPU高速化セミナー!性能モデルの理論と実践:実践編
Fixstars Corporation
 
Popcntによるハミング距離計算
Norishige Fukushima
 
[DL輪読会]A Higher-Dimensional Representation for Topologically Varying Neural R...
Deep Learning JP
 
確率的主成分分析
Mika Yoshimura
 

Viewers also liked (8)

PDF
Node Summit 2012
Monica Wilkinson
 
PDF
FeedHenry at NodeJam (San Francisco, 25th Jan 2012)
Mícheál Ó Foghlú
 
PPTX
ql.io: Consuming HTTP at Scale
Subbu Allamaraju
 
PDF
Rqa14 secondary
Abelardo Brutas Jr.
 
PDF
Probabilistic algorithms for fun and pseudorandom profit
Tyler Treat
 
PDF
BPF - in-kernel virtual machine
Alexei Starovoitov
 
PDF
Linux BPF Superpowers
Brendan Gregg
 
PDF
BPF: Tracing and more
Brendan Gregg
 
Node Summit 2012
Monica Wilkinson
 
FeedHenry at NodeJam (San Francisco, 25th Jan 2012)
Mícheál Ó Foghlú
 
ql.io: Consuming HTTP at Scale
Subbu Allamaraju
 
Rqa14 secondary
Abelardo Brutas Jr.
 
Probabilistic algorithms for fun and pseudorandom profit
Tyler Treat
 
BPF - in-kernel virtual machine
Alexei Starovoitov
 
Linux BPF Superpowers
Brendan Gregg
 
BPF: Tracing and more
Brendan Gregg
 
Ad

Similar to Instrumenting the real-time web: Node.js in production (20)

PDF
John adams talk cloudy
John Adams
 
PPTX
The impact of cloud NSBCon NY by Yves Goeleven
Particular Software
 
PDF
Performance Analysis: new tools and concepts from the cloud
Brendan Gregg
 
PDF
Build cloud native solution using open source
Nitesh Jadhav
 
PDF
Data Lake and the rise of the microservices
Bigstep
 
ODP
Birmingham-20060705
Miguel Vidal
 
PDF
node.js and Containers: Dispatches from the Frontier
bcantrill
 
PPTX
Sync in an NFV World (Ram, ITSF 2016)
Adam Paterson
 
PPTX
Sync in an NFV World (Ram, ITSF 2016)
Calnex Solutions
 
PPTX
Onboarding a Historical Company on the Cloud Journey
Marius Zaharia
 
PPTX
Moving to software-based production workflows and containerisation of media a...
Kieran Kunhya
 
PPTX
Fiware: Connecting to robots
Jaime Martin Losa
 
PDF
Monitoring, the Prometheus Way - Julius Voltz, Prometheus
Docker, Inc.
 
PPTX
Tech 2 tech low latency networking on Janet presentation
Jisc
 
PDF
Leveraging Cassandra for real-time multi-datacenter public cloud analytics
Julien Anguenot
 
PDF
iland Internet Solutions: Leveraging Cassandra for real-time multi-datacenter...
DataStax Academy
 
PPTX
Brad stack - Digital Health and Well-Being Festival
Digital Health Enterprise Zone
 
PDF
Intro to Databases
Sargun Dhillon
 
PDF
Fixing twitter
Roger Xia
 
PDF
Fixing_Twitter
liujianrong
 
John adams talk cloudy
John Adams
 
The impact of cloud NSBCon NY by Yves Goeleven
Particular Software
 
Performance Analysis: new tools and concepts from the cloud
Brendan Gregg
 
Build cloud native solution using open source
Nitesh Jadhav
 
Data Lake and the rise of the microservices
Bigstep
 
Birmingham-20060705
Miguel Vidal
 
node.js and Containers: Dispatches from the Frontier
bcantrill
 
Sync in an NFV World (Ram, ITSF 2016)
Adam Paterson
 
Sync in an NFV World (Ram, ITSF 2016)
Calnex Solutions
 
Onboarding a Historical Company on the Cloud Journey
Marius Zaharia
 
Moving to software-based production workflows and containerisation of media a...
Kieran Kunhya
 
Fiware: Connecting to robots
Jaime Martin Losa
 
Monitoring, the Prometheus Way - Julius Voltz, Prometheus
Docker, Inc.
 
Tech 2 tech low latency networking on Janet presentation
Jisc
 
Leveraging Cassandra for real-time multi-datacenter public cloud analytics
Julien Anguenot
 
iland Internet Solutions: Leveraging Cassandra for real-time multi-datacenter...
DataStax Academy
 
Brad stack - Digital Health and Well-Being Festival
Digital Health Enterprise Zone
 
Intro to Databases
Sargun Dhillon
 
Fixing twitter
Roger Xia
 
Fixing_Twitter
liujianrong
 
Ad

More from bcantrill (20)

PDF
Predicting the Present
bcantrill
 
PDF
Sharpening the Axe: The Primacy of Toolmaking
bcantrill
 
PDF
Coming of Age: Developing young technologists without robbing them of their y...
bcantrill
 
PDF
I have come to bury the BIOS, not to open it: The need for holistic systems
bcantrill
 
PDF
Towards Holistic Systems
bcantrill
 
PDF
The Coming Firmware Revolution
bcantrill
 
PDF
Hardware/software Co-design: The Coming Golden Age
bcantrill
 
PDF
Tockilator: Deducing Tock execution flows from Ibex Verilator traces
bcantrill
 
PDF
No Moore Left to Give: Enterprise Computing After Moore's Law
bcantrill
 
PDF
Andreessen's Corollary: Ethical Dilemmas in Software Engineering
bcantrill
 
PDF
Visualizing Systems with Statemaps
bcantrill
 
PDF
Platform values, Rust, and the implications for system software
bcantrill
 
PDF
Is it time to rewrite the operating system in Rust?
bcantrill
 
PDF
dtrace.conf(16): DTrace state of the union
bcantrill
 
PDF
The Hurricane's Butterfly: Debugging pathologically performing systems
bcantrill
 
PDF
Papers We Love: ARC after dark
bcantrill
 
PDF
Principles of Technology Leadership
bcantrill
 
PDF
Zebras all the way down: The engineering challenges of the data path
bcantrill
 
PDF
Platform as reflection of values: Joyent, node.js, and beyond
bcantrill
 
PDF
Debugging under fire: Keeping your head when systems have lost their mind
bcantrill
 
Predicting the Present
bcantrill
 
Sharpening the Axe: The Primacy of Toolmaking
bcantrill
 
Coming of Age: Developing young technologists without robbing them of their y...
bcantrill
 
I have come to bury the BIOS, not to open it: The need for holistic systems
bcantrill
 
Towards Holistic Systems
bcantrill
 
The Coming Firmware Revolution
bcantrill
 
Hardware/software Co-design: The Coming Golden Age
bcantrill
 
Tockilator: Deducing Tock execution flows from Ibex Verilator traces
bcantrill
 
No Moore Left to Give: Enterprise Computing After Moore's Law
bcantrill
 
Andreessen's Corollary: Ethical Dilemmas in Software Engineering
bcantrill
 
Visualizing Systems with Statemaps
bcantrill
 
Platform values, Rust, and the implications for system software
bcantrill
 
Is it time to rewrite the operating system in Rust?
bcantrill
 
dtrace.conf(16): DTrace state of the union
bcantrill
 
The Hurricane's Butterfly: Debugging pathologically performing systems
bcantrill
 
Papers We Love: ARC after dark
bcantrill
 
Principles of Technology Leadership
bcantrill
 
Zebras all the way down: The engineering challenges of the data path
bcantrill
 
Platform as reflection of values: Joyent, node.js, and beyond
bcantrill
 
Debugging under fire: Keeping your head when systems have lost their mind
bcantrill
 

Recently uploaded (20)

PDF
"Beyond English: Navigating the Challenges of Building a Ukrainian-language R...
Fwdays
 
PDF
Log-Based Anomaly Detection: Enhancing System Reliability with Machine Learning
Mohammed BEKKOUCHE
 
PDF
Bitcoin for Millennials podcast with Bram, Power Laws of Bitcoin
Stephen Perrenod
 
PDF
CIFDAQ Weekly Market Wrap for 11th July 2025
CIFDAQ
 
PDF
HCIP-Data Center Facility Deployment V2.0 Training Material (Without Remarks ...
mcastillo49
 
PPTX
"Autonomy of LLM Agents: Current State and Future Prospects", Oles` Petriv
Fwdays
 
PDF
Jak MŚP w Europie Środkowo-Wschodniej odnajdują się w świecie AI
dominikamizerska1
 
PPTX
OpenID AuthZEN - Analyst Briefing July 2025
David Brossard
 
PPTX
Q2 FY26 Tableau User Group Leader Quarterly Call
lward7
 
PDF
Reverse Engineering of Security Products: Developing an Advanced Microsoft De...
nwbxhhcyjv
 
PPTX
COMPARISON OF RASTER ANALYSIS TOOLS OF QGIS AND ARCGIS
Sharanya Sarkar
 
PPTX
Webinar: Introduction to LF Energy EVerest
DanBrown980551
 
PDF
HubSpot Main Hub: A Unified Growth Platform
Jaswinder Singh
 
PDF
CIFDAQ Market Insights for July 7th 2025
CIFDAQ
 
PDF
Transcript: New from BookNet Canada for 2025: BNC BiblioShare - Tech Forum 2025
BookNet Canada
 
PPTX
AI Penetration Testing Essentials: A Cybersecurity Guide for 2025
defencerabbit Team
 
PDF
Newgen Beyond Frankenstein_Build vs Buy_Digital_version.pdf
darshakparmar
 
PDF
Timothy Rottach - Ramp up on AI Use Cases, from Vector Search to AI Agents wi...
AWS Chicago
 
PDF
Agentic AI lifecycle for Enterprise Hyper-Automation
Debmalya Biswas
 
PPTX
Building Search Using OpenSearch: Limitations and Workarounds
Sease
 
"Beyond English: Navigating the Challenges of Building a Ukrainian-language R...
Fwdays
 
Log-Based Anomaly Detection: Enhancing System Reliability with Machine Learning
Mohammed BEKKOUCHE
 
Bitcoin for Millennials podcast with Bram, Power Laws of Bitcoin
Stephen Perrenod
 
CIFDAQ Weekly Market Wrap for 11th July 2025
CIFDAQ
 
HCIP-Data Center Facility Deployment V2.0 Training Material (Without Remarks ...
mcastillo49
 
"Autonomy of LLM Agents: Current State and Future Prospects", Oles` Petriv
Fwdays
 
Jak MŚP w Europie Środkowo-Wschodniej odnajdują się w świecie AI
dominikamizerska1
 
OpenID AuthZEN - Analyst Briefing July 2025
David Brossard
 
Q2 FY26 Tableau User Group Leader Quarterly Call
lward7
 
Reverse Engineering of Security Products: Developing an Advanced Microsoft De...
nwbxhhcyjv
 
COMPARISON OF RASTER ANALYSIS TOOLS OF QGIS AND ARCGIS
Sharanya Sarkar
 
Webinar: Introduction to LF Energy EVerest
DanBrown980551
 
HubSpot Main Hub: A Unified Growth Platform
Jaswinder Singh
 
CIFDAQ Market Insights for July 7th 2025
CIFDAQ
 
Transcript: New from BookNet Canada for 2025: BNC BiblioShare - Tech Forum 2025
BookNet Canada
 
AI Penetration Testing Essentials: A Cybersecurity Guide for 2025
defencerabbit Team
 
Newgen Beyond Frankenstein_Build vs Buy_Digital_version.pdf
darshakparmar
 
Timothy Rottach - Ramp up on AI Use Cases, from Vector Search to AI Agents wi...
AWS Chicago
 
Agentic AI lifecycle for Enterprise Hyper-Automation
Debmalya Biswas
 
Building Search Using OpenSearch: Limitations and Workarounds
Sease
 

Instrumenting the real-time web: Node.js in production

  • 1. Instrumenting the real-time web: Running node.js in production Bryan Cantrill VP, Engineering [email protected] @bcantrill
  • 2. “Real-time web?” • The term has enjoyed some popularity, but there is clearly confusion about the definition of “real-time” • A real-time system is one in which the correctness of the system is relative to its timeliness • A hard real-time system is one which the latency constraints are rigid: violation constitutes total system failure (e.g., an actuator on a physical device) • A soft real-time system is one in which latency constraints are more flexible: violation is undesirable but non-fatal (e.g., a video game or MP3 player) • Historically, the only real-time aspect of the web has been in some of its static content (e.g. video, audio)
  • 3. The rise of the real-time web • The rise of mobile + HTML5 has given rise to a new breed of web application: ones in which dynamic data has real-time semantics • These data-intensive real-time applications present new semantics for web-facing applications • These present new data semantics for web applications: CRUD, ACID, BASE, CAP — meet DIRT!
  • 4. The challenge of DIRTy apps • DIRTy applications tend to have the human in the loop • Good news: deadlines are soft — microseconds only matter when they add up to tens of milliseconds • Bad news: because humans are in the loop, demand for the system can be non-linear • One must deal not only with the traditional challenge of scalability, but also the challenge of a real-time system!
  • 5. Building DIRTy apps • Embedded real-time systems are sufficiently controlled that latency bubbles can be architected away • Web-facing systems are far too sloppy to expect this! • Focus must shift from preventing latency bubbles to preventing latency bubbles from cascading • Operations that can induce latency (network, I/O, etc.) must not be able to take the system out with them! • Implies purely asynchronous and evented architectures, which are notoriously difficult to implement...
  • 6. Enter node.js • node.js is a JavaScript-based framework for building event-oriented servers: var http = require(‘http’); http.createServer(function (req, res) { res.writeHead(200, {'Content-Type': 'text/plain'}); res.end('Hello Worldn'); }).listen(8124, "127.0.0.1"); console.log(‘Server running at http://127.0.0.1:8124!’);
  • 7. node.js as building block • node.js is a confluence of three ideas: • JavaScriptʼs rich support for asynchrony (i.e. closures) • High-performance JavaScript VMs (e.g. V8) • The system abstractions that God intended (i.e. UNIX) • Because everything is asynchronous, node.js is ideal for delivering scale in the presence of long-latency events!
  • 8. The primacy of latency • As the correctness of the system is its timeliness, we must be able to measure the system to verify it • In a real-time system, it does not make sense to measure operations per second! • The only metric that matters is latency • This is dangerous to distill to a single number; the distribution of latency over time is essential • This poses both instrumentation and visualization challenges!
  • 9. Instrumenting for latency • Instrumenting for latency requires modifying the system twice: as an operation starts and as it finishes • During an operation, the system must track — on a per- operation basis — the start time of the operation • Upon operation completion, the resulting stored data cannot be a scalar — the distribution is essential when understanding latency • Instrumentation must be systemic; must be able to reach to the sources of latency deep within the system • These constraints eliminate static instrumentation; we need a better way to instrument the system
  • 10. Enter DTrace • Facility for dynamic instrumentation of production systems originally developed circa 2003 for Solaris 10 • Open sourced (along with the rest of Solaris) in 2005; subsequently ported to many other systems (MacOS X, FreeBSD, NetBSD, QNX, nascent Linux port) • Support for arbitrary actions, arbitrary predicates, in situ data aggregation, statically-defined instrumentation • Designed for safe, ad hoc use in production: concise answers to arbitrary questions • Particularly well suited to real-time: the original design center was the understanding of latency bubbles
  • 11. DTrace + Node? • DTrace instruments the system holistically, which is to say, from the kernel, which poses a challenge for interpreted environments • User-level statically defined tracing (USDT) providers describe semantically relevant points of instrumentation • Some interpreted environments (e.g., Ruby, Python, PHP, Erlang) have added USDT providers that instrument the interpreter itself • This approach is very fine-grained (e.g., every function call) and doesnʼt work in JITʼd environments • We decided to take a different tack for Node
  • 12. DTrace for node.js • Given the nature of the paths that we wanted to instrument, we introduced a function into JavaScript that Node can call to get into USDT-instrumented C++ • Introduces disabled probe effect: calling from JavaScript into C++ costs even when probes are not enabled • We use USDT is-enabled probes to minimize disabled probe effect once in C++ • If (and only if) the probe is enabled, we prepare a structure for the kernel that allows for translation into a structure that is familiar to node programmers
  • 13. Node USDT Provider • Example one-liners: dtrace -n ‘node*:::http-server-request{ printf(“%s of %s from %sn”, args[0]->method, args[0]->url, args[1]->remoteAddress)}‘ dtrace -n http-server-request’{@[args[1]->remoteAddress] = count()}‘ dtrace -n gc-start’{self->ts = timestamp}’ -n gc-done’/self->ts/{@ = quantize(timestamp - self->ts)}’ • A script to measure HTTP latency: http-server-request { self->ts[args[1]->fd] = timestamp; } http-server-response /self->ts[args[0]->fd]/ { @[zonename] = quantize(timestamp - self->ts[args[0]->fd]); }
  • 14. User-defined USDT probes in node.js • Our USDT technique has been generalized by Chris Andrews in his node-dtrace-provider npm module: https://github.com/chrisa/node-dtrace-provider • Used by Joyentʼs Mark Cavage in his ldap.js to measure and validate operation latency • But how to visualize operation latency?
  • 15. Visualizing latency • Could visualize latency as a scalar (i.e., average): • This hides outliers — and in a real-time system, it is the outliers that you care about! • Using percentiles helps to convey distribution — but crucial detail remains hidden
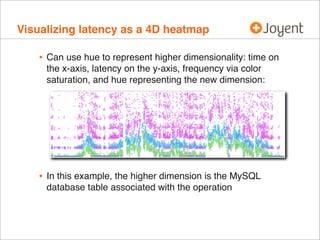
  • 16. Visualizing latency as a heatmap • Latency is much better visualized as a heatmap, with time on the x-axis, latency on the y-axis, and frequency represented with color saturation: • Many patterns are now visible (as in this example of MySQL query latency), but critical data is still hidden
  • 17. Visualizing latency as a 4D heatmap • Can use hue to represent higher dimensionality: time on the x-axis, latency on the y-axis, frequency via color saturation, and hue representing the new dimension: • In this example, the higher dimension is the MySQL database table associated with the operation
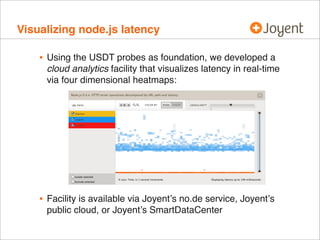
  • 18. Visualizing node.js latency • Using the USDT probes as foundation, we developed a cloud analytics facility that visualizes latency in real-time via four dimensional heatmaps: • Facility is available via Joyentʼs no.de service, Joyentʼs public cloud, or Joyentʼs SmartDataCenter
  • 19. Debugging latency • Latency visualization is essential for understanding where latency is being induced in a complicated system, but how can we determine why? • This requires associating an external event — an I/O request, a network packet, a profiling interrupt — with the code thatʼs inducing it • For node.js — like other dynamic environments — this is historically very difficult: the VM is opaque to the OS • Using DTraceʼs helper mechanism, we have developed a V8 ustack helper that allows OS-level events to be correlated to the node.js-backtrace that induced them • Available for node 0.6.7 on Joyentʼs SmartOS
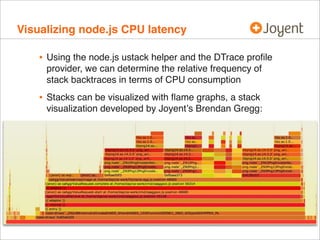
  • 20. Visualizing node.js CPU latency • Using the node.js ustack helper and the DTrace profile provider, we can determine the relative frequency of stack backtraces in terms of CPU consumption • Stacks can be visualized with flame graphs, a stack visualization developed by Joyentʼs Brendan Gregg:
  • 21. node.js in production • node.js is particularly amenable for the DIRTy apps that typify the real-time web • The ability to understand latency must be considered when deploying node.js-based systems into production! • Understanding latency requires dynamic instrumentation and novel visualization • At Joyent, we have added DTrace-based dynamic instrumentation for node.js to SmartOS, and novel visualization into our cloud and software offerings • Better production support — better observability, better debuggability — remains an important area of node.js development!
  • 22. Thank you! • @ryah and @rmustacc for Node DTrace USDT integration • @dapsays, @rmustacc, @rob_ellis and @notmatt for cloud analytics • @chrisandrews for node-dtrace-provider and @mcavage for putting it to such great use in ldap.js • @dapsays for the V8 DTrace ustack helper • @brendangregg for both the heatmap and flame graph visualizations • More information: http://dtrace.org/blogs/dap, http://dtrace.org/blogs/brendan and http://smartos.org