


![Abhay Kumar Rai, Rajiv Ranjan Tewari & Saurabh Kant Upadhyay
The rest of the paper is organized as follows. Section 2 explores the related work in the area of attacks on
MANET- Internet communication and stand alone MANET. Section 3 represents a detailed description of
different types of attacks on integrated MANET- Internet communication. In this section we consider most
common types of attacks on mobile ad hoc networks and on access point through which MANET is
connected to the Internet. Specifically, we study how different attacks affect the performance of the
network. We also discuss some secure routing protocols for integrated MANET- Internet communication
and find out the security issues which have not solved until now. Finally section 4 is about conclusions
and future work.
2. RELATED WORK
In this section we explore related work on security challenges in integrated MANET-Internet and stand
alone MANET.
The attacks on stand alone MANET and MANET-Internet communication have been normally studied
separately in the past literature. [1, 2] have considered only the attacks on stand alone MANET. [3, 4]
have proposed the frameworks to provide security from different types of attacks on MANET but they
have considered only the attacks on the stand alone MANET. Xie and Kumar [5] and Kandikattu and
Jacob [6] have considered both types of attacks (on MANET- Internet and on stand alone MANET
communication) but their proposed routing protocols have considered them separately.
3. ATTACKS ON MANET-INTERNET COMMUNICATION
An integrated Internet and mobile ad hoc network can be subject to many types of attacks. These attacks
can be classified into two categories, attacks on Internet connectivity and attacks on mobile ad hoc
networks.
3.1 Attacks on Internet Connectivity
Attacks on Internet connectivity can be classified into following categories:
3.1.1 Bogus Registration
A bogus registration is an active attack in which an attacker does a registration with a bogus care-of-
address by masquerading itself as some one else. By advertising fraudulent beacons, an attacker might
be able to attract a MN (mobile node) to register with the attacker as if MN has reached HA (home agent)
or FA (foreign agent). Now, the attacker can capture sensitive personal or network data for the purpose of
accessing network and may disrupt the proper functioning of network. It is difficult for an attacker to
implement such type of attack because the attacker must have detailed information about the agent.
3.1.2 Replay Attack
A replay attack is a form of network attack in which a valid data transmission is maliciously or fraudulently
repeated or delayed. This is carried out either by the originator or by an adversary who intercepts the data
and retransmits it.
Suppose any mobile node A wants to prove its identity to B. B requests his password as proof of identity,
which A dutifully provides (possibly after some transformation like a hash function); at the same time, C is
eavesdropping the conversation and keeps the password. After the interchange is over, C connects to B
presenting itself as A; when asked for a proof of identity, C sends A's password read from the last
session, which B accepts. Now, it may ruin the proper operation of the network.
3.1.3 Forged FA
It is a form of network attack in which a node advertises itself as a fraudulent FA then MN’s under the
coverage of the forged FA may register with it. Now, forged FA can capture the sensitive network data
and may disrupt the proper functioning of the network.
In general, attacks on Internet connectivity are caused by malicious nodes that may modify, drop or
generate messages related to mobile IP such as advertisement, registration request or reply to disrupt the
global Internet connectivity.
International Journal of Computer Science and Security (IJCSS) Volume (4): Issue (3) 266](https://image.slidesharecdn.com/ijcssv4i3-110103003116-phpapp02/85/International-Journal-of-Computer-Science-and-Security-IJCSS-Volume-4-Issue-3-10-320.jpg)
![Abhay Kumar Rai, Rajiv Ranjan Tewari & Saurabh Kant Upadhyay
Bin Xie and Anup Kumar [5] have proposed a secure routing protocol for integrated MANET-Internet
communication. It achieves the goals of preventing the attacks from malicious nodes. If a node
counterfeits a registration by inventing a non-existent address, its registration will fail at HA while HA
validates the secret key of the malicious node. It prevents attacks due to bogus registration requests,
replay attacks caused by malicious nodes, preventing the attacks of advertising fraudulent beacons by a
counterfeit agent and preventing the attacks using old registration messages by a malicious node. But the
proposed protocol uses digital signature based hop by hop authentication in route discovery which floods
the route request in entire network. Hence every node in the network gets involved in the signature
generation and verification process which consumes a lot of node’s resources.
Ramanarayana & Jacob [6] have proposed a protocol named as secure global dynamic source routing
protocol (SGDSR) in which the mutual authentication of MN, FA and HA is carried out with the help of
public key and shared key cryptography techniques. It uses light weight hash codes for sign generation
and verification, which greatly reduces the computational load as well as processing delay at each node
without compromising security. But it also uses public key cryptography partly in the mutual authentication
of MN, FA and HA which increases computational overhead.
K. Ramanarayana and Lillykutty Jacob [7] have proposed a light weight solution for secure routing in
integrated MANET-Internet communication named as IGAODV (IBC-based secure global AODV). The
secure registration process adopted in this protocol supports mutual authentication of MN, FA and HA
with help of identity based cryptography techniques. All the registration messages contain time stamp to
avoid replay attacks and signature to protect the message from modification attacks and to ensure that
the message is originated by an authorized party. Registration process builds trust among MN, HA and
FA and ensures that they are communicating with authorized nodes and not with any fraudulent node. But
it does not prevent from many internal attacks.
Vaidya, Pyun and Nak-Yong Ko [8] have proposed a secure framework for integrated multipath MANET
with Internet. In this scheme a secret key between mobile node and home agent is shared between them
for authentication purpose. Therefore, it is not possible for an attacker to obtain the secret key SMN-HA, so
it has no knowledge of session key. Since session key is frequently changed so this will prevent guessing
attack. The temporary session key that is distributed by the HA can be used to encrypt the
communications data. This provides the data confidentiality between the FA and MN over the air. To
achieve a high level of security, it is designed that a node only accepts messages from verified one hop
neighbors. The proposed protocol provides a secure framework for global connectivity with multipath
MANET but it does not prevent many internal attacks.
3.2 Attacks on Mobile Ad hoc Networks
Attacks on mobile ad hoc networks can be classified into following two categories:
3.2.1 Passive Attacks
A passive attack does not disrupt proper operation of the network. The attacker snoops the data
exchanged in the network without altering it. Here, the requirement of confidentiality can be violated if an
attacker is also able to interpret the data gathered through snooping. Detection of passive attacks is very
difficult since the operation of the network itself does not get affected. One way of preventing such
problems is to use powerful encryption mechanisms to encrypt the data being transmitted, thereby
making it impossible for eavesdroppers to obtain any useful information from the data overheard. There is
an attack which is specific to the passive attack a brief description about it is given below:
3.2.1.1 Snooping
Snooping is unauthorized access to another person's data. It is similar to eavesdropping but is not
necessarily limited to gaining access to data during its transmission. Snooping can include casual
observance of an e-mail that appears on another's computer screen or watching what someone else is
typing. More sophisticated snooping uses software programs to remotely monitor activity on a computer
or network device.
Malicious hackers (crackers) frequently use snooping techniques to monitor key strokes, capture
passwords and login information and to intercept e-mail and other private communications and data
International Journal of Computer Science and Security (IJCSS) Volume (4): Issue (3) 267](https://image.slidesharecdn.com/ijcssv4i3-110103003116-phpapp02/85/International-Journal-of-Computer-Science-and-Security-IJCSS-Volume-4-Issue-3-11-320.jpg)

![Abhay Kumar Rai, Rajiv Ranjan Tewari & Saurabh Kant Upadhyay
The wormhole attack is particularly dangerous for many ad hoc network routing protocols in which the
nodes that hear a packet transmission directly from some node consider themselves to be in range of
(and thus a neighbor of) that node. For example, when used against an on-demand routing protocols
such as DSR [9], a powerful application of the wormhole attack can be mounted by tunneling each route
request packet directly to the destination target node of the request. When the destination node’s
neighbors hear this request packet, they will follow normal routing protocol processing to rebroadcast that
copy of the request and then discard without processing all other received route request packets
originating from this same route discovery. This attack thus prevents any routes other than through the
wormhole from being discovered, and if the attacker is near the initiator of the route discovery. This attack
can even prevent routes more than two hops long from being discovered. Possible ways for the attacker
to then exploit the wormhole include discarding rather than forwarding all data packets, thereby creating a
permanent Denial-of-Service attack or selectively discarding or modifying certain data packets. So, if
proper mechanisms are not employed to protect the network from wormhole attacks, most of the existing
routing protocols for ad hoc wireless networks may fail to find valid routes.
3.2.2.1.2 Black hole Attack
In this attack, an attacker uses the routing protocol to advertise itself as having the shortest path to the
node whose packets it wants to intercept. An attacker listen the requests for routes in a flooding based
protocol. When the attacker receives a request for a route to the destination node, it creates a reply
consisting of an extremely short route. If the malicious reply reaches the initiating node before the reply
from the actual node, a fake route gets created. Once the malicious device has been able to insert itself
between the communicating nodes, it is able to do anything with the packets passing between them. It
can drop the packets between them to perform a denial-of-service attack, or alternatively use its place on
the route as the first step in a man-in-the-middle attack.
For example, in Fig. 2, source node S wants to send data packets to destination node D and initiates the
route discovery process. We assume that node 2 is a malicious node and it claims that it has route to the
destination whenever it receives route request packets, and immediately sends the response to node S. If
the response from the node 2 reaches first to node S then node S thinks that the route discovery is
complete, ignores all other reply messages and begins to send data packets to node 2. As a result, all
packets through the malicious node is consumed or lost.
FIGURE 2: Black hole attack
3.2.2.1.3 Byzantine Attack
In this attack, a compromised intermediate node or a set of compromised intermediate nodes works in
collusion and carries out attacks such as creating routing loops, forwarding packets on non-optimal paths
and selectively dropping packets [10] which results in disruption or degradation of the routing services. It
is hard to detect byzantine failures. The network would seem to be operating normally in the viewpoint of
the nodes, though it may actually be showing Byzantine behavior.
3.2.2.1.4 Information Disclosure
Any confidential information exchange must be protected during the communication process. Also, the
critical data stored on nodes must be protected from unauthorized access. In ad hoc networks, such
information may contain anything, e.g., the specific status details of a node, the location of nodes, private
International Journal of Computer Science and Security (IJCSS) Volume (4): Issue (3) 269](https://image.slidesharecdn.com/ijcssv4i3-110103003116-phpapp02/85/International-Journal-of-Computer-Science-and-Security-IJCSS-Volume-4-Issue-3-13-320.jpg)
![Abhay Kumar Rai, Rajiv Ranjan Tewari & Saurabh Kant Upadhyay
keys or secret keys, passwords, and so on. Sometimes the control data are more critical for security than
the traffic data. For instance, the routing directives in packet headers such as the identity or location of
the nodes can be more valuable than the application-level messages. A compromised node may leak
confidential or important information to unauthorized nodes present in the network. Such information may
contain information regarding the network topology, geographic location of nodes or optimal routes to
authorized nodes in the network.
3.2.2.1.5 Resource Consumption Attack
In this attack, an attacker tries to consume or waste away resources of other nodes present in the
network. The resources that are targeted are battery power, bandwidth, and computational power, which
are only limitedly available in ad hoc wireless networks. The attacks could be in the form of unnecessary
requests for routes, very frequent generation of beacon packets, or forwarding of stale packets to nodes.
Using up the battery power of another node by keeping that node always busy by continuously pumping
packets to that node is known as a sleep deprivation attack.
3.2.2.1.6 Routing Attacks
There are several attacks which can be mounted on the routing protocols and may disrupt the proper
operation of the network. Brief descriptions of such attacks are given below:
Routing Table Overflow: In the case of routing table overflow, the attacker creates routes to nonexistent
nodes. The goal is to create enough routes to prevent new routes from being created or to overwhelm the
protocol implementation. In the case of proactive routing algorithms we need to discover routing
information even before it is needed, while in the case of reactive algorithms we need to find a route only
when it is needed. Thus main objective of such an attack is to cause an overflow of the routing tables,
which would in turn prevent the creation of entries corresponding to new routes to authorized nodes.
Routing Table Poisoning: In routing table poisoning, the compromised nodes present in the networks
send fictitious routing updates or modify genuine route update packets sent to other authorized nodes.
Routing table poisoning may result in sub-optimal routing, congestion in portions of the network, or even
make some parts of the network inaccessible.
Packet Replication: In the case of packet replication, an attacker replicates stale packets. This
consumes additional bandwidth and battery power resources available to the nodes and also causes
unnecessary confusion in the routing process.
Route Cache Poisoning: In the case of on-demand routing protocols (such as the AODV protocol [11]),
each node maintains a route cache which holds information regarding routes that have become known to
the node in the recent past. Similar to routing table poisoning, an adversary can also poison the route
cache to achieve similar objectives.
Rushing Attack: On-demand routing protocols that use duplicate suppression during the route discovery
process are vulnerable to this attack [12]. An attacker which receives a route request packet from the
initiating node floods the packet quickly throughout the network before other nodes which also receive the
same route request packet can react. Nodes that receive the legitimate route request packets assume
those packets to be duplicates of the packet already received through the attacker and hence discard
those packets. Any route discovered by the source node would contain the attacker as one of the
intermediate nodes. Hence, the source node would not be able to find secure routes, that is, routes that
do not include the attacker. It is extremely difficult to detect such attacks in ad hoc wireless networks.
3.2.2.2 Transport Layer Attacks
There is an attack which is specific to the transport layer a brief description about it is given below:
3.2.2.2.1 Session Hijacking
Session hijacking is a critical error and gives an opportunity to the malicious node to behave as a
legitimate system. All the communications are authenticated only at the beginning of session setup. The
attacker may take the advantage of this and commit session hijacking attack. At first, he or she spoofs the
IP address of target machine and determines the correct sequence number. After that he performs a DoS
International Journal of Computer Science and Security (IJCSS) Volume (4): Issue (3) 270](https://image.slidesharecdn.com/ijcssv4i3-110103003116-phpapp02/85/International-Journal-of-Computer-Science-and-Security-IJCSS-Volume-4-Issue-3-14-320.jpg)
![Abhay Kumar Rai, Rajiv Ranjan Tewari & Saurabh Kant Upadhyay
attack on the victim. As a result, the target system becomes unavailable for some time. The attacker now
continues the session with the other system as a legitimate system.
3.2.2.3 Application Layer Attacks
There is an attack that is specific to application layer and a brief description about it is given below:
3.2.2.3.1 Repudiation
In simple terms, repudiation refers to the denial or attempted denial by a node involved in a
communication of having participated in all or part of the communication. Example of repudiation attack is
a commercial system in which a selfish person could deny conducting an operation on a credit card
purchase or deny any on-line transaction Non-repudiation is one of the important requirements for a
security protocol in any communication network.
3.2.2.4 Multi-layer Attacks
Here we will discuss security attacks that cannot strictly be associated with any specific layer in the
network protocol stack. Multi-layer attacks are those that could occur in any layer of the network protocol
stack. Denial of service and impersonation are some of the common multi-layer attacks. Here we will
discuss some of the multi-layer attacks in ad hoc wireless networks.
3.2.2.4.1 Denial of Service
In this type of attack, an attacker attempts to prevent legitimate and authorized users from the services
offered by the network. A denial of service (DoS) attack can be carried out in many ways. The classic way
is to flood packets to any centralized resource present in the network so that the resource is no longer
available to nodes in the network, as a result of which the network no longer operating in the manner it
was designed to operate. This may lead to a failure in the delivery of guaranteed services to the end
users. Due to the unique characteristics of ad hoc wireless networks, there exist many more ways to
launch a DoS attack in such a network, which would not be possible in wired networks. DoS attacks can
be launched against any layer in the network protocol stack [13]. On the physical and MAC layers, an
adversary could employ jamming signals which disrupt the on-going transmissions on the wireless
channel. On the network layer, an adversary could take part in the routing process and exploit the routing
protocol to disrupt the normal functioning of the network. For example, an adversary node could
participate in a session but simply drop a certain number of packets, which may lead to degradation in the
QoS being offered by the network. On the higher layers, an adversary could bring down critical services
such as the key management service.
For example, consider the following Fig. 3. Assume a shortest path exists from S to X and C and X
cannot hear each other, that nodes B and C cannot hear each other, and that M is a malicious node
attempting a denial of service attack. Suppose S wishes to communicate with X and that S has an
unexpired route to X in its route cache. S transmits a data packet toward X with the source route S --> A -
-> B --> M --> C --> D --> X contained in the packet’s header. When M receives the packet, it can alter
the source route in the packet’s header, such as deleting D from the source route. Consequently, when C
receives the altered packet, it attempts to forward the packet to X. Since X cannot hear C, the
transmission is unsuccessful.
FIGURE 3: Denial of service attack
Some of the DoS attacks are described below:
Jamming: In this form of attack, the attacker initially keeps monitoring the wireless medium in order to
determine the frequency at which the destination node is receiving signals from the sender. It then
transmits signals on that frequency so that error-free reception at the receiver is hindered. Frequency
hopping spread spectrum (FHSS) and direct sequence spread spectrum (DSSS) are two commonly used
techniques that overcome jamming attacks.
International Journal of Computer Science and Security (IJCSS) Volume (4): Issue (3) 271](https://image.slidesharecdn.com/ijcssv4i3-110103003116-phpapp02/85/International-Journal-of-Computer-Science-and-Security-IJCSS-Volume-4-Issue-3-15-320.jpg)
![Abhay Kumar Rai, Rajiv Ranjan Tewari & Saurabh Kant Upadhyay
SYN Flooding: In this form of attack, a malicious node sends a large amount of SYN packets to a victim
node, spoofing the return addresses of the SYN packets. The SYN-ACK packets are sent out from the
victim right after it receives the SYN packets from the attacker and then the victim waits for the response
of ACK packet. Without any response of ACK packets, the half-open data structure remains in the victim
node. If the victim node stores these half-opened connections in a fixed-size table while it awaits the
acknowledgement of the three-way handshake, all of these pending connections could overflow the
buffer, and the victim node would not be able to accept any other legitimate attempts to open a
connection. Normally there is a time-out associated with a pending connection, so the half-open
connections will eventually expire and the victim node will recover. However, malicious nodes can simply
continue sending packets that request new connections faster than the expiration of pending connections.
Distributed DoS Attack: Distributed denial of service attack is more severe form of denial of service
attack because in this attack several adversaries that are distributed throughout the network collude and
prevent legitimate users from accessing the services offered by the network.
3.2.2.4.2 Impersonation
In this attack, a compromised node may get access to the network management system of the network
and may start changing the configuration of the system as a super-user who has special privileges. An
attacker could masquerade as an authorized node using several methods. It may be possible that by
chance it can guess the identity and authentication details of the authorized node or target node, or it may
snoop information regarding the identity and authentication of the target node from a previous
communication, or it could disable the authentication mechanism at the target node. A man-in-the-middle
attack is an example of impersonation attack. Here, the attacker reads and possibly modifies messages
between two end nodes without letting either of them know that they have been attacked. Suppose two
nodes A and B are communicating with each other; the attacker impersonates node B with respect to
node A and impersonates node A with respect to node B, exploiting the lack of third-party authentication
of the communication between nodes A and B.
In the protocol given by Bin Xie and Anup Kumar [5], there is a defense mechanism due to which a node
cannot generate a valid route discovery message by spoofing or inventing an IP address. In the route
discovery process, control messages created by a node must be signed and validated by a receiving
node. Therefore the route discovery prevents anti-authenticating attacks such as creating routing loop,
fabrication because no node can create and sign a packet in the name of a spoofed or invented node.
Since there is no centralized administration hence MN’s can change their identities easily. But in the
proposed approach, the ad hoc host’s home address is bound with their identities in ad hoc network.
Therefore, it becomes difficult for any ad hoc host to masquerade itself by creating a valid address.
Nonce and timestamp make a route request or route reply containing unique data to prevent duplication
from a malicious node. But, it is not secured from some internal attacks like resource consumption attack,
black hole attack.
In the protocol given by Ramanarayana & Jacob [6], the secure registration adopted prevents
impersonation, modification and fabrication attacks by any fraudulent node but gives no security from
internal attacks such as black hole attack, wormhole attack and resource consumption attack.
The protocol given by K. Ramanarayana and Lillykutty Jacob [7] is resistant against modification and
fabrication attacks on the source route because intermediate nodes authenticate the route based on the
token, which is not revealed until the exchange of route request and route reply has finished. In the route
request phase end-to-end authentication avoids impersonation of source and destination nodes. End-to-
end integrity in the route request phase avoids modification attacks caused by intermediate nodes. Hop-
by-hop authentication in the route reply phase avoids external malicious nodes to participate in the
routing protocol and avoids the attacks caused by them. But the proposed protocol is not resistant to
collaborative, black hole and gray hole attacks.
In the protocol proposed by Vaidya, Pyun and Nak-Yong Ko [8], modification attacks have been removed.
Route request and route reply packets are signed by the source node and validated by intermediate
nodes along the path. If there are altered packets, they would be subsequently discarded. Hence route
request and route reply packets remain unaltered and modification attacks are prevented. Every routing
International Journal of Computer Science and Security (IJCSS) Volume (4): Issue (3) 272](https://image.slidesharecdn.com/ijcssv4i3-110103003116-phpapp02/85/International-Journal-of-Computer-Science-and-Security-IJCSS-Volume-4-Issue-3-16-320.jpg)


![G.S. Mamatha & S.C. Sharma
A Robust Approach to Detect and Prevent Network Layer
Attacks in MANETS
G. S. Mamatha mamatha.niranjan@gmail.com
Assistant Professor/ISE Department
R. V. College of Engineering
Bangalore, 560059, India
Dr. S. C. Sharma scsrvrd@yahoo.co.in
Vice Chancellor
Tumkur University
Tumkur, 572 101, India
Abstract
A dynamic wireless network that is formed without any pre-existing infrastructure,
in which every node can act as a router is called a mobile ad hoc network
(MANET). Since MANETS has not got clear cut security provisions, it is
accessible to any of the authorized network users and malicious attackers. The
greatest challenge for the MANETS is to come with a robust security solution
even in the presence of malicious nodes, so that MANET can be protected from
various routing attacks. Several countermeasures have been proposed for these
routing attacks in MANETS using various cryptographic techniques. But most of
these mechanisms are not considerably suitable for the resource constraints, i.e.,
bandwidth limitation and battery power, since they results in heavy traffic load for
exchanging and verification of keys. In this paper, a new semantic security
solution is provided, which suits for the different MANET constraints and also is
robust in nature, since it is able to identify and prevent four routing attacks
parallelly. The experimental analysis shows the identification and prevention of
the four attacks parallelly I.e., packet dropping, message tampering, black hole
attack and gray hole attack.
Keywords: MANET, Security, Robust, Malicious nodes, Semantic security, Routing attacks
1. INTRODUCTION
A MANET has got some of the important properties like self organized and rapid deployable
capability; which makes it widely used in various applications like emergency operations,
battlefield communications, relief scenarios, law enforcement, public meeting, virtual class rooms
and other security-sensitive computing environments [1]. There are several issues in MANETS
which addresses the areas such as IP addressing, radio interference, routing protocols, power
Constraints, security, mobility management, bandwidth constraints, QOS, etc;. As of now some
hot issues in MANETS can be related to the routing protocols, routing attacks, power and
bandwidth constraints, and security, which have raised lot of interest in researchers. Even though
in this paper we only focus on the routing attacks and security issue in MANETS.
The MANET security can be classified in to 5 layers, as Application layer, Transport layer,
Network layer, Link layer, and Physical layer. However, the focus is on the network layer, which
International Journal of Computer Science and Security, Volume (4): Issue (3) 275](https://image.slidesharecdn.com/ijcssv4i3-110103003116-phpapp02/85/International-Journal-of-Computer-Science-and-Security-IJCSS-Volume-4-Issue-3-19-320.jpg)
![G.S. Mamatha & S.C. Sharma
considers mainly the security issues to protect the ad hoc routing and forwarding protocols. When
the security design perspective in MANETS is considered it has not got a clear line defense.
Unlike wired networks that have dedicated routers, each mobile node in an ad hoc network may
function as a router and forward packets for other peer nodes. The wireless channel is accessible
to both legitimate network users and malicious attackers. There is no well defined place where
traffic monitoring or access control mechanisms can be deployed. As a result, the boundary that
separates the inside network from the outside world becomes blurred. On the other hand, the
existing ad hoc routing protocols, such as (AODV (Ad Hoc on Demand Distance vector protocol))
[2] [3], (DSR (Dynamic Source Routing)) [4], and wireless MAC protocols, such as 802.11 [5],
typically assume a trusted and cooperative environment. As a result, a malicious attacker can
readily become a router and disrupt network operations by intentionally disobeying the protocol
specifications. Recently, several research efforts introduced to counter against these malicious
attacks. Most of the previous work has focused mainly on providing preventive schemes to
protect the routing protocol in a MANET. Most of these schemes are based on key management
or encryption techniques to prevent unauthorized nodes from joining the network. In general, the
main drawback of these approaches is that they introduce a heavy traffic load to exchange and
verify keys, which is very expensive in terms of the bandwidth-constraint for MANET nodes with
limited battery and limited computational capabilities. The MANET protocols are facing different
routing attacks, such as flooding, black hole; link withholding, link spoofing, replay, wormhole, and
colluding misrelay attack. A comprehensive study of these routing attacks and countermeasures
against these attacks in MANET can be found in [6] [1].
The main goal of the security requirements for MANET is to provide a security protocol, which
should meet the properties like confidentiality, integrity, availability and non-repudiation to the
mobile users. In order to achieve this goal, the security approach should provide overall
protection that spans the entire protocol stack. But sometimes the security protocol may not be
able to meet the requirements as said above and results in a packet forwarding misbehavior. That
is why the approach proposed here is not coupled to any specific routing protocol and, therefore,
it can operate regardless of the routing strategy used.
The main criterion for identification of a malicious node is the estimated percentage of packets
dropped, which is compared against a pre-established misbehavior threshold. Any other node
which drops packets in excess of the pre-established misbehavior threshold is said to be
misbehaving, while for those nodes percentage of dropping packets is below the threshold are
said to be properly behaving. The approach proposed here identifies and prevents misbehaving
nodes (malicious), which are capable of launching four routing attacks parallelly: the black hole
attack, wherein a misbehaving node drops all the packets that it receives instead of normally
forwarding them. A variation of this attack is the gray hole attack, in which nodes either drop
packets selectively (e.g. dropping all UDP packets while forwarding TCP packets) or drop packets
in a statistical manner (e.g. dropping 50% of the packets or dropping them with a probabilistic
distribution). The gray hole attacks of this types will anyhow disrupt the network operation, if
proper security measures are not used to detect them in place [7]. A simple eavesdropping of
packets attack and message tampering attacks are also identified and prevented by the proposed
approach.
The proposed approach is demonstrated through a practical experiment for an appropriate
selection misbehaved and well-behaved nodes using a misbehavior threshold. We tested for the
robustness of the approach against fixed node mobility in a network that is affected parallelly by
four attacks.
The rest of this paper is organized as follows. Section II describes related work in the area of
MANET security. Section III describes the proposed algorithm for packet forwarding misbehavior
identification and prevention, and Section IV presents the experimental analysis and performance
evaluation. Finally, the paper is concluded in Section V.
International Journal of Computer Science and Security, Volume (4): Issue (3) 276](https://image.slidesharecdn.com/ijcssv4i3-110103003116-phpapp02/85/International-Journal-of-Computer-Science-and-Security-IJCSS-Volume-4-Issue-3-20-320.jpg)
![G.S. Mamatha & S.C. Sharma
2. RELATED WORK
Reliable network connectivity in wireless networks is achieved if some counter measures are
taken to avoid data packet forwarding against malicious attacks. A lot of research has taken place
to avoid malicious attackers like, a Survey on MANET Intrusion Detection [8], Advanced
Detection of Selfish or Malicious Nodes in Ad hoc Networks [9], Detecting Network Intrusions via
Sampling : A Game Theoretic Approach [10], Collaborative security architecture for black hole
attack prevention in mobile ad hoc networks [11], A Distributed Security Scheme for Ad Hoc
Networks [6], Wormhole attacks detection in wireless ad hoc networks: a statistical analysis
approach [12], Enhanced Intrusion Detection System for Discovering Malicious Nodes in Mobile
Ad Hoc Networks [13], Detection and Accusation of Packet Forwarding Misbehavior in Mobile Ad-
Hoc networks[7], WAP: Wormhole Attack Prevention Algorithm in Mobile Ad Hoc Networks [4], A
Reliable and Secure Framework for Detection and Isolation of Malicious Nodes in MANET [14],
Secure Routing Protocol with Malicious Nodes Detection for Ad Hoc Networks (ARIADNE) [15], A
Cooperative Black hole Node Detection Mechanism for ADHOC Networks [5], Malicious node
detection in Ad Hoc networks using timed automata [16], Addressing Collaborative Attacks and
Defense in Ad Hoc Wireless Networks [17], dpraodv: a dynamic learning system against black
hole attack in aodv based manet [18], and Performance Evaluation of the Impact of Attacks on
Mobile Ad hoc Networks [19]. All these research work reveals that a single or to a maximum of
two or three attacks identification and prevention using some approach is considered. Our
solution to this research gap is to provide a semantic security scheme that considers a minimum
of 4 attacks identification and prevention parallelly using a simple acknowledgement approach.
The above related study justifies that, the proposed scheme is not considered anywhere and is a
new security solution for network layer attacks. The reason to concentrate on network layer
attacks because; as we know a MANETS network connectivity is mainly through the link-layer
protocols and network-layer protocols. The Link-layer protocols are used to ensure one-hop
connectivity while network-layer protocols extend this connectivity to multiple hops [2]. So only to
incorporate MANETS security we can consider two possible counter measures namely, link-layer
security and network-layer security. Link-layer security is to protect the one-hop connectivity
between two adjacent nodes that are within each other’s communication range through secure
protocols, such like the IEEE 802.11 WEP protocol [3] or the more recently proposed
802.11i/WPA protocol [20] [2].
The network-layer security mainly considers for delivering the packets between mobile nodes in a
secure manner through multihop ad hoc forwarding. This ensures that the routing message
exchange within the packets between nodes is consistent with the protocol specification. Even
the packet forwarding of every node is consistent with its routing states. Accordingly, the
protocols are broadly classified in to two categories: secure ad hoc routing protocols and secure
packet forwarding protocols. The paper mainly discusses about the network-layer security.
3. PROPOSED APPROACH
The routing attacks like black hole, gray hole, worm hole, rushing attack, DOS attack, flooding
etc; can become hazardous to the network-layer protocol which needs to be protected. Further
the malicious nodes may deny forwarding packets properly even they have found to be genuine
during the routing discovery phase. A malicious node can pretend to join the routing correctly but
later goes on ignoring all the packets that pass through it rather than forwarding them. This attack
is called black hole, or selective forward of some packets is known as grey hole attack. The basic
solution needed to resolve these types of problems is to make sure that every node in a network
forwards packets to its destination properly. To ensure this kind of security to network layer in
MANETS a new secure approach which uses a simple acknowledgement approach and principle
of flow conservation is proposed here.
As a part of this research work we have tried the same approach with AODV protocol and it has
identified two of the attacks namely message tampering and packet eavesdropping. Here, in this
International Journal of Computer Science and Security, Volume (4): Issue (3) 277](https://image.slidesharecdn.com/ijcssv4i3-110103003116-phpapp02/85/International-Journal-of-Computer-Science-and-Security-IJCSS-Volume-4-Issue-3-21-320.jpg)

![G.S. Mamatha & S.C. Sharma
node, the sender waits for the acknowledgement packet to reach. Once it receives the
acknowledgement packet it computes the time taken for this acknowledgement to reach I.e. the
end time. If the total transmission time taken I.e. (end-start) is more than the pre-specified interval
of 20 ms, it discards the corresponding data packet and accounts it as lost data packet, thereby
incrementing the Cmiss counter. Else it checks for the contents of acknowledgement field. If the
ratio of (Cmiss/Cpkt)>=20%, then the intermediate node is said to be misbehaving and a new
field “CONFIDENTIALITY LOST” is built in to the acknowledgement frame. In such a case,
sender switches to an alternate intermediate node for the future sessions. Otherwise another new
field “ACK” is built in to the acknowledgement frame. In this case the intermediate node is
considered to be behaving as expected and transmission is continued with the same intermediate
node. Such intermediate nodes can be called genuine nodes.
Simultaneously malicious nodes are identified and prevented which launch attacks. The algorithm
mainly identifies four attacks parallelly namely packet eavesdropping, message tampering, black
hole attack and gray hole attack. This reason makes the algorithm more robust in nature against
other approaches. Even it can also be extended to few more network layer attacks.
The attacks explanation is as follows:
1.Packet eavesdropping: In mobile ad hoc networks since nodes can move arbitrarily the network
topology which is typically multi hop can change frequently and unpredictably resulting in route
changes, frequent network partitions and possibly packet losses. Some of the malicious nodes
tend to drop packets intentionally to save their own resources and disturb the network operation.
This particular attack is identified by the value of the (Cmiss/Cpkt) ratio. If (Cmiss/Cpkt)>20%,
them link contains a malicious node launching packet eavesdropping attack.
2. Message tampering: The intermediate nodes sometimes don’t follow the network security
principle of integrity. They will tend to tamper the data that has been sent either by deleting some
bytes or by adding few bytes to it. This attack can be an intentional malicious activity by the
intermediate nodes. The algorithm identifies such nodes and attack by the value of the ratio
calculated for different data transmissions.
If the acknowledgement frame sent by the receiver contains “CONFIDENTIALITY LOST” field in
it, then the node is said to be tampered the data sent. Along with that if the ratio
(Cmiss/Cpkt)>20%, then link is said to be misbehaving and message tampering attack is
identified.
3. Black hole attack: In this attack a misbehaving node drops all the packets that it receives
instead of normally forwarding those [2]. The routing message exchange is only one part of the
network-layer protocol which needs to be protected. It is still possible that malicious nodes deny
forwarding packets correctly even they have acted correctly during the routing discovery phase.
For example, a malicious node can join the routing correctly but simply ignore all the packets
passing through it rather than forwarding them, known as black hole attack [2] [21] [22]. In a
blackhole attack, a malicious node sends fake routing information, claiming that it has an
optimum route and causes other good nodes to route data packets through the malicious one.
For example, in AODV, the attacker can send a fake RREP (including a fake destination
sequence number that is fabricated to be equal or higher than the one contained in the RREQ) to
the source node, claiming that it has a sufficiently fresh route to the destination node. This cause
the source node to select the route that passes through the attacker. Therefore, all traffic will be
routed through the attacker, and therefore, the attacker can misuse or discard the traffic [1].
This attack is identified if the ratio (Cmiss/Cpkt)>=1.0, then all the sent packets are said to be lost
or eavesdropped by the malicious node.
4. Gray hole attack: A variation of the black hole attack is the gray hole attack [7]. This attack
when launched by the intermediate nodes selectively eaves drop the packets I.e. 50% of the
packets, instead of forwarding all.
This attack is identified if the ratio (Cmiss/Cpkt)>0.2 and (Cmiss/Cpkt) = 0.5, then we can say half
of the packets that have been sent are eaves dropped by the malicious node.
International Journal of Computer Science and Security, Volume (4): Issue (3) 279](https://image.slidesharecdn.com/ijcssv4i3-110103003116-phpapp02/85/International-Journal-of-Computer-Science-and-Security-IJCSS-Volume-4-Issue-3-23-320.jpg)
![G.S. Mamatha & S.C. Sharma
4. EXPERIMENTAL ANALYSIS
The proposed algorithm was practically implemented and tested in a lab terrain with 24 numbers
of nodes in the network. Through the experiment analysis it is found that the algorithm exactly
shows the results for four attacks parallelly namely packet eaves dropping, message tampering,
black hole attack and gray hole attack. To analyze the semantic security mechanism, two laptops
are connected at both the ends in between 22 numbers of intermediate nodes with WI-FI
connection.
The data pertaining to the lab records are, the underlying MAC protocol defined by IEEE 802.11g
with a channel data rate of 2.4 GHZ. The data packet size can vary up to 512-1024 bytes. The
wireless transmission range of each node is 100 meters. Traffic sources of constant bit rate
(CBR) based on TCP (Transmission Control Protocol) have been used.
The evaluation has been done for about 10 messages that are sent from the sender node. The
messages are tabulated as MSG1 to MSG10. Based on the values calculated and comparing
those with the limit values, the four attacks have been identified. Based on the ratio value and
attack identification, the link status is also explained. When a link misbehaves, any of the nodes
associated with the link may be misbehaving. In order to decide the behavior of a node and
prevent it, we may need to check the behavior of links around that node [23].Such a solution is
also provided by the proposed approach. All the transmissions will take place in few milliseconds,
without consuming much of the network bandwidth, battery power and memory. The algorithm
doesn’t require any special equipment to carry out the experiment. So only the approach is more
economic in nature and it can be considered as more robust in nature, since it is able to identify
and prevent four attacks parallelly in MANETS.
The same algorithm can be extended to few more network layer attacks identification and
prevention, which can be taken as the future enhancement. Further the network density can also
be increased and using the proposed approach it can be tested and analyzed. Simulation can
also be taken as another enhancement for the approach to consider more number of nodes and
graphical analysis.
The following Table 1 shows the results for the experiment conducted:
(cmiss/
RTT Node
Data Sent cpkt) Link Status Attack Identified
(ms) Status
ratio
MSG1 16 0.0 Working properly Genuine nil
MSG2 10 0.014 Working properly Genuine nil
MSG3 10 0.014 Working properly Genuine nil
Working Properly
MSG4 16 0.0 but CONFIDENTI- Malicious Message tampering
ALITY LOST
MSG5 10.47 1.0 Misbehaving Malicious Packet dropping
Packet dropping and
MSG6 10.68 1.0 Misbehaving Malicious
black hole attack
Misbehaving and Packet dropping ,
MSG7 23 1.0 CONFIDENTI- Malicious black hole attack and
ALITY LOST message tampering
International Journal of Computer Science and Security, Volume (4): Issue (3) 280](https://image.slidesharecdn.com/ijcssv4i3-110103003116-phpapp02/85/International-Journal-of-Computer-Science-and-Security-IJCSS-Volume-4-Issue-3-24-320.jpg)
![G.S. Mamatha & S.C. Sharma
Misbehaving and Packet dropping ,
MSG8 20 0.5 CONFIDENTI- Malicious Gray hole attack and
ALITY LOST message tampering
Packet dropping and
MSG9 17 0.5 Misbehaving Malicious
Gray hole attack
Misbehaving and
Packet dropping,
MSG10 31 1.0 CONFIDENTI- Malicious
message tampering
ALITY LOST
TABLE 1: Summary of Results.
4.1. Performance Analysis
We have considered four of the network parameters for evaluating the performance with the
proposed approach. Further it can be extended to a few more parameters based upon the
network density. The algorithm can also be extended to identify and prevent few more network
layer attacks.
Packet delivery ratio (PDR) – the ratio of the number of packets received at the
destination and the number of packets sent by the source.
The PDR of the flow at any given time is calculated as,
PDR = (packets received/packets sent)
Routing overhead – The number of routing packets transmitted per data packet delivered
at the destination.
Power consumption- the power is calculated in terms of total time taken for transmission
of a message from sender to receiver. Since this time elapses in milliseconds, the power
consumed by anode will be considered as less.
Throughput- It is sum of sizes (bits) or number (packets) of
generated/sent/forwarded/received packets, calculated at every time interval and divided
by its length. Throughput (bits) is shown in bits. Throughput (packets) shows numbers of
packets in every time interval. Time interval length is equal to one second by default [6].
Another important fact can be considered with respect to the approach is the power consumption
of the nodes in the network. When compared to other approaches, the proposed scheme
presents a simple one-hop acknowledgement and one way hash chain, termed as semantic
security mechanism, greatly reduces overhead in the traffic and the transmission time. The
overall transmission for sending and receiving data happens in just few milliseconds, overcoming
the time constraint thereby reducing power consumption.
As a part of the analysis, the proposed approach which is a protocol less implementation is
compared with the protocol performances like AODV and DSR. Only one network parameter I.e.
throughput has been taken for comparison with increasing the number of nodes up to 24. The
following Table 2 shows the three comparison values for throughput in bps and Figure 1 shows
the graph of comparison results.
Throughput (in bps)
Number of Nodes Proposed approach AODV DSR
4 500 500 500
8 1000 750 700
12 2000 1000 1200
16 3000 2000 1900
20 4000 3000 2500
24 5000 4500 3700
TABLE 2: Throughput values for Proposed approach, AODV and DSR.
International Journal of Computer Science and Security, Volume (4): Issue (3) 281](https://image.slidesharecdn.com/ijcssv4i3-110103003116-phpapp02/85/International-Journal-of-Computer-Science-and-Security-IJCSS-Volume-4-Issue-3-25-320.jpg)
![G.S. Mamatha & S.C. Sharma
FIGURE 1: Graph of Comparison Results for Throughput.
The graph in figure 1 clearly shows the performance of one of the network parameter, throughput
for the proposed approach. As the graph indicates the throughput for both AODV and DSR
protocols are calculated and tested. When compared to the proposed approach, which uses a
protocol less simple acknowledgement method and one way hash chain, the protocols
performance results in lesser throughput.
5. CONCLUSION AND FUTURE WORK
In mobile ad hoc networks, protecting the network layer from attacks is an important research
topic in wireless security. This paper describes a robust scheme for network-layer security
solution in ad hoc networks, which protects both, routing and packet forwarding functionalities
without the context of any data forwarding protocol. This approach tackles the issue in an efficient
manner since four attacks have been identified parallelly. The overall idea of this algorithm is to
detect malicious nodes launching attacks and misbehaving links to prevent them from
communication network. This work explores a robust and a very simple idea, which can be
implemented and tested in future for more number of attacks, by increasing the number of nodes
in the network. To this end, we have presented an approach, a network-layer security solution
against attacks that protects routing and forwarding operations in the network. As a potential
direction for future work, we are considering measurement of more number of network
parameters, to analyze the performance of such a network using the proposed approach.
6. REFERENCES
[1] Rashid Hafeez Khokhar, Md Asri Ngadi and Satria Mandala. “A Review of Current Routing
Attacks in Mobile Ad hoc Networks”. International Journal of Computer Science and Security,
2(3):18-29, 2008
[2] Bingwen He, Joakim Hägglund and Qing Gu. “Security in Adhoc Networks”, An essay
produced for the course Secure Computer Systems HT2005 (1DT658), 2005
[3] IEEE Std. 802.11. “Wireless LAN Medium Access Control (MAC) and Physical Layer (PHY)
Specifications”, 1997
International Journal of Computer Science and Security, Volume (4): Issue (3) 282](https://image.slidesharecdn.com/ijcssv4i3-110103003116-phpapp02/85/International-Journal-of-Computer-Science-and-Security-IJCSS-Volume-4-Issue-3-26-320.jpg)
![G.S. Mamatha & S.C. Sharma
[4] Sun Choi, Doo-young Kim, Do-hyeon Lee and Jae-il Jung. “WAP: Wormhole Attack
Prevention Algorithm In Mobile Ad Hoc Networks”, In Proceedings of International Conference on
Sensor Networks, Ubiquitous, and Trustworthy Computing, Vol. 0, ISBN = 978-0-7695-3158-8,
pp. 343-348, 2008
[5] Moumita Deb, “A Cooperative Black hole Node Detection Mechanism for ADHOC Networks”,
Proceedings of the World Congress on Engineering and Computer Science, 2008
[6] Dhaval Gada, Rajat Gogri, Punit Rathod, Zalak Dedhia, Nirali Mody, Sugata Sanyal and Ajith
Abraham. “A Distributed Security Scheme for Ad Hoc Networks”, ACM Publications, Vol-11, Issue
1, pp.5–5, 2004
[7] Oscar F. Gonzalez, God win Ansa, Michael Howarth and George Pavlou. “Detection and
Accusation of Packet Forwarding Misbehavior in Mobile Ad-Hoc networks”. Journal of Internet
Engineering, 2:1, 2008
[8] Satria Mandala, Md. Asri Ngadi, A.Hanan Abdullah. “A Survey on MANET Intrusion Detection”.
International Journal of Computer Science and Security, 2(1):1-11, 1999
[9] Frank Kargl, Andreas Klenk, Stefan Schlott and Michael Weber. “Advanced Detection of
Selfish or Malicious Nodes in Ad hoc Networks”, In Proceedings of IEEE/ACM Workshop on
Mobile Ad Hoc Networking and Computing, 2002
[10] Murali Kodialam, T. V. Lakshman. “Detecting Network Intrusions via Sampling: A Game
Theoretic Approach”, In Proceedings of IEEE INFOCOM, 2003
[11] Patcha, A; Mishra, A. “Collaborative security architecture for black hole attack prevention in
mobile ad hoc networks”, In Proceedings of Radio and Wireless conference, RAWCON apos; 03,
Vol. 10, Issue 13, pp. 75–78, Aug 2003
[12] N. Song, L. Qian and X. Li. “Wormhole attacks detection in wireless ad hoc networks: A
statistical analysis approach”, In proceedings of 19th IEEE International Parallel and Distributed
Processing Symposium, 2005
[13] Nasser, N, Yunfeng Chen. “Enhanced Intrusion Detection System for Discovering Malicious
Nodes in Mobile Ad Hoc Networks”, In proceedings of IEEE International Conference on
Communications, ICC apos; Vol-07 , Issue 24-28, pp.1154 – 1159, June 2007
[14] S.Dhanalakshmi, Dr.M.Rajaram. “A Reliable and Secure Framework for Detection and
Isolation of Malicious Nodes in MANET”, IJCSNS International Journal of Computer Science and
Network Security, 8(10), October 2008
[15] Chu-Hsing Lin, Wei-Shen Lai, Yen-Lin Huang and Mei-Chun Chou. “Secure Routing Protocol
with Malicious Nodes Detection for Ad Hoc Networks”, In Proceedings of 22nd International
Conference on Advanced Information Networking and Applications - Workshops, 2008, AINAW
March 2008
[16] Yi, Ping Wu, Yue Li and Jianhua. “Malicious node detection in Ad Hoc networks using timed
automata”, In Proceedings of IET Conference on Wireless, Mobile and Sensor Networks
(CCWMSN07), Shangai, China, 2007
[17] Bharat Bhargava, Ruy de Oliveira, Yu Zhang and Nwokedi C. Idika. "Addressing
Collaborative Attacks and Defense in Ad Hoc Wireless Networks", In Proceedings of 29th IEEE
International Conference on Distributed Computing Systems Workshops, pp. 447-450, 2009
International Journal of Computer Science and Security, Volume (4): Issue (3) 283](https://image.slidesharecdn.com/ijcssv4i3-110103003116-phpapp02/85/International-Journal-of-Computer-Science-and-Security-IJCSS-Volume-4-Issue-3-27-320.jpg)
![G.S. Mamatha & S.C. Sharma
[18] Payal N. Raj, Prashant B. Swadas. “DPRAODV: A Dynamic Learning System Against
Blackhole Attack in AODV Based MANET”, IJCSI International Journal of Computer Science
Issues, 2:54-59, 2009
[19] Malcolm Parsons, Peter Ebinger. “Performance Evaluation of the Impact of AttacksOn Mobile
Ad hoc Networks”, In Proceedings of Field Failure Data Analysis Workshop
September 27-30, Niagara Falls, New York, U.S.A, 2009
[20] IEEE Std. 802.11i/D30. “Wireless Medium Access Control (MAC) and Physical Layer (PHY)
Specifications: Specification for Enhanced Security”, 2002
[21] S. Yi, P. Naldurg and R. Kravets. “Security-Aware Ad Hoc Routing for Wireless Networks”, In
Proceedings of ACM MOBIHOC 2001, pp.299-302, October 2001
[22] H. Deng, W. Li and D. P. Agrawal. “Routing Security in Wireless Ad Hoc Networks”, IEEE
Communications Magazine, 40(10):70-75, October 2002
[23] T.V.P.Sundararajan, Dr.A.Shanmugam. “Behavior Based Anomaly Detection Technique to
Mitigate the Routing Misbehavior in MANET”, International Journal of Computer Science and
Security, 3(2):62-75, April 2009
International Journal of Computer Science and Security, Volume (4): Issue (3) 284](https://image.slidesharecdn.com/ijcssv4i3-110103003116-phpapp02/85/International-Journal-of-Computer-Science-and-Security-IJCSS-Volume-4-Issue-3-28-320.jpg)
![Muna Mhammad T. Jawhar & Monica Mehrotra
Design Network Intrusion Detection System using hybrid
Fuzzy-Neural Network
Muna Mhammad T. Jawhar muna.taher@gmail.com
Faculty of Natural Science
Department of computer science
Jamia Millia Islamia
New Delhi, 110025, India
Monica Mehrotra drmehrotra2000@gmail.com
Faculty of Natural Science
Department of computer science
Jamia Millia Islamia
New Delhi, 110025, India
Abstract
As networks grow both in importance and size, there is an increasing need for
effective security monitors such as Network Intrusion Detection System to
prevent such illicit accesses. Intrusion Detection Systems technology is an
effective approach in dealing with the problems of network security. In this paper,
we present an intrusion detection model based on hybrid fuzzy logic and neural
network. The key idea is to take advantage of different classification abilities of
fuzzy logic and neural network for intrusion detection system. The new model
has ability to recognize an attack, to differentiate one attack from another i.e.
classifying attack, and the most important, to detect new attacks with high
detection rate and low false negative. Training and testing data were obtained
from the Defense Advanced Research Projects Agency (DARPA) intrusion
detection evaluation data set.
Keywords: FCM clustering, Neural Network, Intrusion Detection.
1. INTRODUCTION
With the rapid growth of the internet, computer attacks are increasing at a fast pace and can
easily cause millions of dollar in damage to an organization. Detection of these attacks is an
important issue of computer security. Intrusion Detection Systems (IDS) technology is an effective
approach in dealing with the problems of network security.
In general, the techniques for Intrusion Detection (ID) fall into two major categories depending on
the modeling methods used: misuse detection and anomaly detection. Misuse detection
compares the usage patterns for knowing the techniques of compromising computer security.
Although misuse detection is effective against known intrusion types; it cannot detect new attacks
that were not predefined. Anomaly detection, on the other hand, approaches the problem by
attempting to find deviations from the established patterns of usage. Anomaly detection may be
able to detect new attacks. However, it may also cause a significant number of false alarms
because the normal behavior varies widely and obtaining complete description of normal behavior
is often difficult. Architecturally, an intrusion detection system can be categorized into three types
host based IDS, network based IDS and hybrid IDS [1][2]. A host based intrusion detection
International Journal of Computer Science and Security, Volume (4): Issue (3) 285](https://image.slidesharecdn.com/ijcssv4i3-110103003116-phpapp02/85/International-Journal-of-Computer-Science-and-Security-IJCSS-Volume-4-Issue-3-29-320.jpg)
![Muna Mhammad T. Jawhar & Monica Mehrotra
system uses the audit trails of the operation system as a primary data source. A network based
intrusion detection system, on the other hand, uses network traffic information as its main data
source. Hybrid intrusion detection system uses both methods [3].
However, most available commercial IDS's use only misuse detection because most developed
anomaly detector still cannot overcome the limitations (high false positive detection errors, the
difficulty of handling gradual misbehavior and expensive computation[4]). This trend motivates
many research efforts to build anomaly detectors for the purpose of ID [5].
The main problem is the difficulty of distinguishing between natural behavior and abnormal
behavior in computer networks due to the significant overlap in monitoring data. This detection
process generates false alarms resulting from the Intrusion Detection based on the anomaly
Intrusion Detection System. The use of fuzzy clustering might reduce the amount of false alarm,
where fuzzy clustering is usesd to separate this overlap between normal and abnormal behavior
in computer networks.
This paper addresses the problem of generating application clusters from the KDD cup 1999
network intrusion detection dataset. The Neural Network and Fuzzy C-Mean (FCM) clustering
algorithms were chosen to be used in building an efficient network intrusion detection model. We
organize this paper as follows, section 2 review previous works, section 3 provides brief
introduction about Neural Network, section 4 present fuzzy C-means clustering algorithm, section
5 explain the model designer and training Neural Network, section 6 discusses the experiments
results followed by conclusion.
2. PREVIOUS WORK
In particular several Neural Networks based approaches were employed for Intrusion Detection.
Tie and Li [6] used the BP network with GAs for enhance of BP, they used some types of attack
with some features of KDD data. The detection rate for Satan, Guess-password, and Peral was
90.97, 85.60 and 90.79 consequently. The overall accuracy of detection rate is 91.61 with false
alarm rate of 7.35. Jimmy and Heidar [7] used feed-forward Neural Networks with Back
Propagation training algorithm, they used some feature from TCP Dump and the classification
result is 25/25. Dima, Roman and Leon[8] used MLP and Radial Based Function (RBF) Neural
Network for classification of 5 types of attacks, the accuracy rate of classifying attacks is 93.2
using RBF and 92.2 using MLP Neural Network, and the false alarm is 0.8%. Iftikhar, Sami and
Sajjad [9] used Resilient Back propagation for detecting each type of attack along, the accurse
detection rate was 95.93. Mukkamala, Andrew, and Ajith [10] used Back Propagation Neural
Network with many types of learning algorithm. The performance of the network is 95.0. The
overall accuracy of classification for RPBRO is 97.04 with false positive rate of 2.76% and false
negative rate of 0.20. Jimmy and Heidar[11] used Neural Network for classification of the
unknown attack and the result is 76% correct classification. Vallipuram and Robert [12] used
back-propagation Neural Network, they used all features of KDD data, the classification rate for
experiment result for normal traffic was 100%, known attacks were 80%, and for unknown attacks
were 60%. Dima, Roman, and Leon used RBF and MLP Neural Network and KDD dataset for
attacks classification and the result of accuracy of classification was 93.2% using RBF Neural
Network and 92.2% using MLP Neural Network.
3. NEURAL NETWORK
Neural Networks (NNs) have attracted more attention compared to other techniques. That is
mainly due to the strong discrimination and generalization abilities of Neural Networks that
utilized for classification purposes [13]. Artificial Neural Network is a system simulation of the
neurons in the human brain [14]. It is composed of a large number of highly interconnected
processing elements (neurons) working with each other to solve specific problems. Each
processing element is basically a summing element followed by an active function. The output of
International Journal of Computer Science and Security, Volume (4): Issue (3) 286](https://image.slidesharecdn.com/ijcssv4i3-110103003116-phpapp02/85/International-Journal-of-Computer-Science-and-Security-IJCSS-Volume-4-Issue-3-30-320.jpg)
![Muna Mhammad T. Jawhar & Monica Mehrotra
each neuron (after applying the weight parameter associated with the connection) is fed as the
input to all of the neurons in the next layer. The learning process is essentially an optimization
process in which the parameters of the best set of connection coefficients (weights) for solving a
problem are found [15].
An increasing amount of research in the last few years has investigated the application of Neural
Networks to intrusion detection. If properly designed and implemented, Neural Networks have the
potential to address many of the problems encountered by rule-based approaches. Neural
Networks were specifically proposed to learn the typical characteristics of system’s users and
identify statistically significant variations from their established behavior. In order to apply this
approach to Intrusion Detection, we would have to introduce data representing attacks and non-
attacks to the Neural Network to adjust automatically coefficients of this Network during the
training phase. In other words, it will be necessary to collect data representing normal and
abnormal behavior and train the Neural Network on those data. After training is accomplished, a
certain number of performance tests with real network traffic and attacks should be conducted
[16]. Instead of processing program instruction sequentially, Neural Network based models on
simultaneously explorer several hypotheses make the use of several computational
interconnected elements (neurons); this parallel processing may imply time savings in malicious
traffic analysis [17].
4. FUZZY C-MEANS CLUSTERING
The FCM based algorithms are the most widely used fuzzy clustering algorithms in practice. It is
based on minimization of the following objective function [18], with respect to U, a fuzzy c-
partition of the data set, and to V, a set of K prototypes:
2 , 1<m<∞ …… (1)
Where m is any real number greater than 1, Uij is is the degree of membership of Xj in the cluster
I, Xj is jth of d-dimensional measured input data, Vi is the d-dimension center of the cluster, and
║*║is any norm expressed the similarity between any measured data and the center. Fuzzy
partition is carried out through an iterative optimization of (1) with the update of membership Uij
and the cluster centers Vi by:
…. (2)
…. (3)
The criteria in this iteration will stop when maxij │Uij-Ûij│< ε, where ε is a termination criterion
between 0 and 1, also the maximum number of iteration cycles can be used as a termination
criterion [19].
5. EXPERIMENT DESIGN
The block diagram of the hybrid model is showed in the following figure (1)
International Journal of Computer Science and Security, Volume (4): Issue (3) 287](https://image.slidesharecdn.com/ijcssv4i3-110103003116-phpapp02/85/International-Journal-of-Computer-Science-and-Security-IJCSS-Volume-4-Issue-3-31-320.jpg)
![Muna Mhammad T. Jawhar & Monica Mehrotra
Dos
KDD FCM NN
U2R
data set clustering (MLP) U2l
prob
Normal
No action
FIGURE 1: the block diagram of the model
5.1 KDD Data Set
KDD 99 data set are used as the input vectors for training and validation of the tested neural
network. It was created based on the DARPA intrusion detection evaluation program. MIT Lincoln
Lab that participates in this program has set up simulation of typical LAN network in order to
acquire raw TCP dump data [20]. They simulated LAN operated as a normal environment, which
was infected by various types of attacks. The raw data set was processed into connection
records. For each connection, 41 various features were extracted. Each connection was labeled
as normal or under specific type of attack. There are 39 attacker types that could be classified
into four main categories of attacks:
DOS (Denial of Service): an attacker tries to prevent legitimate users from using a service
e.g. TCP SYN Flood, Smurf (229853 record).
Probe: an attacker tries to find information about the target host. For example: scanning
victims in order to get knowledge about available services, using Operating System (4166
record).
U2R (User to Root): an attacker has local account on victim’s host and tries to gain the
root privileges (230 records).
R2L (Remote to Local): an attacker does not have local account on the victim host and
try to obtain it (16187 records).
The suggested model was trained with reduced feature set (35 out of 41 features as in
appendix A). We get 25000 training data patterns from 10 percent training set and test data
patterns from test set which has attack patterns that are not presented in the training data, we
divided test data pattern into two sets.
5.2 FCM Algorithm
The first stage of the FCM algorithm is to initialize the input variable, the input vector consists of
35 features as mentioned previously, the number of cluster is 2 (1=attack and 2=normal), and the
center of cluster is calculated by taking the means of all feature from random records in KDD
dataset, and the parameter of the object function (m) is 2. After apply the FCM to two different
datasets the result after iteration four is 99.99% classification of normal from attack records as
seen in the following tables.
Input data Iteration Iteration Iteration Iteration Iteration Iteration
No.1 No. 2 No. 3 No. 4 No. 5 No. 6
Normal 1725 1049 1003 1001 1001 1001
998
Attack 20408 21081 21130 21132 21132 21132
21135
TABLE (1): the result of the first experiment of using FCM clustering
International Journal of Computer Science and Security, Volume (4): Issue (3) 288](https://image.slidesharecdn.com/ijcssv4i3-110103003116-phpapp02/85/International-Journal-of-Computer-Science-and-Security-IJCSS-Volume-4-Issue-3-32-320.jpg)
![Muna Mhammad T. Jawhar & Monica Mehrotra
Iteration No. 1 2 3 4 5 6
Normal classification rate 57.80 95.10 99.59 99.98 99.98 99.98
(%)
Attack classification rate (%) 96.50 99.74 99.97 99.98 99.98 99.98
False positive (%) 0.728 0.0541 0.00501 0.0030 0.0030 0.0030
False negative (%) 0.421 0.048 0.0049 0.0029 0.0029 0.0029
TABLE (2): the classification rate of the first experiment
Input data Iteration Iteration Iteration Iteration Iteration Iteration
No.1 No. 2 No. 3 No. 4 No. 5 No. 6
Normal 1752 1062 1022 1019 1019 1019
1018
Attack 8277 8958 8998 9001 9001 9001
9002
TABLE (3): the result of the second experiment of using FCM clustering
Iteration No. 1 2 3 4 5 6
Normal classification rate 57.62 95.77 99.60 99.99 99.99 99.99
(%)
Attack classification rate (%) 91.90 99.57 99.95 99.99 99.99 99.99
False positive (%) 0.7121 0.0432 0.0039 0.0009 0.0009 0.0009
False negative (%) 0.418 0.0414 0.0039 0.0009 0.0009 0.0009
TABLE (4): the classification rate of the second experiment
As shown in table 1 the total input data is 22133 records, 998 records as normal and 21135
records as attacker. After applying FCM algorithm, the result after iteration one is 1725 record for
normal and 20408 records for attack. After second iteration of FCM algorithm the result is 1049
records for normal and 2108 records for attack, after iteration three the result is 1003 records for
normal and 21130 records for attack, the result after iteration four is 1001 records for normal and
21132 records for attack and the result after iteration five and six is the same and there is no
change, therefore FCM algorithm is stopped.
As seen the final result of the first experiment in table 1 is 1001 records are normal and 21132
records are attack, the original input data is 998 records as normal and 21135 records as attack.
Then we calculated the normal and attack classification rate by the following equation[3]:
Number of classified patterns
Classification rate= * 100
..…..(4)
Total number of patterns
False negative means if it is attack and detection system is normal, false positive means if it is
normal and detect system is attack. The false positive alarm rate calculated as the total number
of normal instances that were classified as intrusions divided by the total number of normal
instances and the false negative alarm rate calculated as the total number of attack instances that
were classified as normal divided by the total number of attack instances.
The same calculation is applied for the second experiment.
5.3 MLP Training Algorithm
The anomaly detection is to recognize different authorized system users and identify intruders
from that knowledge. Thus intruders can be recognized from the distortion of normal behavior.
Because the FCM clustering stages are classified normal from attack, the second stage of NN is
used for classification of attacks type. Multi-layer feed forward networks (MLP) is used in this
International Journal of Computer Science and Security, Volume (4): Issue (3) 289](https://image.slidesharecdn.com/ijcssv4i3-110103003116-phpapp02/85/International-Journal-of-Computer-Science-and-Security-IJCSS-Volume-4-Issue-3-33-320.jpg)


![Muna Mhammad T. Jawhar & Monica Mehrotra
17. S. Lília de Sá, C. Adriana Ferrari dos Santos, S. Demisio da Silva, and A. Montes, "A Neural
Network Application for Attack Detection in Computer Networks", Instituto Nacional de
Pesquisas Espaciais – INPE, BRAZIL.2004.
18. J. Bezdek, C., "pattern Recognition with Fuzzy Objective Function Algorithms". Plenum, New
York.1981.
19. Y. John and R. Langari, "Fuzzy Logic intelligence, control, and information", Publish by
Dorling Kindersley, India, pp.379-383.2006.
20. P. Kukiełka and Z. Kotulski, "Analysis of Different Architectures of Neural Networks for
Application in Intrusion Detection Systems", Proceedings of the International Multiconference
on Computer Science and Information Technology, IEEE, pp. 807– 811.2008.
21. KDD-cup dataset. http://kdd.ics.uci.edu/data base/ kddcupaa/kddcup.html
22. Loril D., "Applying Soft Computing Techniques to intrusion Detection", Ph.D thesis, Dep. Of
Computer Sce. University of Colorado at Colorado Spring, 2005.
APPENDIX -A-
The table (A1) describes the 41 features of each connection record in the DARPA KDD cup
1999[23]. The fields with blue color are features that have been considered in this research.
Table (A1): feature of KDD cup 1999 data
No. Feature name Description Type
1 Duration length (number of seconds) of the connection Continuous
2 Protocol-type type of the protocol, e.g. tcp, udp, etc. Discrete
3 Service network service on the destination, e.g., http, telnet, Discrete
etc.
4 Flag normal or error status of the connection discrete
5 Src-bytes number of data bytes from source to destination Continuous
6 Det-bytes number of data bytes from destination to source Continuous
7 Land 1 if connection is from/to the same host/port; 0 Discrete
otherwise
8 Wrong fragment number of ``wrong'' fragments Continuous
9 Urgent number of urgent packets Continuous
10 Hot number of ``hot'' indicators Continuous
11 Num-failed-logien number of failed login attempts Continuous
12 Logged-in 1 if successfully logged in; 0 otherwise Discrete
13 Num-compromised number of ``compromised'' conditions continuous
14 Root-shell 1 if root shell is obtained; 0 otherwise discrete
15 Su-attempted 1 if ``su root'' command attempted; 0 otherwise discrete
16 Num-root number of ``root'' accesses discrete
17 Num-file-creation number of file creation operations continuous
18 Num-shells number of shell prompts continuous
19 Num-access-file number of operations on access control files continuous
20 Num-outbound- number of outbound commands in an ftp session continuous
cmds
21 Is-hot-login 1 if the login belongs to the ``hot'' list; 0 otherwise discrete
22 Is-guest-login 1 if the login is a ``guest''login; 0 otherwise discrete
23 Count number of connections to the same host as the continuous
current connection in the past two seconds
24 Srv-count number of connections to the same service as the continuous
current connection in the past two seconds
25 Serror-rate % of connections that have ``SYN'' errors continuous
26 Srv-serror-rate % of connections that have ``SYN'' errors continuous
27 Rerror-rate % of connections that have ``REJ'' errors continuous
28 Srv-error-rate % of connections that have ``REJ'' errors continuous
29 Same-srv-rate % of connections to the same service Continuous
30 Diff-srv-rate % of connections to different services Continuous
31 Srv-diff-host-rate % of connections to different hosts Continuous
32 Det-host-count Number of connection to the same host Continuous
33 Dst-host-srv-co Number of connection to the same serves for the Continuous
host
International Journal of Computer Science and Security, Volume (4): Issue (3) 293](https://image.slidesharecdn.com/ijcssv4i3-110103003116-phpapp02/85/International-Journal-of-Computer-Science-and-Security-IJCSS-Volume-4-Issue-3-37-320.jpg)

![Mohammed Awad
Optimization RBFNNs Parameters Using Genetic Algorithms:
Applied on Function Approximation
Mohammed Awad m.awad@aauj.edu
Faculty Engineering and Information Technology /CIT Dept.
Arab American University
Jenin, 240, Palestine
Abstract
This paper deals with the problem of function approximation from a given set
of input/output (I/O) data. The problem consists of analyzing training
examples, so that we can predict the output of a model given new inputs. We
present a new approach for solving the problem of function approximation of
I/O data using Radial Basis Function Neural Networks (RBFNNs) and Genetic
Algorithms (GAs). This approach is based on a new efficient method of
optimizing RBFNNs parameters using GA, this approach uses GA to optimize
centres c and radii r of RBFNNs, such that each individual of the population
represents centres and radii of RBFNNs. Singular value decomposition (SVD)
is used to optimize weights w of RBFNNs. The GA initial population performed
by using Enhanced Clustering Algorithm for Function Approximation (ECFA)
to initialize the RBF centres c and k-nearest neighbor to initialize the radii r.
The performance of the proposed approach has been evaluated on cases of
one and two dimensions. The results show that the function approximation
using GA to optimize RBFNNs parameters can achieve better normalized-
root-mean square-error than those achieved by traditional algorithms.
Keywords: Radial Basis Function Neural Networks, Genetic Algorithms and Function Approximation.
1. INTRODUCTION
Function approximation is the name given to a computational task that is of interest to many
science and engineering communities [1]. Function Approximation consists of synthesizing a
complete model from samples of the function and its independent variables [2]. In supervised
learning, the task is to map from one vector space to another with the learning based on a set
of instances of such mappings. We assume that a function F does exist and we endeavor to
synthesize a computational model of that function. As a general mathematical problem,
function approximation has been studied for centuries. For example, in pattern recognition, a
function mapping is made whose objective is to assign each pattern in a feature space to a
specific label in a class space [3, 12].
The idea of combining genetic algorithms and neural networks occurred initially at the end of
the 1980s. The problem of neural networks is that the number of parameters has to be
determined before any training begins and there is no clear rule to optimize them, even
though these parameters determine the success of the training process [23]. Genetic
algorithms (GAs), on the other hand, are very robust and explore the search space more
uniformly, since every individual is evaluated independently, which makes GAs very suitable
to the optimization of Neural Networks [4]. However, the choice of the basic parameters
(network topology, initial weights) often determines the success of the training process. The
selection of these parameters is practically determined by accepted rules of thumb, but their
value is at most arguable. GAs are global search methods, that are based on the principles of
selection, crossover and mutation [23, 25]. GAs increasingly have been applied to the design
of neural networks in several ways, such as optimization of the topology of neural networks by
International Journal of Computer Science and Security (IJCSS), Volume (4): Issue (3) 295](https://image.slidesharecdn.com/ijcssv4i3-110103003116-phpapp02/85/International-Journal-of-Computer-Science-and-Security-IJCSS-Volume-4-Issue-3-39-320.jpg)
![Mohammed Awad
optimizing the number of hidden layers and the number of nodes in each hidden layer, and
the optimization of neural network parameters by optimizing the weights [5, 6].
One type of neural network, called Radial Basis Function Neural Networks (RBFNNs) [24],
has the property of universal approximation and has received some attention by other
researchers, but its parameters have, so far, been only partially optimized using GAs [1, 12].
RBFNNs are characterized by a transfer function in the hidden unit layer having radial
symmetry with respect to a centre [7]. The basic architecture of RBFNNs is a 3-layer network
as in Figure 1. The output of the RBFNNs is given by the following expression:
m
F (x, , w) i 1
i ( x ) wi (1)
Where {i : i 1,..., m} is the basis functions set, and wi is the associate weights for
every RBF. The basis function can be calculated as a Gaussian function using the
following expression:
x c
( x , c , r ) exp (2)
r
Where c is the central point of the function , r is its radius and x is the input vector.
1 w1
x1
2 F(X)
w2
….
…
xm
wm
m
Fig.1. Radial Basis Function Network
Topology optimization is a common learning method for RBFNNs, but a big challenge is
optimization that includes the full parameter sets of centres c, radii r and weights w along with
the number of neurons per hidden layer. There are several possibilities of using GAs to
configure RBFNNs. A straightforward approach is to fix a topology and use GA as an
optimization tool to compute all free-parameters [8]. In [9] the author fixed the number of
hidden neurons, and used GA to optimize only the location of the RBFNNs centres. The radii
and output weights were computed by the K-nearest neighbor KNN and the singular value
decomposition SVD, respectively. In [10] the author also fixed the number of centres, and
evolved their locations and radii, instead of encoding a network in each individual, the entire
set of chromosomes cooperates to constitute RBFNNs. Another idea is to hybridize the
configuration process, using GA as a support tool. Chen et. al. [13] presented a two-level
learning method for RBFNNs, where a regularized orthogonal least squares (ROLS) algorithm
was employed to construct the RBFNNs at the inner level, while the two main parameters of
this algorithm were optimized by a GA process at the outer level. In [14], GA was used to
optimize the number and initial positions of the centres using the k-means clustering
algorithm; the RBFNNs first training then proceeded as in [15].
In our approach we present a different way that depends on optimizing the topology of
RBFNNs and its parameters centres c, and radii r using GA. Weights w are calculated by
means of methods of resolution of linear equations. In this proposed approach we use the
singular values decomposition (SVD) to solve this system of linear equations and assign the
International Journal of Computer Science and Security (IJCSS), Volume (4): Issue (3) 296](https://image.slidesharecdn.com/ijcssv4i3-110103003116-phpapp02/85/International-Journal-of-Computer-Science-and-Security-IJCSS-Volume-4-Issue-3-40-320.jpg)
![Mohammed Awad
weights w for RBFNNs to calculate the output. Each individual is an entire set of
chromosomes cooperate to constitute a RBFNNs. In our proposed approach we use the
incremental method to determine the number of RBF (neurons) depending on the data-test-
error that the system produces which means, an increase in each iteration will be only one
RBF until there is no improvement in test error during several iterations.
The organization of the rest of this paper is as follow: Section 2 presents an overview of the
proposed approach. In Section 3, we present in detail the proposed approach for the
determination of the pseudo-optimal RBFNNs parameters. Then, in Section 4 we show some
results that confirm the performance of the proposed approach. Some final conclusions are
drawn in Section 5.
2. THE PROPOSED APPROACH
As mentioned before, the problem of function approximation consists of synthesizing a
complete model from samples of the function and it is independent variables. Consider a
function y F ( x ) where x is a vector (x 1,…,x p) in k-dimensional space from which a set of
input/output data pairs is available. The process of combining RBFNNs and GA is based on
the using of GA to optimize the RBFNNs parameters (centres c, and radii r) so that the
neuron is put in a suitable place in input data space [11]. The form of combining RBFNNs with
GAs appears in Figure 2.
Original
Problem
Input Data GAs/ RBFNN Output Approximation
Fig.2. Combining GA and RBFNN
The process begins with an initial population generated using three techniques for the
initialization of centres c, radii r, and weights w. The first technique is a clustering algorithm,
designed for function approximation (ECFA) [16], which is used for initializing the RBF centres
c. ECFA calculates the error committed in every cluster using the real output of the RBFNN,
which is trying to concentrate more in those input regions where the approximation error is
bigger, thus attempting to homogenize the contribution to the error of every cluster. Due to
this fact, the cluster locations are located in different places depending on the paradigm used
to model the internal relation in the I/O data [16]. The second technique is the k-nearest
neighbors technique (Knn), which is used for the initialization of the radii r of each RBF. The
Knn technique sets the radius of each RBF to a value equal to the mean of the Euclidean
distance between the centres of their nearest RBF [1, 20]. The last technique is singular value
decomposition (SVD), which is used to optimize directly the weights. The SVD technique is
used to solve the problem of RBF misplacement by using singular matrix activation. If two
functions are almost identical in the activation matrix, then two columns will be produced with
equal weight, whereas if a RBF is not activated for any point, zero columns in the matrix will
be produced [16, 20]. All these techniques are used once for the first configuration.
The fitness function (NRMSE) that is used to evaluate the population will establish the fitness
for every chromosome depending on its functions in the training set. The best population will
be selected for promotion to the next generation, where the genetic operators of crossover
and mutation produce a new population. The population leads the process of the selection to
the best value of the fitness (small error). Crossover and mutation lead to exploring the
unknown regions of the search space. Then, the population converges to the best parameters
of optimization of weights, centres and radii of RBFNNs. The process repeats until it finds the
best fitness or until the generation number reaches the maximum with the same genetic
operators in every generation.
International Journal of Computer Science and Security (IJCSS), Volume (4): Issue (3) 297](https://image.slidesharecdn.com/ijcssv4i3-110103003116-phpapp02/85/International-Journal-of-Computer-Science-and-Security-IJCSS-Volume-4-Issue-3-41-320.jpg)
![Mohammed Awad
3. PARAMETER OPTIMIZATION OF RBFNN USING GAs
A GA is a search or an optimization algorithm, which is invented based on genetics and
evolution. The initial population of individuals that have a digit string as the chromosome is
usually generated randomly. Each element of a chromosome is called a gene. The fitness,
which is a measure of improvement of approximation, is calculated for each individual. The
selection operations choose the best individuals for the next generation depending on the
fitness value. Then, crossover and mutation are performed on the selected individuals to
create a new individual that replaces the worst members of the population offspring. These
procedures are continued until the end-condition is satisfied. This algorithm confirms the
mechanism of evolution, in which the genetic information changes for every generation, and
the individuals that better adapt to their environment survives preferentially [17].
Our new proposed approach use GAs to construct optimal RBFNNs. The approach uses GAs
evolving to optimize the two RBFNNs parameters (centres c, and radii r) and uses singular
value decomposition (SVD) to optimize directly the weights w. The general process of our
proposed approach can be depicted in Figure 3, and the pseudo-code of this algorithm reads:
Begin
Initialize population P {c [by ECFA], r [by Knn]}; and w [by SVD].
Evaluate each individual on population P by fitness function F ( x, , w) ;
While not (stop criteria) ([threshold of NRMSE] || [number of Generation β]) do
Select individual’s i1 and i2;
ip+1 ← Crossover(i 1, i2);
Mutation (i p+1);
Evaluate (ip+1);
if matches threshold → stop
else insert(i p+1, Pnew);
End;
Start Number of RBF ≥ 1
Generate Initial Population P with Each
Individual S represent the number of RBF
using ECFA to initialize the centers, KNN
for radii and SVD for Weights
Insert the two Individuals in the Evaluate the Fitness Function
New Generated Population. for each Individual. (NRMSE)
Increased Number RBF by One
Apply Mutation with Probability
Pc to create two Offspring.
Apply Crossover on the two
selected individuals
NO
NRMSE ≤ α
Select the Best two Individuals ||
G#≤β
YES
Stop
Fig. 3. General description of the proposed algorithm
International Journal of Computer Science and Security (IJCSS), Volume (4): Issue (3) 298](https://image.slidesharecdn.com/ijcssv4i3-110103003116-phpapp02/85/International-Journal-of-Computer-Science-and-Security-IJCSS-Volume-4-Issue-3-42-320.jpg)
![Mohammed Awad
3.1 Initialization
Each gene is constituted by a real vector representing centres, and a real value representing
radii of RBFs m. Chromosomes have a variable length which defined as follow:
c h r o m c 1 m , r1 m , c
2m , r2 m . ... c im , ri m
(3)
In our approach the chromosome that consists of (centres c, radii r) is generated initially
depending on classical algorithms so that initial centres will be generated once in the first
configuration by an efficient method of clustering of the centres c of the RBF Network (ECFA)
[16]. The K-nearest neighbors technique (Knn) used once in the first configuration for the
initialization of the radii r of each RBF. The number of parameters in each chromosome
calculated by [(# of RBF centres × # of dimensions) + # of RBF radii]. Singular value
decomposition (SVD) is used directly to optimize the weights w.
3.2 The Evaluation Function
The evaluation function is the function that calculates the value of the fitness in each
chromosome, in our case, the fitness function is the error between the target output and the
current output, (Fitness = error). In this paper, the fitness function we are going to use is the
so-called Normalized-Root-Mean-Squared-Error (NRMSE). This performance-index is defined
as:
P
2
P
2
NRMSE ( y F(x,, w)) / (y y)
i1
i
i1
i (4)
Where y is the mean of the target output, and p is the input data number.
3.3 Stop Process
A GA evolves from generation to generation selecting and reproducing parents until reaching
the end criterion. The criterion that is most used to stop the algorithm is a stated maximum
number of generations. With this work we use the maximum number of generation β or the
value of the fitness (NRMSE) threshold α as the criterion of End. This finishes the process
when the fitness (NRMSE) value reaches the determined threshold value α or when the
maximum number of performed generations exceeds the determined number of generations.
In practice, however, the process of optimization can finish before approaching the
termination conditions, which can happen when a GA moves from generation to generation
without resulting in any improvement in the value of the fitness.
If Current Generation ≥ Maximum Generation β || Fitness (NRMSE) ≤
Threshold value α → End the optimization
3.4 Selection
The selection of the individuals to produce the consecutive generation is an important role in
genetic algorithms. The probable selection arises the fitness of each individual. This fitness
presents the error between the objective output and actual output of RBFNN, such that the
individual that produces the smallest error has higher possibility to be selected. An individual
in the population can be selected once in conjunction with all the individuals in the population
who has a possibility of being selected to produce the next generation. There are many
methods that are used for the process of the selection as: roulette wheel selection, geometric
ranking method, and rank selection… etc [18, 19]. The most common selection method
depends on assignment of a probability pj to every individual j based on its value of fitness. A
series of numbers N is generated and compared against the accumulative
i
probability C i Pj , of the population. The appropriate individual j, is selected and copied in
j 1
the new population if Ci 1 U (0,1) Ci . In our work we use a Geometric Ranking method; in
this method the function of the evaluation determines the solution with a partially ordered set.
By this we guarantee the minimization and the negative reaction of the geometric method of
International Journal of Computer Science and Security (IJCSS), Volume (4): Issue (3) 299](https://image.slidesharecdn.com/ijcssv4i3-110103003116-phpapp02/85/International-Journal-of-Computer-Science-and-Security-IJCSS-Volume-4-Issue-3-43-320.jpg)
![Mohammed Awad
classification. It works by assigning Pi based on the line of the solution i when all solutions are
classified. In this method the probability Pi of the definite classification is calculated as in the
following expressions [18, 19]:
P individual selection-i q (1 q ) s1 (5)
Where q is the probability of selecting the best individual, s is the line of the individual, where
one is the best.
q
q (6)
1 (1 q ) P
Where P is the population size.
3.5 Crossover and Mutation
Crossover and mutation provide the basic search mechanism of a GA. The operators create
new solutions based on the previous solutions created in the population. Crossover takes two
individuals and produces two new recombinant individuals, whereas the mutation changes the
individual by random alteration in a gene to produce a new solution. The use of these two
basic types of genetic operators and their derivatives depends on the representation of the
chromosome. For the real values that we use in our work, we use the arithmetical crossover,
which produces two linear combinations of the parents (two new individuals) as in the
following equations:
!
X r X (1 r ) Y (7)
!
Y (1 r ) X rY (8)
Where X and Y are two vectors of k-dimensional that denote to individuals (parents) of the
population and r is the probability of crossover between (0, 1) in this work probability of
crossover r = 0. 5. From these equations we can present the process of the arithmetic
crossover as shown in Figure 4.
X c1X r1X w1X c2 X r2 X w2 X !
X c1Y r1Y w1Y c2 X r2 X w2 X
!
Y c1Y r1X w1Y c2Y r2Y w2Y Y c1X r1X w1X c2Y r2Y w2Y
Fig.4. The process of the arithmetic crossover of three points in two neurons RBF
We can find many methods of mutation in [19], such as uniform mutation, non-uniform
mutation (odd number - uniform mutation), and multi-non-uniform mutation. In our work we
use the process of uniform mutation that changes one of the parameters of the parent. The
uniform mutation selects one j element randomly and makes it equal to a uniform selected
number inside the interval. The equation that presents the uniform mutation is shown in
equation (Eq. 9):
U ( a i , bi ) if i j
x i' (9)
xi o th e rw is e
International Journal of Computer Science and Security (IJCSS), Volume (4): Issue (3) 300](https://image.slidesharecdn.com/ijcssv4i3-110103003116-phpapp02/85/International-Journal-of-Computer-Science-and-Security-IJCSS-Volume-4-Issue-3-44-320.jpg)
![Mohammed Awad
Where ai and bi are down and top level, for every variable i. Figure 5 present the process of
mutation that appears among the parameters of the RBFNNs.
!
X c1X r1X w1X c2 X r2 X w2 X X c1Y r1Y w1Y c2 X r2 X w2 X
* * * *
Fig.5. The uniform mutation of two points in two neurons RBF
4. SIMULATION EXAMPLES
The objective of this study is to develop and test an efficient approach that use to solve the
problem of function approximation. Therefore, we assume different polynomial function to
test the improvement of the approximation process depending on this approach. We have
investigated three polynomial function problems, one function in one dimension and other two
in two dimensions. The first function in figure 6 tests a case where there are many curves in
the function structure. The numerical values in the function are created to proof that the
proposed approach converges and dose not stuck in local minimums. Experiments have
been performed to test the proposed approach. The system is simulated in MATLAB 7.0
under Windows XP with a Pentium IV processor running at 2.4 GHz. In this section we will
compare the result of our approach with the results of other algorithms that approximate
functions using GAs to optimize RBFNNs parameters. Two types of results are presented:
The results of the validity of the algorithm in approximate functions from samples of I/O data
of one dimension compared with other algorithms as [21, 22], and the approximation of
function in two dimensions with the NRMSE and execution time. The results are obtained in
five executions. NRMSETest is the mean of normalized mean squared error of the test index
(for 1000 test data). The GA parameters that used are; the population-size = 100, crossover
rate = 0.5 and mutation rate = 0.05.
4.1 One Dimension Examples F1(x)
To test the effects caused by the proposed approach on initialization and avoiding local
minimum of RBFs placement, Training set of 2000 samples of the function was generated by
evaluating inputs taken uniformly from the interval [0, 1], from which we have removed 1000
points for test. This function is defined by the following expression:
F1 ( x) e 3 x sin (10 x), x 0,1 (10)
We can note from figure 6 (a) that the error produces before the training process distributed in
unhomogenized form along with the input data space. In figure 6 (b) the training process that
depends on optimizing RBFNN parameters (centres and radii) by GA produce error
distribution is homogenized form for each RBF along with the input data space
Fig. 6. (a) Error of each RBF in the input (b) Error of each RBF in the input space
space Before the Training. After the Training.
In Table 1, it can be seen that the proposed approach converge. This implies that RBFNN
optimize not fall into local optimum solution. The NRMSETest predicted by the proposed
International Journal of Computer Science and Security (IJCSS), Volume (4): Issue (3) 301](https://image.slidesharecdn.com/ijcssv4i3-110103003116-phpapp02/85/International-Journal-of-Computer-Science-and-Security-IJCSS-Volume-4-Issue-3-45-320.jpg)
![Mohammed Awad
approach shown that the proposed approach minimizes the approximation error with much
accuracy than other algorithms.
Method # RBF NRMSE Test
5 0.1771
González [22] 6 0.1516
8 0.0674
10 0.0882
4±7 0.7 ± 0.2 Generation = 10
5±6 0.7 ± 0.2 Generation = 25
Rivas [21] 8±9 0.6 ± 0.3 Generation = 50
23 ± 7 0.2 ± 0.3 Generation = 75
22 ± 11 0.4 ± 0.3 Generation = 100
2 0.059 Generation = 50
4 0.0485 Generation = 50
Our Approach 6 0.0274 Generation = 50
8 0.0205 Generation = 50
10 0.0223 Generation = 50
TABLE1: Comparison Result of NRMSETest Error of different approach
It’s clear in figure 7 that the distribution of RBFs in the case of approximation with 8 RBF is
not affected in the right part of the function, but when we increased the number of RBF as in
approximation with 10 RBF, the approximation process is efficient, which is clear in the
improvement of the fitness value with the increased number of generations. These results
indicate that using GA to optimize RBFNN centres and radii give optimal performance.
Optimization with 8 RBF Fitness Improvement with Generations
Optimization with 10 RBF Fitness Improvement with Generations
Fig. 7. Approximation of the function and Improvement of fitness with Generations
A comparison between three approaches applied is shown in figure 8. We can see that the
training precision of the algorithm presented in this paper is higher than other algorithms. The
International Journal of Computer Science and Security (IJCSS), Volume (4): Issue (3) 302](https://image.slidesharecdn.com/ijcssv4i3-110103003116-phpapp02/85/International-Journal-of-Computer-Science-and-Security-IJCSS-Volume-4-Issue-3-46-320.jpg)
![Mohammed Awad
NRMSETest becomes smaller and the fitness becomes larger accompanying the increase of
the generation; the fitness changes slowly when the generation number is between 20 and
50; we can judge that the convergence condition is satisfied when the generation number
reaches 20, because the fitness does not increase any more.
1
González[22]
0.9 Rivas [21]
Our Approach
0.8
0.7
0.6
N SE
RM
0.5
0.4
0.3
0.2
0.1
0
5 6 7 8 9 10
Fig. 8. Comparison the NRMSETest with the increase of
RBF numbers between different approaches.
4.2 Two Dimension Examples F1(x1,x2)
In this part we used functions of two-dimensions (see Figure 9, Figure 11). These functions of
two-dimension use a set of training data formed by 441 points distributed as 21 x 21 cells in
the input space. These examples of two dimensions are used to demonstrate the ability of
the proposed approach in approximating two dimension examples. In this example we use
number of Generations =250.
Fig. 9. Objective function F1(x1,x2)
Figure 10 presents different result of approximation of the function F1 ( x1 , x2 ) , and the
improvement of fitness function (NRMSETest) with the increased generation numbers.
NRMSE Execution Time (sec)
Nº RBF
Mean Max Min Mean
2 0.224 130 122 127
4 0.176 164 144 156
6 0.124 169 147 157
8 0.115 192 181 186
10 0.27 203 184 192
TABLE3. Result of NRMSETest and Execution Time of
the proposed approach applied on 2D Function F1(x1,x2)
International Journal of Computer Science and Security (IJCSS), Volume (4): Issue (3) 303](https://image.slidesharecdn.com/ijcssv4i3-110103003116-phpapp02/85/International-Journal-of-Computer-Science-and-Security-IJCSS-Volume-4-Issue-3-47-320.jpg)

![Mohammed Awad
Figure 12 presents different result of approximation of the function F2 ( x1 , x2 ) and the
improvement of Fitness function (NRMSETest) with the increased generation numbers.
NRMSE Execution Time (sec)
Nº RBF
Mean Max Min Mean
2 0.53 122 112 117
4 0.37 132 121 127
6 0.28 169 147 158
8 0.22 188 175 178
TABLE4. Result of NRMSETest and Execution Time of
the proposed approach applied on 2D Function F2(x1,x2)
Optimization with 6 RBF Fitness Improvement with Generations
Optimization with 8 RBF Fitness Improvement with Generations
Fig. 12. Approximation of the function F2(x1,x2) and Improvement of fitness with Generations
5. CONCLUSION
In our paper an efficient way of applying GA to RBFNNs configuration has been presented.
The approach optimizes centres c and Radii r parameters of RBFNN using GAs. The weights
w are optimized by using singular value decomposition SVD. The initialization of the centres
depends on an efficient algorithm of clustering (ECFA) [16] which means less complexity of
calculation to optimize each parameter alone. This approach was compared to two
approaches to optimize RBFNNs. The proposed approach is accurate as the best of the
others approaches and with significantly less number of RBFs in all experiments.
Simulations have demonstrated that the approach can produce more accurate prediction.
This approach is easy to implement and is superior in both performance and computation
time compared to other algorithms. Normally, GAs took a long training time to achieve results,
International Journal of Computer Science and Security (IJCSS), Volume (4): Issue (3) 305](https://image.slidesharecdn.com/ijcssv4i3-110103003116-phpapp02/85/International-Journal-of-Computer-Science-and-Security-IJCSS-Volume-4-Issue-3-49-320.jpg)
![Mohammed Awad
but in the proposed approach the time taken is suitable and that because of using algorithms
for the initialization of the RBFNN parameters. We have also shown that it is possible to use
this approach to find the minimal number of RBF (Neurones) that satisfy a certain error target
for a given function approximation problem.
6. REFERENCES
[1] M. J. D. Powell. “The Theory of Radial Basis Functions Approximation, in Advances of
Numerical Analysis”. pp. 105–210, Oxford: Clarendon Press, 1992.
[2] Z. Zainuddin O. Pauline. “Function approximation using artificial neural networks”. 12th
WSEAS International Conference on Applied Mathematics, 2007 Cairo, Egypt pp: 140-
145.
[3] Gen .M, Cheng .R. “Genetic algorithms and Engineering Optimization”. A Wiley-
Interscience Publication, Johan Wiley and Sons, Inc. 2000.
[4] B. Carse, A.G. Pipe, T.C. Forgarty and T. Hill, "Evolving radial basis function neural
networks using a genetic algorithm", IEEE International Conference on Evolutionary
Computation, Vol. 1, page 300 (1995)
[5] D. Schaffer, D. Whitley and L.J. Eshelman, “Combinations of genetic algorithms and
neural networks”. A survey of the state of the art, in Combinations of Genetic Algorithms
and Neural Networks, pp. 1-37, IEEE Computer Society Press, 1992.
[6] D. Prados. “A fast supervised learning algorithm for large multilayered neural networks”.
in Proceedings of 1993 IEEE International Conference on Neural Networks, San
Francisco, v.2, pp.778-782, 1993.
[7] A. Topchy, O. Lebedko, V. Miagkikh, “Fast Learning in Multilayered Neural Networks by
Means of Hybrid Evolutionary and Gradient Algorithm”. in Proc. of the First Int. Conf. on
Evolutionary Computations and Its Applications, ed. E. D. Goodman et al., (RAN,
Moscow), pp.390–399, 1996.
[8] B. A. Whitehead and T.D. Choate. “Cooperative - Competitive Genetic Evolution of Radial
Basis Function Centers and Widths for Time Series Predictio”. IEEE Transactions on
Neural Networks, vol. 7, no. 8, pp.869-880, 1996.
[9] Fogel L.J., Owens A.J. and Walsh M.J. “Artificial Intelligence through Simulated
Evolution”. John Wiley & Sons, 1966.
[10] M. W. Mak and K. W. Cho. “Genetic evolution of radial basis function centers for pattern
classification”. In Proc. Of The 1998 IEEE International Joint Conference on Neural
Networks, pages 669 – 673, 1998. Volume 1.
[11] A. F. Sheta and K. D. Jong. “Time-series forecasting using GA-tuned radial basis
functions”. Information Sciences, Special issue, 2001.
[12] M. Awad, H. Pomares, F. Rojas, L.J. Herrera, J. González, A. Guillén. “Approximating I/O
data using Radial Basis Functions:A new clustering-based approach”. IWANN 2005,
LNCS 3512, pp. 289– 296, 2005.© Springer-Verlag Berlin Heidelberg 2005.
[13] S. Chen, Y. Wu, and B. L. Luk. “Combined genetic algorithm optimization and regularized
orthogonal least squares learning for radial basis function networks”. IEEE-NN,
10(5):1239, September 1999.
[14] B. Burdsall and C. Giraud-Carrier. “GA-RBF: A selfoptimising RBF network”. In Proc. of
the Third International Conference on Artificial Neural Networks and Genetic Algorithms,
pages 348–351. Springer-Verlag, 1997.
[15] Y. Hwang and S. Bang. “An efficient method to construct a radial basis function neural
network classifier”. Neural Networks, 10(8):1495–1503, 1997.
[16] M. Awad, H. Pomares, I. Rojas, Member, IEEE. “Enhanced Clustering Technique in RBF
Neural Network for Function Approximation”. INFOS2007, Fifth International
Conference 24-26 March 2007, Cairo University Post Office, Giza, Egypt.
[17] T. Hatanaka, N. Kondo and K. Uosaki. “Multi–Objective Structure Selection for Radial
Basis Function Networks Based on Genetic Algorithm”. Department of Information and
Physical Science Graduate School of Information Science and Technology, Osaka
University 2–1 YamadaOka, Suita, 565–0871, Japan.
International Journal of Computer Science and Security (IJCSS), Volume (4): Issue (3) 306](https://image.slidesharecdn.com/ijcssv4i3-110103003116-phpapp02/85/International-Journal-of-Computer-Science-and-Security-IJCSS-Volume-4-Issue-3-50-320.jpg)
![Mohammed Awad
[18] P. T. Rodríguez-Piñero. “Introducción a los algoritmos genéticos y sus aplicaciones”.
Universidad Rey Juan Carlos, España, Madrid. (2003)
[19] Z. Michalewickz. Univ. of North Carolina, Charlotte “Genetic Algorithms + Data Structures =
Evolution Programs”. Springer-Verlag London, UK (1999).
[20] Gonzalez, J.; Rojas, H.; Ortega, J.; Prieto, A. “A new clustering technique for function
approximation”. Neural Networks, IEEE .Transactions on, Volume: 13 Issue: 1, Jan. 2002.
Page(s): 132 -142. “Conditional fuzzy C-means,” Pattern Recognition Lett., vol. 17, pp. 625–
632, 1996
[21] Rivas. A. “Diseño y optimización de redes de funciones de base radial mediante técnicas
bioinspiradas”. .PhD Thesis. University of Granada. 2003.
[22] González. J, “Identificación y optimización de redes de funciones de base radiales para
aproximación funcional”. PhD Thesis. University of Granada. 2001.
[23] Ph. Koehn. “Combining Genetic Algorithms and Neural Networks”. Master Thesis
University of Tennessee, Knoxville, December 1994.
[24] Sambasiva, R. Baragada, S. Ramakrishna, M.S. Rao, S. P. “Implementation of Radial Basis
Function Neural Network for Image Steganalysis”, International Journal of Computer
Science and Security, Vol. 2, Issue 1, pp. 12 – 22, March 2008
[25] Sufal D. Banani Saha, “Data Quality Mining using Genetic Algorithm”, International Journal
of Computer Science and Security, ISSN: 1985-1553, 3(2): pp 105-112, 2009.
International Journal of Computer Science and Security (IJCSS), Volume (4): Issue (3) 307](https://image.slidesharecdn.com/ijcssv4i3-110103003116-phpapp02/85/International-Journal-of-Computer-Science-and-Security-IJCSS-Volume-4-Issue-3-51-320.jpg)
![V. Joevivek, N. Chandrasekar & Y.Srinivas
Improving Seismic Monitoring System for Small to Intermediate
Earthquake Detection
V. Joevivek vjoevivek@gmail.com
Research scholar/Centre for Geo -Technology
Manonmaniam Sundaranar University
Tirunelveli, 627 012, Tamil nadu, India
N. Chandrasekar profncsekar@gmail.com
Professor and Head/Centre for Geo -Technology
Manonmaniam Sundaranar University
Tirunelveli, 627 012, Tamil nadu, India
Y. Srinivas drysv@yahoo.co.in
Associate professor/Centre for Geo -Technology
Manonmaniam Sundaranar University
Tirunelveli, 627 012, Tamil nadu, India
Abstract
Efficient and successful seismic event detection is an important and challenging
issue in many disciplines, especially in tectonics studies and geo-seismic
sciences. In this paper, we propose a fast, efficient, and useful feature extraction
technique for maximally separable class events. Support vector machine
classifier algorithm with an adjustable learning rate has been utilized to
adaptively and accurately estimate small level seismic events. The algorithm has
less computation, and thereby increased high economic impact on analyzing the
database. Experimental results demonstrate the strength and robustness of the
method.
Keywords: Feature extraction, Support Vector Machines, Kernels, Seismic signals, Wavelet
decomposition Energy.
1. INTRODUCTION
Seismic recorder based on 24-bit digitizer could not provide desired resolution for entire spectrum
of seismic signals emanated from micro to intermediate level earthquakes [13]. Therefore it is
necessary to characterize much small size seismic signals by employing a special algorithm to
distinguish between seismic and non-seismic sources. Several algorithms are there in literature.
Freiberger developed the theory of the Maximum likelihood detector assuming Gaussian signal
superimposed on Gaussian noise. But real seismic data are not so statistically predictable [3].
Allen described an event detector based on an envelope that is equal to the square of the first
derivative. The scheme well suited for short period data (frequency > 1Hz). It missed events from
tele-seismic and volcanic events [1]. Clark and Rodger developed an adaptive prediction scheme
suitable for small event detection. The drawback of the algorithm is that the signal becomes
distorted during processing and event and noise components in the same frequency range are
not separated well [2]. Similarly, Stearns and Vortman algorithm could not provide event and
noise components in a separate manner [14].
International Journal of Computer Science and Security (IJCSS), Volume (4): Issue (3) 308](https://image.slidesharecdn.com/ijcssv4i3-110103003116-phpapp02/85/International-Journal-of-Computer-Science-and-Security-IJCSS-Volume-4-Issue-3-52-320.jpg)
![V. Joevivek, N. Chandrasekar & Y.Srinivas
Fretcher et. al. described an approach to seismic event detection based on the Walsh transform
theory. This method has complicated computing and unsuitable for online real time seismic
applications [4]. Houliston et. al. have described a Short term to Long term average ratio
(STA/LTA) algorithm for multichannel seismic network system. This algorithm is based on three
components which is STA, LTA and Threshold value. The scheme depends on the amplitude
fluctuations of seismic signals rather than signal polarization and frequencies [6]. Improved
version of STA/LTA algorithm for 24 bit seismic data recording system has been developed by
Kumar et. al. [9]. Even though STA/LTA algorithm performs better, sometimes it provides false
event identification and incorrect time picking [13]. Ahmed et. al. developed wavelet based Akaike
Information Criteria (AIC) method. It gives good result for event signal having different type of
frequency [8] [18] [21]. But this could not be provided desired result when the local noise (Induced
seismic events) is overlapping. Therefore the objective of our present work is to provide additional
new features in existing 24-bit seismic monitoring system for reducing false events.
2. METHODOLOGY
An aim in this research was to identify small to intermediate seismic events. We began this study
with feature extraction technique, which is used to extract the information from the signals. Then
the data is aligned into a single row as a vector for the SVM training and testing. The SVM is a
learning machine for two-group classification problems that transforms the attribute space into
multidimensional feature space using a kernel function to separate dataset instances by an
optimal hyperplane. Subsequent section explained entire structure of methodology.
2.1. Data Source
Our seismic monitoring network has included 8 substations and 1 head station. The purpose of
this monitoring is to compile a complete database of earthquake activity in South India to predict
as low magnitude as possible to understand the causes of the earthquakes in the region, to
assess the potential for future damaging earthquakes, and to have better constrain in the patterns
of strong ground motions from earthquakes in the region. Andaman and Java-Sumatra ridges
where active collision and sudden changes taking place, have resulted very high seismicity in the
northeast coast of India and Andaman belts. Therefore, station locations were fixed in and around
this region. In this research, we used three years (2007-2010) of seismic data acquired from
above mentioned seismic monitoring network.
2.2. Feature extraction
We proposed a combined algorithm to extract the features from real time data. The combined
algorithm includes Amplitude statistics, Phase statistics and Wavelet Decomposition Energy.
2.2.1. Statistical parameters
Standard statistical techniques have been established for discriminate analysis of time series
data [12], and structural techniques have been shown to be effective in a variety of domains
involving time series data [17][19][20]. Mainly we focused four standard statistical parameters to
extract the features from the seismic signals. Those parameters are Mean, Standard deviation,
Skewness and Kurtosis. Mean and variance are fundamental statistical attributes of a time series.
The arithmetic mean of a time series is the average or expected value of that time series. In some
cases, the mean value of a time series can be the operating point or working point of a physical
system that generates the time series.
The Skewness and Kurtosis are higher- order statistical attributes of a time series. Skewness
indicates the symmetry of the probability density function (PDF) of the amplitude of a time series.
A time series with an equal number of large and small amplitude values has a Skewness of zero.
A time series with many small values and few large values is positively skewed (right tail), and the
Skewness value is positive. A time series with many large values and few small values is
negatively skewed (left tail), and the Skewness value is negative. Amplitude and Shape Statistical
parameters are shown in Table 1.
International Journal of Computer Science and Security (IJCSS), Volume (4): Issue (3) 309](https://image.slidesharecdn.com/ijcssv4i3-110103003116-phpapp02/85/International-Journal-of-Computer-Science-and-Security-IJCSS-Volume-4-Issue-3-53-320.jpg)
![V. Joevivek, N. Chandrasekar & Y.Srinivas
Methods Parameters Notation
Mean 1 N
A X (i)
N i 1 ,
Where X (i ) is the spectral magnitude for the i th
frequency bin
Standard deviation 1 N
2
Amplitude B ( X (i ) A )
N i 1
Skewness 1 N X (i ) A
3
C B
N i 1
Kurtosis 1 N X (i ) A
4
D B 3
N i 1
Mean 1 N N
E iX (i) Where Q i 1 X (i)
Q i 1 ,
Standard deviation 1 N
F (i E ) 2 X (i )
Q i 1
Shape
Skewness 1 N i E
3
G X (i )
Q i 1 F
Kurtosis 1 N i E
4
D X (i) 3
Q i 1 F
TABLE 1: Amplitude and Shape Statistical Parameters
2.2.2. Wavelet Decomposition Energy
We derive a set of features from Wavelet Decomposition Energy generated from a discrete
Wavelet Transform [20]. Decomposition energy equation (Equation 1) and its results (see figure
1) are described below.
E p (i ) log p (i ) , (1)
i
X (i ) 2
Where, p(i) and X (i ) is a samples of the decomposition signals.
2
i
X (i )
International Journal of Computer Science and Security (IJCSS), Volume (4): Issue (3) 310](https://image.slidesharecdn.com/ijcssv4i3-110103003116-phpapp02/85/International-Journal-of-Computer-Science-and-Security-IJCSS-Volume-4-Issue-3-54-320.jpg)
![V. Joevivek, N. Chandrasekar & Y.Srinivas
FIGURE 1: Energy difference between Earthquake and Non-earthquake signals
The result in Figure 1 is a good example to show that level 1 and level 2 of earthquake and non-
earthquake signals are well separable. Finally thirteen features have been developed from both
statistical and wavelet decomposition energy. Next subsection illustrates SVM classifier
mechanism.
2.3. SVM classifier
In support vector machines, the learning machine is given a set of examples (training data) and
its associated class labels. SVM tries to construct a maximally separating hyperplane between
classes, thus by differentiating the classes [5]. The maximally separating linear hyperplane in
support vector binary classifiers can be expressed as w T x 0 and two bounding hyperplanes
can be expressed as wT x 1 and wT x 1 . The training data belonging to +1 class obey the
constraint wT x 1 and the training data point belonging to -1 class obeys the
constraint wT x 1 . However, there are cases where our training data points will be deviated
from their respective bounding plane, such deviation of data points from their respective bounding
planes are called as error. A positive quantity called ξ is added or subtracted to the training data
that constitutes to error to obey the constraints. SVM aims at obtaining a maximum margin and
minimum error classifier. General formulation of SVM is given in equation 2.
m
1
min wT w C i
w , , 2
i 1
subject to di (w T xi ) i 1 0, 1 i m
The quantity i 0, 1 i m 1 T ensures maximum
w w
2
margin, which is the reciprocal of the distance between the two bounding hyperplanes from the
m
origin. Minimization of the quantity ensures minimum error. The parameter ‘C’ controls the
i 1
i
International Journal of Computer Science and Security (IJCSS), Volume (4): Issue (3) 311](https://image.slidesharecdn.com/ijcssv4i3-110103003116-phpapp02/85/International-Journal-of-Computer-Science-and-Security-IJCSS-Volume-4-Issue-3-55-320.jpg)


![Bryan Sarazin & Syed Rizvi
A Self-Deployment Obstacle Avoidance (SOA) Algorithm for
Mobile Sensor Networks
Bryan Sarazin bsarazin@bridgeport.edu
Department of Computer Science and Engineering
University of Bridgeport
Bridgeport, 06601, USA
Syed S. Rizvi srizvi@bridgeport.edu
Department of Computer Science and Engineering
University of Bridgeport
Bridgeport, 06601, USA
Abstract
A mobile sensor network is a distributed collection of nodes, each of which has
sensing, computing, communicating, and locomotion capabilities. This paper
presents a self-deployment obstacle avoidance (SOA) algorithm for mobile
sensor networks. The proposed SOA algorithm provides full coverage and can
be efficiently used in a complex, unstable, and unknown environment. Moreover,
the SOA algorithm is implemented based on the assumption that nodes are
randomly deployed near the sink where each node knows the location of the
target. In proposed SOA algorithm, the nodes determine a partner node and link
up effectively to form a node pair. A node pair which is closest to the target
searches for the target with all other node pairs following the previous node.
There are number of priority rules on which the mobility of sensor nodes is
based. The SOA algorithm ensures that the nodes determine a path around any
obstacles. Once a connection is established from the sink to the target, the node
pair separates and starts providing the full coverage. The experimental
verifications and simulation results demonstrate that the proposed algorithm
provides three main advantages. First, it reduces the total computation cost.
Second, it increases the stability of the system. Third, it provides greater
coverage to unknown and unstable environment.
Keywords: Mobile nodes, Mobile networks, Self deployment, Sensor networks.
1. INTRODUCTION
The purpose of a mobile sensor network is to provide a reliable connection from sink to target and
perform some form of information gathering. Wireless sensor networks provide different functions
in a variety of applications including environmental monitoring, target tracking, and distributed data
storage. A basic problem faced by the current sensor network is the need of an efficient
deployment of sensor nodes that can provide the required coverage [1], [13]. In some situations,
the tasks put forward higher requirements; they not only need a connection, but also require the
connection to be efficient and secure. If the environment changes or a hostile environment can not
guarantee the security of sensors, resulting in damage to sensors, or loss of contact with sensors,
the entire system still has to ensure the realization of the most basic functions.
International Journal of Computer Science and Security (IJCSS), Volume (4): Issue (3) 316](https://image.slidesharecdn.com/ijcssv4i3-110103003116-phpapp02/85/International-Journal-of-Computer-Science-and-Security-IJCSS-Volume-4-Issue-3-60-320.jpg)
![Bryan Sarazin & Syed Rizvi
For instance, a mobile sensor network used in natural disaster relief such as earthquake, a safe
route through hazardous terrain may need to be determined. The environment is complex and
variable, and may continually change. There may be any number of unknown obstacles within this
environment, with the possibility that they may shift or move. Therefore, in this defined area, we
can not know the state of the environment, all sensors must be able to locate obstacles at run time
and be able to negotiate them. The sensing and computation must be efficient [1] [2] since the
response time is pressing in natural disaster relief. If it takes too long, the value of such a system
is lost. This implies that, for each of the sensors to sense, perform computation, and then
communicate with each other is inefficient [3] [11] [12]. Another case is in military applications
such as target detection. The sensors should provide detection of the enemy in a given area. In
this application, coverage is vital. If coverage criteria cannot be met, the enemy may not be
detected, rendering the network virtually useless.
There are a number of problems associated with current mobile sensor networks. For instance,
how can nodes provide sensing capability, how do we make computation and locomotion efficient,
and how do the sensors create a stable connection while providing coverage? The proposed SOA
algorithm provides solution to these problems. First, we assume that all nodes are randomly
deployed near the sink. Each node has a priority based on its relative position to the sink, the
target, and all other nodes. The nodes interact with each other to construct node pairs based on
priority where each node pair effectively moving as a single node. Only the node pair with the
highest target priority begins moving towards the target. The node pair with the second highest
target priority follows the first pair and so on. Each node pair stays within communication range of
the pair with higher target priority and higher sink priority. Only the node pair with the highest target
priority performs computation to determine movement while the other node pairs simply follow the
pair with higher priority. The proposed SOA algorithm shows a significant reduction in the number
of computations that each sensor node has to perform in order to locate the position – thus it
provides an efficient and faster way to calculate the position.
When the first node pair encounters an obstacle, it does three things. First, it calculates the range
to the obstacle. Second, it determines the direction to avoid the obstacle. Third, it negotiates with
the obstacle. Once the target is reached, the node pairs separate to provide coverage and
connection reliability. We assume that the radius of the coverage area that each node provides is r
whereas the amount of sensors in a combination (referred to as a pair) is assumed to be n. Taking
these parameters into account, the whole mobile sensor network can cover an area of a width up
to n*r.
Coverage criteria may be met by defining the number of nodes paired together. We can control the
distance of separation and adjust this distance to meet our requirements. One of the nodes can
keep communicating with all surrounding nodes, ensuring the connection is maintained even
during the separation period (i.e., it shows a strong connection). Otherwise, the node can maintain
a connection with at least two other nodes. The strong connection can make the mobile sensor
network more stable and secure, because if one of the nodes is destroyed, its neighboring nodes
can maintain communication with the other nodes. The strong connection could be used in a
hazardous environment, such as on a battle field or in natural disaster relief. In this environment,
the nodes could be easily damaged, but the mobile sensor network is pivotal, so it must keep
working despite the loss of nodes.
2. PROBLEM FORMULIZATION
The goal of this research work is to develop an algorithm for self-deployment of a mobile sensor
network which has the ability to build an uninterrupted wireless connection between the sink and
the target while at the same time provides coverage to a certain area within an unknown
environment. To achieve this goal, we use the moving algorithm for self-deployment of a mobile
sensor network.
International Journal of Computer Science and Security (IJCSS), Volume (4): Issue (3) 317](https://image.slidesharecdn.com/ijcssv4i3-110103003116-phpapp02/85/International-Journal-of-Computer-Science-and-Security-IJCSS-Volume-4-Issue-3-61-320.jpg)
![Bryan Sarazin & Syed Rizvi
The moving algorithm is based on the connection built between multiple nodes, communication
range, and the direction of movement of each node. Each node finds a suitable position in the
unknown environment to ensure successful deployment. The nodes should have the ability to
determine movement without needing a constant connection with other nodes. If the node has
enough self-direction, it makes node communication more efficient because it does not need to
maintain constant communication. Each node may only communicate with the other nodes within
its communication range since the communication between nodes should be efficient as possible.
However, each node has the ability to communicate with the sink via multi-hop communication.
The nodes use this multi-hop communication system to report obstacle position if known, target
position if known, and its own position.
An obstacle may exist in one of the two possible states. The obstacle may be a safe distance from
the node. In this case, the node broadcasts its location and keeps moving. In the other case, the
obstacle is in the path of the node. The node broadcasts the location of the obstacle and navigates
it. Self-organization allows the following nodes (i.e., nodes immediately behind the higher priority
nodes) to navigate the obstacle without performing any computation (i.e., these nodes simply
follow the path of a higher priority node).
Before we present the proposed SOA algorithm, it is worth mentioning some of our key
assumptions and notations we use in the proposed algorithm.
Locomotion (i.e., each node has the capability of movement).
Communication (i.e., each node can communicate with the other nodes within the
communication rage).
Observation (i.e., each node can detect potential obstacles and the target).
Position detection (i.e., each node can detect its position such as using a GPS system)
For the sake of the simulation results, we shall assume that the sink knows its position
and the position of the target. This prevents the nodes from attempting to scan the
entire environment in order to detect the target.
We shall also assume that the target is detectable by each node and does not have the
capability of movement. Also, we assume that the potential obstacles are present
within the paths (i.e., no obstacle is too large to avoid).
3. MOVING AND PRIORITY RULES FOR SOA ALGORITHM
Mobile sensor networks (MSNs) have received considerable research attention over the last
decade because of their ease of deployment without the need of any fixed infrastructure [14]. Due
to its highly dynamic nature and network topology, one of the fundament challenges in MSN is the
design of self deployment algorithms that can enable the sensor nodes to organize themselves
while at the same time maintain a consistent connection with the other deployed nodes and
provide a coverage, so that the sensor nodes can communicate with each other within their
respective communication range.
Several self-deployment algorithms have been suggested for MSNs over the past few years [3]
[9] [11] [15]. The proposed SOA algorithm is the extension of the obstacle avoidance algorithm
proposed by Takahashi et. al [3]. However, our SOA algorithm differs from the algorithm
proposed by [3] since the proposed SOA algorithm not only avoids the obstacles but also
provides coverage to sensor nodes which is a significant improvement over the algorithm
suggested by [3].
The algorithm is based upon a number of priority and moving rules. The priority rules for a node n
establish the priority rules for all objects which include the sink, target, and all other nodes.
These priority rules are as follows:
International Journal of Computer Science and Security (IJCSS), Volume (4): Issue (3) 318](https://image.slidesharecdn.com/ijcssv4i3-110103003116-phpapp02/85/International-Journal-of-Computer-Science-and-Security-IJCSS-Volume-4-Issue-3-62-320.jpg)
![Bryan Sarazin & Syed Rizvi
Priority rule I: priority-s is settled to the node which is nearest to node n and closer
to the sink. If there are no nodes closer to the sink than node n, priority-s is settled to
the sink.
Priority rule II: priority-t is settled to the node which is nearest to node n and closer
to the target. If there are no nodes closer to the target than node n, priorities-t is
settled to the target.
Priority rule III: It is not permitted that priority-t is settled to an object for which
priority has already been settled.
It should be noted that the stable connection area is defined as the area within which node n can
effectively communicate. Taking this into consideration, the moving rules can be defined as
follows:
Moving rule I: Node n moves to the stable connection area of priority-s and keeps
this condition. If node n cannot move to that area, it moves to the nearest position in
the area it can reach. In this case, the Moving rule I is not satisfied.
Moving rule II: Node n moves to the stable connection area of priority-t and keeps
this condition with maintenance of Moving rule I. If node n cannot move to that area,
node n moves to nearest position in the area it can reach. In this case, the Moving
rule II is not satisfied.
Moving rule III: The higher priority rule preferentially gets executed. Moving rule II is
executed only after the Moving rule I is satisfied.
Also, the obstacle avoidance algorithm used is the Virtual Force Field (VFF) [13] method. Any
obstacle acts as a virtual repulsive force against any node once it has been detected.
4. SELF-DEPLOYMENT OBSTACLE AVOIDANCE (SOA) ALGORITHM
We assume every node is initially deployed near the sink as shown in Fig. 1.
FIGURE 1: Initial Deployment of Nodes.
4.1 Determination of Connection Priority
First, the sink receives the position information of all nodes. Then the sink determines the relative
distance between each node and the target, and each node and the sink.
4.2 Determination of Partner Node
Each node determines its partner node based on Priority rule II. For instance, the node with the
highest priority-t partners with the second highest priority-t (Fig. 2), this continues until all nodes
are paired. Once two nodes are partnered, they are closed enough to assume that they can move
as one pair node.
International Journal of Computer Science and Security (IJCSS), Volume (4): Issue (3) 319](https://image.slidesharecdn.com/ijcssv4i3-110103003116-phpapp02/85/International-Journal-of-Computer-Science-and-Security-IJCSS-Volume-4-Issue-3-63-320.jpg)


![Bryan Sarazin & Syed Rizvi
FIGURE 11: State of Simulation before Node Pair Separation.
FIGURE 12: Final State of Wireless Sensor Network.
proposed algorithm ensures the ability to provide coverage quickly, by initially pairing nodes. It
may be possible, in the future, to show that the mobile sensor network is more efficient when
more nodes are added into the network. If more nodes are added to a node pair, it takes less of
the networks resources to deploy the nodes. Only one node in the node pair must communicate
and perform computation during the deployment of the network. Moreover, the proposed SOA
algorithm provides fast deployment of nodes to targets since the priority after the pairing of nodes
is to reach the target as efficiently as possible.
7. REFERENCES
[1] Y. Liang, C. Weidong, X. Yugeng. “A review of control and localization for mobile sensor
networks”. In Proceedings of the Sixth World Congress on Intelligent Control and Automation
(WCICA 2006), pp. 9164-9168, Dalian, China, 2006.
[2] T. Jindong, X. Ning. “Integration of sensing, computation, communication and cooperation for
distributed mobile sensor networks”. In Proceedings of the IEEE International Conference on
Robotics, Intelligent Systems and Signal Processing, pp. 54- 59, 2003.
[3] J. Takahashi, K. Sekiyama, T. Fukuda. "Self-Deployment algorithm of mobile sensor network
based on connection priority criteria". Proceedings of 2007 International Symposium on
Micro-Nano Mechatronics and Human Science (MHS2007), pp. 564-569, 2007.
[4] M. Singh, M. Gore. “A solution to sensor network coverage problem”. In Proceedings of the
2005 IEEE International Conference on Personal Wireless Communications, (ICPWC), pp.
77-80, January, 2005.
International Journal of Computer Science and Security (IJCSS), Volume (4): Issue (3) 328](https://image.slidesharecdn.com/ijcssv4i3-110103003116-phpapp02/85/International-Journal-of-Computer-Science-and-Security-IJCSS-Volume-4-Issue-3-72-320.jpg)
![Bryan Sarazin & Syed Rizvi
[5] R. Tynan, G. DavidMarsh, D. O'Kane. “Interpolation for wireless sensor network coverage”.
In Proceedings of the Second IEEE Workshop on Embedded Networked Sensors, pp. 123-
131, 2005.
[6] M. Cheng, L. Ruan, W. Wu. “Achieving minimum coverage breach under bandwidth
constraints in wireless sensor networks”. In Proceedings of the 24th Annual Joint Conference
of the IEEE Computer and Communications Societies, pp. 2638- 2645, 2005.
[7] S. Ram, D. Majunath, S. Iyer, D. Yogeshwaran. “On the path coverage properties of random
sensor networks”, IEEE Transaction on Mobile Computing, 6(5): 494-506, 2007.
[8] P. Pennesi, C. Paschalidis. “Solving sensor network coverage problems by distributed
asynchronous actor-critic methods”. In Proceedings of the 46th IEEE Conference on Decision
and Control, pp. 5300-5305, 2007.
[9] N. Aziz, A. Mohemmed, D. Sagar. “Particle swarm pptimization and voronoi diagram for
wireless sensor networks coverage optimization” In Proceedings of the International
Conference on Intelligent and Advanced Systems, pp. 961-965, 2007.
[10] J. Kanno, J. Buchart, R. Selmic, V. Phoha, “Detecting coverage holes in wireless sensor
networks”. In Proceedings of the 2009 17th Mediterranean Conference on Control and
Automation, pp.452-457, Thessaloniki, Greece June 2009.
[11] Y. Li and Y. Liu, "Energy saving target tracking using mobile sensor networks". In
Proceedings of the IEEE International Conference on Robotics and Automation, pp. 674-679,
April 2007.
[12] S. Zhang, J. Cao, L. Chen, D. Chen. "Locating nodes in mobile sensor networks more
accurately and faster". In Proceedings of the 5th Annual IEEE Communications Society
Conference on Sensor, Mesh and Ad Hoc Communications and Networks, (SECON '08), pp.
37-45, San Francisco, CA, 2008.
[13] J. Lu, T. Suda. "Differentiated surveillance for static and random mobile sensor networks.
IEEE transactions on wireless communications, 7(11): 4411-4423, 2008.
[14] A. Rai, S. Ale, S. Rizvi, A. Riasat. ”New methodology for self localization in wireless sensor
networks”. Journal of Communication and Computer, 6(11): 37-44, 2009.
[15] S. Rizvi and A. Riasat, “Use of self-adaptive methodology in wireless sensor networks for
reducing energy consumption,” IEEE International Conference on Information and Emerging
Technologies (IEEE ICIET-2007), pp. 1 – 7, July 06-07, 2007.
International Journal of Computer Science and Security (IJCSS), Volume (4): Issue (3) 329](https://image.slidesharecdn.com/ijcssv4i3-110103003116-phpapp02/85/International-Journal-of-Computer-Science-and-Security-IJCSS-Volume-4-Issue-3-73-320.jpg)


![Ala'a M. Al-Shaikh
section or the practical one. Accordingly, the HCGE specifies the registration duration which allows
students to apply for the exam.
At the end of registration duration, UEGE start its final activities such as managing student seating in
exam halls. Each student is given a Seat Number, which is a unique number, and it's used to identify
the student on the coming exam activities.
After the expiry of registration duration, college registrars are required to correct any errors that may
appear during the registration phase. Thus, they make the necessary updates on their records, and
send them in an MS-Excel file with a predetermined format to UEGE via one of the following methods:
1. E-mail.
2. Floppy Diskettes.
3. CD-ROMs.
4. Flash Memories.
5. Papers (Hard Copies)
Finally, a unified MS-Excel file is complete, and it's named the Students' Base File. It contains
detailed data about the students who will actually attend the exam; and it serves as the exam's
database.
To summarize, the conventional manual system suffers the following problems:
1. It's a hard method to communicate between UEGE and the colleges.
2. Inaccurate statistical data gathered from time to time due to its dependent on the time in
which it's ordered.
3. Not all the colleges fill their students' data correctly or properly in the Excel files; neither they
comply to the predetermined file format.
4. The method of data exchange between college registrars and UEGE is unsafe, in that storage
media might be susceptible to corruption at any time.
1.2 The Proposed System
The key solution to avoiding all the problems mentioned previously is to find a unified way to solve the
problems mentioned earlier. The only unified way is by computerization.
First, registrars should find a better way to communicate with UEGE; this could only be achieved by
an Online Registration System. Since the whole country is connected to the Internet, it's very easy to
make use of that feature to facilitate the way in which UEGE can monitor what's going on there in the
colleges and detect errors during the registration process once they are entered to the system.
Hence, there's no need to wait until the end of the registration duration to start auditing.
Not only will the system be a registration system. In fact, Online Registration is a subsystem of the
whole system.
The system is a Web Portal. By definition, a Web Portal is a system that presents information from
[1]
diverse sources in a unified way . Contents of a portal may include reports, announcements, e-mail,
[2]
searches, etc .
This portal is classified into a Corporate Web Portal, that is, it allows internal and external access to
information specific to GADE.
1.3 Online-Registration Systems
Several registrations systems are used in the Jordanian universities and colleges, some of them
support the online registration features and some do not. Some of these systems were purchased by
local or international software companies, and some are developed internally by the software
development teams in the computer centers each in the relevant university or college.
What makes this registration system almost distinguished when compared to others, is that it’s a
Special-Purpose Registration System. First of all, the system is explicitly used to enroll students to
exams, the General-Associate-Degree Examination (GADE); here, courses are grouped into
collections called Exam Papers.
International Journal of Computer Science and Security (IJCS), Volume (4), Issue: (3) 333](https://image.slidesharecdn.com/ijcssv4i3-110103003116-phpapp02/85/International-Journal-of-Computer-Science-and-Security-IJCSS-Volume-4-Issue-3-77-320.jpg)
![Ala'a M. Al-Shaikh
An Exam Paper is a set of courses each with a definite number of questions, each question has a
weight; courses of each specialty are grouped into papers each with a definite mark, when all-paper
marks are added to each other final exam mark can be calculated.
Secondly, this system is designated to examinations; no other system all over Jordan is used to enroll
student for such a general examination. Purchasing a Ready-Made Application to manage GADE
Activities will be impossible since GADE is the only examination in Jordan held for the Associate-
Degree Students.
Finally, this system is to be used by college registrars themselves not the students; most online
registration systems in the market and the other that are applied in the other universities and colleges
are used by the students themselves.
2. MATERIALS AND METHODS
The proposed system is a 3-Tier web-based. 3-Tier Architecture is a Client/Server Architecture in
which the user interface, functional process logic (business rules), computer data storage, and data
[3]
access are developed and maintained as independent modules, most often in different platforms .
Fig. 1 shows a 3-Tier Architecture design.
2.1 The Database Layer
The proposed system's database will be implemented using Microsoft SQL Server 2005. This layer
provides high connectivity and availability, plus, it provides system developers with the ability to
manage and administer their databases easily, especially using the Graphical User Interface (GUI) of
its Management Studio. In addition to enabling developers to create their own stored procedures or
use built-in system ones.
International Journal of Computer Science and Security (IJCS), Volume (4), Issue: (3) 334](https://image.slidesharecdn.com/ijcssv4i3-110103003116-phpapp02/85/International-Journal-of-Computer-Science-and-Security-IJCSS-Volume-4-Issue-3-78-320.jpg)

![Ala'a M. Al-Shaikh
The simplest client must have a PC, preferably running Windows XP as an operating system, with
Internet Explorer (IE) installed to enable the users to browse the website over the Internet.
As a web-based application, all processing is done on behalf of the users' computers on the server
hosting the system. So, other operating systems such as Linux, UNIX, Mac OS, etc. might be
acceptable as client machines.
2.4 Process Model
The Software Development Process used in this system is the Waterfall Model shown in Fig. 2. The
Waterfall Model was chosen because of the fact that system requirements are well understood and
[4]
won't change during system development .
FIGURE 2: The Waterfall Model.
Actually, this system is designed, developed, and implemented by the Computer Staff at UEGE, so all
requirements are made by UEGE itself, which are already clear by 95% prior to starting.
2.5 System Overview
Fig. 3 shows the context diagram of the proposed system.
FIGURE 3: System's Context Diagram
International Journal of Computer Science and Security (IJCS), Volume (4), Issue: (3) 336](https://image.slidesharecdn.com/ijcssv4i3-110103003116-phpapp02/85/International-Journal-of-Computer-Science-and-Security-IJCSS-Volume-4-Issue-3-80-320.jpg)
![Ala'a M. Al-Shaikh
[5]
The Context Diagram is an overview of the system that shows its basic inputs/outputs .
2.6 System Use Case Diagram
Use Case Diagram is a graphical representation that describes how users will interact with the
[6]
proposed system . Fig. 4 shows the Use Case Diagram of the proposed system.
FIGURE 4: Use Case Diagram of the Proposed System.
3. RESULTS
This system comprises a number of subsystems (smaller systems) that integrate together to form the
overall system requirements and functionality.
3.1 Registration Subsystem
This is the main and the most important subsystem of the web portal which is depicted in Fig. 5. The
main reason led to think in a computerized system to manage GADE's activities was to solve the
registration problems, improve communication methods between college registrars and UEGE, and to
monitor what's going on there in the colleges during the registration duration trying to catch any
exceptional cases.
International Journal of Computer Science and Security (IJCS), Volume (4), Issue: (3) 337](https://image.slidesharecdn.com/ijcssv4i3-110103003116-phpapp02/85/International-Journal-of-Computer-Science-and-Security-IJCSS-Volume-4-Issue-3-81-320.jpg)

![Ala'a M. Al-Shaikh
Actually, the registration process is not that easy, on the contrary, it's a very vital and crucial
component of the system, despite the fact that it's transparent to the end user (registrar).
The user enters the student data to the system, and gets two things as a feedback, they are a
confirmation from the system to assure that the student was enrolled into the exam, and an exam
receipt to be passed to the student as mentioned earlier.
But, what goes inside is a complex, yet critical set of operations depicted in Fig. 5, which shows the
Sequence Diagram of the Online-Registration Process. The Sequence Diagram shows system
[7]
objects and how they interact with each other and the order in which these interactions occur .
3.2 Reporting Subsystem
Another important aspect of the system is that it provides a reporting subsystem for three different
parties dealing with the system, they are:
1. College Registrars.
2. Moderate Exam Coordinators.
3. UEGE Administration.
Now, it's easy for each college registrar to know how may students applied for the exam, the fees
required from each student, and the papers in which the student will have the exam in.
For Moderate Exam Coordinators it's now clear to them how many students will apply for the exam in
their moderates, so they can make the necessary calculations regarding each college's fees. Plus,
they are now able to know how many halls they will have in the moderate to manage student seating
in them, how many labs are needed to be reserved for the purposes of the practical exam, and they'll
be able to know what specializations student will have exams in.
3.3 Repository Subsystem
By looking to the System's Use Case shown in Fig. 4, it's clear that there are three means of
communication between system users and UEGE.
The first communication method is by using the reporting subsystem which issues different types of
reports as demanded. Another method is by the news updates done by system's administrator, and
viewed by registrars.
The last method, and it's the most important communication method, is by using the System
Repository (Repository Subsystem). Repository Subsystem and System Repository will be used
interchangeably henceforth.
System Repository is a tool that enables users to download files necessary for managing GADE
activities.
Such files include the study plans for different Associate-Degree programs and specialties. They also
include course-to-paper mapping for each specialty, which acts as a guide to let examinees know how
courses they studied are distributed among exam papers, and the weight of each paper (paper full
mark and minimum passing mark). Also, they include the files that describe what skills are required for
the student to have to be eligible to the practical exam in his/her specialty.
As depicted in the Use Case shown in Fig. 4, users of the system may also link to the latest
regulations and legislations issued by HCGE, plus they can also download exam appointments,
whether for the paper-based or the practical exam.
Files are uploaded to the website by a user with administrative privileges, the System Administrator.
The website refers to them as links in the various menus as will be shown later.
Files uploaded to the system have different formats, such as:
1. Portal Document Format (PDF), this is the most widely used format in this website since it's
been read the same by different operating systems.
2. MS-Word Documents (DOC).
International Journal of Computer Science and Security (IJCS), Volume (4), Issue: (3) 339](https://image.slidesharecdn.com/ijcssv4i3-110103003116-phpapp02/85/International-Journal-of-Computer-Science-and-Security-IJCSS-Volume-4-Issue-3-83-320.jpg)
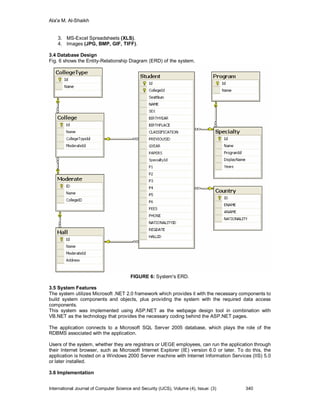


![Renu Mishra, Inderpreet Kaur & Sanjeev sharma
trust threshold, the corresponding the intermediate node is marked as malicious. In this paper, we
study about trust mechanism in the ad hoc networks and propose a trust evaluation based
security solution. The rest of the paper is organized as follows. Section two discusses the routing
protocol in the ad hoc networks. Section three presents the Trust mechanism. In section four, a
trust evaluation based solution for the ad hoc networks is proposed. In the next section the
conclusions and directions of future work are given in the last section.
2. ROUTING PROTOCOLS IN MANETs
In the ad hoc networks, routing protocol should be robust against topology update and any kinds
of attacks. Unlike fixed networks, routing information in an ad hoc network could become a target
for adversaries to bring down the network. Existing routing protocols can be classified into mainly
two types- proactive routing protocols and reactive routing protocols [7]. Proactive routing
protocols such as Destination-Sequenced Distance- Vector Routing (DSDV) [5] maintain routing
information all the time and always update the routes by broadcasting update messages. Due to
the information exchange overhead, especially in volatile environment, proactive routing protocols
are not suitable for ad hoc networks [7]. However, reactive routing is started only if there is a
demand to reach another node. Currently, there are two widely used reactive protocols- Ad-
hoc On-Demand Distance Vector Routing (AODV) and Dynamic Source Routing (DSR)
which will be discussed later. But they all suffer from the high route acquisition latencies [7].
That is, messages have to wait until a route to destination has been discovered. Normally,
reactive routing protocols include two processes- route discovery and route maintenance.
In this paper, we propose to design a Trust-based Security protocol (TMSP) based on a MAC-
layer, approach which attains confidentiality and authentication of packets in routing layer and link
layer of MANETs, having the following objectives:
Attack-tolerant to facilitate the network to resist attacks and device compromises besides
assisting the network to heal itself by detecting, recognizing, and eliminating the sources of
attacks.
Lightweight in order to considerably extend the network lifetime, that necessitates the
application of ciphers that are computationally efficient like the symmetric-key algorithms and
cryptographic hash functions.
Cooperative for accomplishing high-level security with the aid of mutual
collaboration/cooperation amidst nodes along with other protocols.
Flexible enough to trade security for energy consumption.
Compatible with the security methodologies and services in existence.
Scalable to the rapidly growing network size.
FIGURE 1: Security at different levels
International Journal of Computer Science and Security (IJCS), Volume (4), Issue: (3) 347](https://image.slidesharecdn.com/ijcssv4i3-110103003116-phpapp02/85/International-Journal-of-Computer-Science-and-Security-IJCSS-Volume-4-Issue-3-91-320.jpg)
![Renu Mishra, Inderpreet Kaur & Sanjeev sharma
2.1 Dynamic Source Routing
DSR is a source rooting in which the source node starts and take charge of computing the routes
[9]. At the time when a node S wants to send messages to node T, it firstly broadcasts a route
request (RREQ) which contains the destination and source nodes’ identities. Each intermediate
node that receives RREQ will add its identity and rebroadcast it until RREQ reaches a node n
who knows a route to T or the node T. Then a reply (RREP) will be generated and sent back
along the reverse path until S receives RREP. When S sends data packets, it adds the path to
the packets’ headers and starts a stateless forwarding [9]. During route maintenance, S detects
the link failures along the path. If it happens, it repairs the broken links. Otherwise, when the
source route is completely broken, S will restart a new discovery.
2.2 Ad-hoc On-demand Distance-Vector
It is similar to DSR when RREQ is broadcast over the network. When either a node knowing
a route to T or T itself receives RREQ, it will send back RREP. The nodes receiving RREP add
forward path entries of the destination T in their route tables.
According to [9], there are many differences between DSR and AODV. Firstly, destination T in
DSR will reply to all RREQ received while T in AODV just responds to the first received RREQ.
Secondly, every node along the source path in DSR will learn routes to any node on the path.
But in AODV, intermediate nodes just know how to get the destination.
3. TRUST MECHANISMs
There is a common assumption in the routing protocols that all nodes are trustworthy
and cooperative[4]. However, the fact is different. Malicious nodes can make use of this to
corrupt the network. A lot of attacks such as man-in-the-middle, black hole, DOS may be
deployed to destroy the network. As we discussed above, the nodes in MANETs are not as
powerful as desk PCs and there is no fixed infrastructure. It is difficult to establish PKI. Even if
PKI is in use, it is also needed to make sure the nodes are cooperative. Furthermore, sometimes
other factors such as reliability and bandwidth are included in the route discovery besides the
shortest path. Trust is introduced to solve the problems. However, there is no clear consensus
on the definition of trust. Commonly, it is interpreted as reputation, trusting opinion and
probability [4]. Simply, we can consider it as the probability that an entity performs an action as
demanded.
3.1 Trust Properties
According to [2, 6], there are four major properties of Trust:
• Context Dependence: The trust relationships are only meaningful in the specific contexts [6].
• Function of Uncertainty: Trust is an evaluation of probability of if an entity will perform the
action.
• Quantitative Values: Trust can be represented by numeric either continuous or discrete values.
• Asymmetric Relationship: Trust is the opinion of one entity for another entity. That is, if A trusts
B, it is unnecessary to hold that B trusts A.
3.2 Trust classification and computation
Trust is extracted from social relationship. When we have some interactions with somebody
although not so much, a general opinion will be formed. However, if somebody is completely new
for us and we have to do business with him, what should we do? Perhaps, there are some
friends of ours knowing him. Then we collect their opinions. From the information gathered, we
get our own choice. It is the same in MANETs. The trust in MANETs can be classified into two -
First-hand trust and recommendation. Some- times, when there is not enough first-hand
evidence, recommendation should be taken into consideration, too. The combination of the two
will be the final trust. Of course, there are several methods to concatenate the two types of trust. One
of them will be discussed in the following sections.
International Journal of Computer Science and Security (IJCS), Volume (4), Issue: (3) 348](https://image.slidesharecdn.com/ijcssv4i3-110103003116-phpapp02/85/International-Journal-of-Computer-Science-and-Security-IJCSS-Volume-4-Issue-3-92-320.jpg)
![Renu Mishra, Inderpreet Kaur & Sanjeev sharma
3.3 Trust representation
There are some different representations of trust. Basically, they can be divided into two
categories-continuous and discrete numbers. It is also probable that different ranges can be
adopted. There are two examples.
• In continuous, trust values are represented in discrete levels ”V.High”, ”High”, ”Mid” and
”Low” which are in a decreasing order of trust.
• In discrete, the trust value is a continuous real number in [-1, +1] where -1 denotes completely
no trust, 0 complete uncertainty, +1 complete trust respectively.
4. PROPOSED SCHEME (TRUSTED ROUTING):
In our proposed protocol, by dynamically calculating the nodes trust counter values, the source
node can be able to select the more trusted routes rather than selecting the shorter routes.
The routing process can be summarized into the following steps:
1. Discovery of routes: it is just like the route discovery in DSR. Suppose A starts this process to
communicate with D. At the end, A collects all the available routes to D;
2. Validation of routes: Node A check the trust values of the intermediate nodes along the path.
Assuming node B’s trust value is missing in A’s trust table or its trust values is below a
certain threshold, put B into a set X;
3. During the transmission, node A updates its trust table based on the observations. When
some malicious behavior is found, A will discard this path and find another candidate path or
restart a new discovery.
4. Compute trust values for every node in X based on the trust graph.
5. Among all paths, A chooses the one with the max ( in=1pi) where n is the number of nodes
along with path.
Our protocol marks and isolates the malicious nodes from participating in the network. So the
potential damage caused by the malicious nodes are reduced. We make changes to the AODV
routing protocol. An additional data structure called Neighbors’ Trust Counter Table (NTT) is
maintained by each network node.
Let {Tc1, Tc2…} be the initial trust counters of the nodes {n1, n2…} along the route R1 from a
source S to the destination D. Since the node does not have any information about the reliability
of its neighbors in the beginning, nodes can neither be fully trusted nor be fully distrusted. When a
source S wants to establish a route to the destination D, it sends route request (RREQ) packets.
Each node keeps track of the number of packets it has forwarded through a route using a forward
counter (FC). Each time, when node nk receives a packet from a node ni, then nk increases the
forward counter of node ni
FCni = FCni + 1, i=1, 2…… (1)
Then the NTT of node nk is modified with the values of FCni . Similarly each node determines its
NTT and finally the packets reach the destination D. When the destination D receives the
accumulated RREQ message, it measures the number of packets received Prec. Then it
constructs a MAC on Prec with the key shared by the sender and the destination. The RREP
contains the source and destination ids, The MAC of Prec, the accumulated route from the
RREQ, which are digitally signed by the destination. The RREP is sent towards the source on the
reverse route R1.Each intermediate node along the reverse route from D to S checks the RREP
packet to compute success ratio as,
SRi = FCni / Prec (2)
Where Prec is the number of packets received at D in time interval t1. The FCni values of ni can
be got from the corresponding NTT of the node. The success ratio value SRi is then added with
the RREP packet.
The intermediate node then verifies the digital signature of the destination node stored in the
RREP packet, is valid. If the verification fails, then the RREP packet is dropped. Otherwise, it is
signed by the intermediate node and forwarded to the next node in the reverse route. When the
source S receives the RREP packet, if first verifies that the first id of the route stored by the
RREP is its neighbor. If it is true, then it verifies all the digital signatures of the intermediate
International Journal of Computer Science and Security (IJCS), Volume (4), Issue: (3) 349](https://image.slidesharecdn.com/ijcssv4i3-110103003116-phpapp02/85/International-Journal-of-Computer-Science-and-Security-IJCSS-Volume-4-Issue-3-93-320.jpg)

![Renu Mishra, Inderpreet Kaur & Sanjeev sharma
5. CONCLUSION
In this paper, we have proposed a trust based security protocol which attains confidentiality and
authentication of packets in both routing and link layers of MANETs. It uses trust values to favor
packet forwarding by maintaining a trust counter for each node. A node is punished or rewarded
by decreasing or increasing the trust counter. If the trust counter value falls below a trust
threshold, the corresponding intermediate node is marked as malicious Although trust is widely
researched nowadays, there is not a consensus and systematic theory based on trust. The
proposed solution tries to simulate human being's social contact procedure on decision-making
and introduces it into the ad hoc networks. The perfect security solution is hard to reach. But the
average security level (for a node) can be achieved as expectation based on accumulated
knowledge and as well as the trust relationship built and adjusted. With this way, it could greatly
reduce security threats.
6. REFERENCES
FOR JOURNALS: [1] Rajneesh Kumar Gujral, anil kumar kapil, “A Trust Conscious Secure
Route Data Communication in MANETS”, International Journal of Security (IJS) Volume: 3
Issue: 1,Pages: 9 – 15, 2009
FOR CONFERENCES: [1] Charles E. Perkins, Pravin Bhagwat ”Highly dynamic Destination-
Sequenced Distance-Vector routing(DSDV) for mobile computers”, pages 234-244, In proceeding
of the SIGCOMM ’94 Conference on Communications Architectures
[2] Farooq Anjum,Dhanant Subhadrabandhu and Saswati Sarkar “Signature based Intrusion
Detection for Wireless Ad-Hoc Networks: A Comparative study of various routing protocols” in
proceedings of IEEE 58th Conference on Vehicular Technology, 2003.
[3] Rajiv k. Nekkanti, Chung-wei Lee, ”Trust Based Adaptive On Demand Ad Hoc Routing
Protocol”, ACMSE ’04, April2-3,2004, ACM 2004, pp88-93
[4] Mike Just, Evangelos Kranakis, ”Resisting Malicious Packet Dropping in Wireless Ad
Hoc Networks”, IN proceeding of ADHOC-NOW 2003,pp151-163
[5] L.Abusalah, A.Khokhar,”TARP:Trust-Aware Routing Protocol”, IWCMC’06, July 3-6, 2006,
ACM 2006, pp135-140
[6] Jigar Doshi, Prahlad Kilambi, ”SAFAR:An Adaptive Bandwidth-Efficient Routing Protocol for
Mobile Ad Hoc Networks”, Proceeding of ADHOC-NOW 2003, springer
2003, pp12-24
[7] Yan L. Sun, Wei Yu, ”Information Theoretic Framework of Trust Modeling and Evaluation for
Ad Hoc Networks”, 2006 IEEE, pp305-317
[8] Anand Patwardhan, Jim Parker, Anupam Joshi, Michaela Iorga and Tom Karygiannis “Secure
Routing and Intrusion Detection in Ad Hoc Networks” Third IEEE International Conference on
Pervasive Computing and Communications, March 2005.
[9] Li Zhao and José G. Delgado-Frias “MARS: Misbehavior Detection in Ad Hoc Networks”, in
proceedings of IEEE Conference on Global Telecommunications Conference,November 2007.
[10] Tarag Fahad and Robert Askwith “A Node Misbehaviour Detection Mechanism for Mobile
Ad-hoc Networks”, in proceedings of the 7th Annual PostGraduate Symposium on The
Convergence of Telecommunications, Networking and Broadcasting, June 2006.
[11] Chin-Yang Henry Tseng, “Distributed Intrusion Detection Models for Mobile Ad Hoc
Networks” University of California at Davis Davis, CA, USA, 2006.
[12] Bhalaji, Sivaramkrishnan, Sinchan Banerjee, Sundar, and Shanmugam, "Trust Enhanced
Dynamic Source Routing Protocol for Adhoc Networks", in proceedings of World Academy Of
Science, Engineering And Technology, Vol. 36, pp.1373-1378, December 2008
International Journal of Computer Science and Security (IJCS), Volume (4), Issue: (3) 351](https://image.slidesharecdn.com/ijcssv4i3-110103003116-phpapp02/85/International-Journal-of-Computer-Science-and-Security-IJCSS-Volume-4-Issue-3-95-320.jpg)
![M.B.Chandak, Dr.R.V.Dharaskar & Dr.V.M.Thakre
Text to Speech Synthesis with Prosody feature: Implementation
of Emotion in Speech Output using Forward Parsing
M.B.Chandak chandakmb@gmail.com
Department of Computer Science and Engineering
Shri Ramdeoababa Kamla Nehru Engineering College,
Nagpur, INDIA
Dr.R.V.Dharaskar rvdharaskar@rediffmail.com
Department of Computer Science and Engineering
G.H.Raisoni College of Engineering,
Nagpur, INDIA
Dr.V.M.Thakre thakrevm@gmail.com
Department of Computer Science and Engineering
AMRVATI UNIVERSITY,
Amravti, INDIA
Abstract
One of the key components of Text to Speech Synthesizer is prosody generator.
There are basically two types of Text to Speech Synthesizer, (i) single tone
synthesizer and (ii) multi tone synthesizer. The basic difference between two
approaches is the prosody feature. If the output of the synthesizer is required in
normal form just like human conversation, then it should be added with prosody
feature. The prosody feature allows the synthesizer to vary the pitch of the voice
so as to generate the output in the same form as if it is actually spoken or
generated by people in conversation.
The paper describes various aspects of the design and implementation of speech
synthesizer, which is capable of generating variable pitch output for the text. The
concept of forward parsing is used to find out the emotion in the text and
generate the output accordingly.
Keywords: Text to speech synthesizer, Forward Parsing, Emotion Generator, Prosody feature.
1. INTRODUCTION
Prosody is one of the key components of Speech Synthesizers, which allows implementing
complex weave of physical, phonetic effects that is being employed to express attitude,
assumptions, and attention as a parallel channel in our daily speech communication. In general
any communication is collection of two phases: Denotation, which represents written content or
spoken content and Connotation, which represent emotional and attentional effects intended by
the speaker or inferred by a listener. Prosody plays important role in guiding listener for speaker
attitude towards the message, towards the listener and towards the complete communication
event. [2,3,4]
From listener point of view, prosody consists of systematic perception and recovery of speaker
intentions based on: [3,4]
International Journal of Computer Science and Security, Volume (4): Issue (3) 352](https://image.slidesharecdn.com/ijcssv4i3-110103003116-phpapp02/85/International-Journal-of-Computer-Science-and-Security-IJCSS-Volume-4-Issue-3-96-320.jpg)
![M.B.Chandak, Dr.R.V.Dharaskar & Dr.V.M.Thakre
a) Pauses: To indicate phrases and separate the two words
b) Pitch: Rate of vocal fold cycle as function of time
c) Rate: Phoneme duration and time
d) Loudness: Relative amplitude or volume.
2. ARCHITECTURE FOR PROSODY GENERATION
The Figure 1, shows the basic architecture of prosodic generator and various elements of
prosodic generation in TTS, from pragmatic abstraction to phonetic realization. The input of the
prosody module in Figure 1; is parsed text with a phoneme string, and the output specifies the
duration of each phoneme and the pitch contour. Before providing input to the prosody generator,
the input is parsed and is converted into phonemes depending upon the key stokes involved in
the characters present in the input. The standard phonetic vocabulary of English language is
used in conversion of text to phoneme. The duration and pitch of each phoneme depends upon
the content and context of the text [6,7]. For example in the context, the mood of conversation is
happy, then pitch of the words is changed accordingly to allow listener to understand “happy”
mood of the content. Similarly, if after some time period the mood and emotion in the text are
changed, then words pronounced in voice format should be accordingly modified in pitch sense to
generate the desired effects. Prosody has an important supporting role in guiding a listener’s
recovery of the basic messages (denotation).
Figure 1: Architecture of Prosody Generator.
The various modules of Prosody Generator are described in detail as follows:
1) Speaking Style: Prosody depends not only on the linguistic content of a sentence.
Different people generate different prosody for the same sentence. Even the same
person generates a different prosody depending on his or her mood. The speaking style
of the voice in Figure 1, can impart an overall tone to a communication. Examples of such
global settings include a low register, voice quality (falsetto, creaky, breathy, etc),
narrowed pitch range indicating boredom, depression, or controlled anger, as well as
more local effects, such as notable excursion of pitch, higher or lower than surrounding
syllables, for a syllable in a word chosen for special emphasis. The various parameter
which influence the speaking Style are [8,9]:
a. Character: Character, as a determining element in prosody, refers primarily to long-
term, stable, extra-linguistic properties of a speaker, such as membership in a group
and individual personality. It also includes socio-syncratic features such as a
speaker’s region and economic status, to the degree that these influence
characteristic speech patterns. In addition, idiosyncratic features such as gender,
age, speech defects, etc. affect speech, and physical status may also be a
background determiner of prosodic character. Finally, character may sometimes
International Journal of Computer Science and Security, Volume (4): Issue (3) 353](https://image.slidesharecdn.com/ijcssv4i3-110103003116-phpapp02/85/International-Journal-of-Computer-Science-and-Security-IJCSS-Volume-4-Issue-3-97-320.jpg)
![M.B.Chandak, Dr.R.V.Dharaskar & Dr.V.M.Thakre
include temporary conditions such as fatigue, inebriation, talking with mouth full, etc.
Since many of these elements have implications for both the prosodic and voice
quality of speech output, they can be very challenging to model jointly in a TTS
system. The current state of the art is insufficient to convincingly render most
combinations of the character features listed above.[5,7]
b. Emotion: Temporary emotional conditions such as amusement, anger, contempt,
grief, sympathy, suspicion, etc. have an effect on prosody. Just as a film director
explains the emotional context of a scene to her actors to motivate their most
convincing performance, so TTS systems need to provide information on the
simulated speaker’s state of mind [11,12]. These are relatively unstable properties,
somewhat independent of character as defined above. That is, one could imagine a
speaker with any combination of social/dialect/gender/age characteristics being in
any of a number of emotional states that have been found to have prosodic
correlates, such as anger, grief, happiness, etc. Emotion in speech is actually an
important area for future research. A large number of high-level factors go into
determining emotional effects in speech. Among these are point of view (can the
listener interpret what the speaker is really spontaneous vs. symbolic (e.g., acted
emotion vs. real feeling); culture-specific vs. universal; basic emotions and
compositional emotions that combine basic feelings and effects; and strength or
intensity of emotion. We can draw a few preliminary conclusions from existing
research on emotion in speech.
Some basic emotions that have been studied in speech include:
a) Anger, though well studied in the literature, may be too broad a category for coherent
analysis. One could imagine a threatening kind of anger with a tightly controlled F0, low
in the range and near monotone; while a more overtly expressive type of tantrum could
be correlated with a wide, raised pitch range [7].
b) Joy is generally correlated with increase in pitch and pitch range, with increase in speech
rate. Smiling generally raises F0 and formant frequencies and can be well identified by
untrained listeners.
c) Sadness generally has normal or lower than normal pitch realized in a narrow range,
with a slow rate and tempo. It may also be characterized by slurred pronunciation and
irregular rhythm.
d) Fear is characterized by high pitch in a wide range, variable rate, precise pronunciation,
and irregular voicing (perhaps due to disturbed respiratory pattern).
2) SYMBOLIC PROSODY
It deals with two major factors:
a) Breaking the sentence into prosodic phrases, possibly separated by pauses, and
b) Assigning labels, such as emphasis, to different syllables or words within each
prosodic phrase [2,3].
Words are normally spoken continuously, unless there are specific linguistic reasons to
signal a discontinuity. The term juncture refers to prosodic phrasing—that is, where do
words cohere, and where do prosodic breaks (pauses and/or special pitch movements)
occur.
The primary phonetic means of signaling juncture are:
i. Silence insertion.
ii. Characteristic pitch movements in the phrase-final syllable.
iii. Lengthening of a few phones in the phrase-final syllable.
iv. Irregular voice quality such as vocal fry
The block diagram of the pitch generator decomposed in Symbolic and phonetic prosody
is as shown in the Figure 2.
International Journal of Computer Science and Security, Volume (4): Issue (3) 354](https://image.slidesharecdn.com/ijcssv4i3-110103003116-phpapp02/85/International-Journal-of-Computer-Science-and-Security-IJCSS-Volume-4-Issue-3-98-320.jpg)
![M.B.Chandak, Dr.R.V.Dharaskar & Dr.V.M.Thakre
Figure 2: Pitch generator decomposed into Symbolic and phonetic prosody.
The various components are described in detailed in the following discussion.
1. Pause:
The main aim to insert pause in running text is to structure the information which is
generated in the form of voice output. In typical systems, the reliable location which
indicates the insertion of pause is pronunciation symbols [5].
In predicting pauses it is necessary to consider their occurrence and their duration, the
simple presence or absence of a silence (of greater than 30 ms) is the most significant
decision, and its exact duration is secondary, based partially on the current rate setting
and other extraneous factors.
The goal of a TTS system should be to avoid placing pauses anywhere that might lead to
ambiguity, misinterpretation, or complete breakdown of understanding. Fortunately, most
decent writing (apart from email) incorporates punctuation according to exactly this
metric: no need to punctuate after every word, just where it aids interpretation
2. Prosodic Phrases:
Based on punctuation symbols present in the text, commercial TTS systems are using
the simple rules to vary the pitch of text depending on the prosodic phrases, for example
if in the text comma symbol appears the next word will be in the slightly higher pitch than
the current pitch [11].
The tone of particular utterance is set by using standard indices called as ToBI (Tone and
Break Indices). These are standard for transcribing symbolic intonation of American
English utterances, and can be adapted to other languages as well.
The Break Indices part of ToBI specifies an inventory of numbers expressing the strength
of a prosodic juncture. The Break Indices are marked for any utterance on their own
discrete break index tier (or layer of information), with the BI notations aligned in time with
a representation of the speech phonetics and pitch track. On the break index tier, the
prosodic association of words in an utterance is shown by labeling the end of each word
International Journal of Computer Science and Security, Volume (4): Issue (3) 355](https://image.slidesharecdn.com/ijcssv4i3-110103003116-phpapp02/85/International-Journal-of-Computer-Science-and-Security-IJCSS-Volume-4-Issue-3-99-320.jpg)
![M.B.Chandak, Dr.R.V.Dharaskar & Dr.V.M.Thakre
for the subjective strength of its association with the next word, on a scale from 0
(strongest perceived conjoining) to 4 (most disjoint), defined as follows: [5]
3. PROSODIC TRANSCRIPTION SYSTEM
This system is used to introduce the prosodic parameters to the tones used to generate the voice
output. The system is so designed that it is capable of handling both qualitative and quantitative
aspect of tones by generating necessary “curve” structure. The curve represents the final pitch
used to tone the particular word. The tone is determined by calculating “TILT”. Following
parameters are used to calculate “TILT” [11,12]
starting f0 value (Hz)
duration
amplitude of rise (Arise, in Hz)
amplitude of fall (Afall, in Hz)
starting point, time aligned with the signal and with the vowel onset
The tone shape, mathematically represented by its tilt, is a value computed directly from the f0
curve by the following formula:
The label schemes for the syllable to calculate the TILT is as shown in the table. These labels
identify the specific syllable and alter the tone based on the presence of the syllable.
Sil Silence / Pause
C Connection
A Major Pitch accent
Fb Falling boundary
Rb Rising boundary
Aft After falling boundary
Arb Accent + Rising boundary
M Minor accent
Mfb Minor accent + Falling boundary
Mrb Minor accent + Rising boundary
L Level accent
Lrb Level accent + Rising boundary
Lfb Level accent + Falling boundary
The likely syllable for “TILT” analysis in the contour can be automatically detected based on high
energy and relatively extreme F0 values or movements.
4. DURATION ASSIGNMENT
There are various factors which influence the phoneme durations. The common factors are
a. Semantic and Pragmatic Conditions
b. Speech rate relative to speaker intent, mood and emotion
c. The use of duration or rhythm to possibly signal document structure above the level of
phrase or sentence [5]
d. The lack of a consistent and coherent practical definition of the phone such that
boundaries can be clearly located for measurement
One of the commonly used methods for Duration Assignment is called as Rule based method.
This method uses table lookup for minimum and inherent duration for every phone type. The
duration is rate dependent, so all phones can be globally scaled in their minimum duration for
faster or slower rates. The inherent duration is raw material and using the specified rules, it may
be stretched or contracted by pre-specified percentage attached to each rule type as specified
and then it is finally added back to the minimum duration to yield a millisecond time for a given
phone.
International Journal of Computer Science and Security, Volume (4): Issue (3) 356](https://image.slidesharecdn.com/ijcssv4i3-110103003116-phpapp02/85/International-Journal-of-Computer-Science-and-Security-IJCSS-Volume-4-Issue-3-100-320.jpg)

![M.B.Chandak, Dr.R.V.Dharaskar & Dr.V.M.Thakre
commercial available TTS are based on regular parsing in which the emotion present in the text is
generated at the same time when the text is converted and represented in the voice form to the
user. This approach followed in current text to speech synthesizers, generates delay, and
reduces naturalness of the speech. [12]
The basic requirement of the system is emotion present within the text should be known before
hand so that it can be used to alter the pitch of the words present in the text. This will remove the
delay component as well as the voice generated will be similar to natural voice. For example if the
text is consist of three paragraphs, then, when the first paragraph is presented to user in voice
format, scanning of next two paragraphs is performed, and emotion present in the paragraphs is
derived. This emotion is then used as pitch alteration component and will act as intensifier. The
intensifier may be high, low or neutral. The value of intensifier then can be used to alter the pitch
of the text present. To handle first paragraph, the pre-processing phase is performed on first
paragraph, this pre-processing will scan the first paragraph and generates the emotion present
within the first paragraph.
6.2: Architecture for implementing Forward Parsing
The block diagram for implementing forward parsing is as shown in the figure.
Figure 3: Architecture for Forward Parsing
As shown in the figure 3, a Database is maintained, which contains the keywords and category of
emotion to which it belongs. Following types of emotions are handled using the architecture.
Anger, Joy, Surprise, Disgust, Contempt, Pride, Depression, Funny, Sorry, Boredom, Suffering,
Shame
The text is scanned and keywords present in the text are compared with the contents of
database. The comparison will finalize the value of emotion. Once the type of emotion is fixed the
information is supplied to the composer, which then composes the wave file based on value of
emotion. The value of emotion is changed based on intensity of emotion in the text. For example
if the text is
I am happy: Then the intensity of emotion happy is normal and will be represented by <+>
I am very happy: Then the intensity is increase and will be represented by <++>
This methodology will help in varying the pitch of the keyword “happy”.
6.3: Prosodic Markup Language
To incorporate the emotion component in the text and allow the synthesizer to determine the
intensity of the particular word in the text following tags are designed and the text is modified
For prosodic processing, text may be marked with tags that have scope, in the general fashion of
XML. Some examples of the form and function of a few common TTS tags for prosodic
International Journal of Computer Science and Security, Volume (4): Issue (3) 358](https://image.slidesharecdn.com/ijcssv4i3-110103003116-phpapp02/85/International-Journal-of-Computer-Science-and-Security-IJCSS-Volume-4-Issue-3-102-320.jpg)
![M.B.Chandak, Dr.R.V.Dharaskar & Dr.V.M.Thakre
processing are discussed below. Other tags can be added by intermediate subcomponents to
indicate variables such as accents and tones [10].
a. Pause or Break: These commands can accept absolute duration of silence in millisecond
or relative duration of silence like large, medium or small. For example, a “,” (comma) in
text may allow to pause for some duration and then continue the next part of text.
b. Rate: This parameter controls the speed of output. The usual measurement is words per
minute, which can be a bit vague, since words are of very different durations. However,
this metric is familiar to many TTS users and works reasonably well in practice.
c. Baseline Pitch: This parameter specifies the desired average pitch: a level around
which, or up from which, pitch is to fluctuate.
d. Pitch Range: It specifies within what bounds around the baseline pitch level line the pitch
of output voice is to fluctuate.
e. Pitch: This parameter commands can override the system’s default prosody, giving an
application or document author greater control. Generally, TTS engines require some
freedom to express their typical pitch patterns within the broad limits specified by a Pitch
markup.
f. Emphasis: This parameter emphasizes or deemphasizes one or more words, signaling
their relative importance in an utterance. Its scope could be indicated by XML style tag.
Control over emphasis brings up a number of interesting considerations. For one thing, it
may be desirable to have degrees of emphasis [11]. The notion of gradient prominence—
the apparent fact that there are no categorical constraints on levels of relative emphasis
or accentuation—has been a perpetual thorn in the side for prosodic researchers. This
means that in principle any positive real number could be used as an argument to this
tag. In practice, most TTS engines would artificially constrain the range of emphasis to a
smaller set of integers, or perhaps use semantic labels, such as strong, moderate, weak,
none for degree of emphasis [15].
7. RESULTS AND DISCUSSION
In this paper, we have presented a high-quality English text-to-speech system. The system can
transfer English text into natural speech based on part-of-speech analysis, prosodic modeling and
non-uniform units. These technologies significantly improve the naturalness and quality of the
TTS system. The system is also modularized for easily incorporating to many applications with
speech output.
The TTS designed is tested with 10 different set of documents, the output generated is compared
with standard TTS commercially available. Following results are noted after performing the test.
a. The TTS designed is more precisely determining the emotions in the text scanned and
converted into voice format.
b. The TTS designed is capable of shifting the emotions from one state to another with
smooth transition, which can be noted while listening to the output generated.
c. The matrix of emotions is generated for both TTS designed and standard commercially
available TTS and it is found that the emotion recognized by TTS designed are on the
higher side.
d. Experimental results demonstrated that the intended emotions were perceived from the
synthesized speech, especially “anger”, “surprise”, “disgust”, ‘sorrow”, “boredom”, “depression”,
and “joy”. Future work includes incorporating voice quality in addition to prosody, compensating
the duration of phonemes, and applying the proposed framework to other context factors.[11,12]
8. REFERENCEES
[1] Bender, O., S. Hasan, D. Vilar, R. Zens, and H. Ney. 2005. Comparison of generation
strategies for interactive machine translation. In Proceedings of the 10th Annual Conference of the
European Association for Machine Translation (EAMT05), pages 33–40, Budapest
International Journal of Computer Science and Security, Volume (4): Issue (3) 359](https://image.slidesharecdn.com/ijcssv4i3-110103003116-phpapp02/85/International-Journal-of-Computer-Science-and-Security-IJCSS-Volume-4-Issue-3-103-320.jpg)
![M.B.Chandak, Dr.R.V.Dharaskar & Dr.V.M.Thakre
[2] Casacuberta, F. and E. Vidal. 2007. Learning finite-state models for machine translation.
Machine Learning, 66(1):69–91.
[3] Tom´as, J. and F. Casacuberta. 2006. Statistical phrase-based models for interactive
computer-assisted translation. In Proceedings of the 44th Annual Meeting of the Association for
Computational Linguistics and 21th International Conference on Computational Linguistics
(COLING/ACL 06), pages 835–841, Sydney.
[4] I. Titov and R. McDonald. 2008. A Joint Model of Text and Aspect Ratings for Sentiment
Summarization. ACL-2008
[5] Allen, J., M.S. Hunnicutt, and D.H. Klatt, From Text to Speech: the MITalk System, 2007,
Cambridge, UK, University Press.
[6] J. Wiebe, and T. Wilson. 2002. Learning to Disambiguate Potentially Subjective Expressions.
CoNLL-2002.
[7] F. Casacuberta et al. Some approaches to statistical and finite-state speech-to-speech
translation. Computer Speech and Language,18:25–47, 2004.
[8] D. Jurafsky and J. H. Martin. Speech and Language Processing: An Introduction to Natural
Language Processing, Computational Linguistics, and Speech Recognition. Prentice Hall PTR,
Upper Saddle River, NJ, USA, 2000
[9] Fangzhong Su and Katja Markert. 2008. From word to sense: a case study of subjectivity
recognition. In Proceedings of the 22nd International Conference on Computational Linguistics,
Manchester
[10] Andrea Esuli and Fabrizio Sebastiani. 2007. PageRanking wordnet synsets: An application to
opinion mining.In Proceedings of the 45th Annual Meeting of the Association of Computational
Linguistics, pages 424–431, Prague, Czech Republic, June
[11] Hong Yu and Vasileios Hatzivassiloglou. 2003. Towards answering opinion questions:
Separating facts from opinions and identifying the polarity of opinion sentences. In Conference on
Empirical Methods in Natural Language Processing , pages 129–136, Sapporo,Japan.
[12] B. Pang and L. Lee. 2004. A sentimental education: Sentiment analysis using subjectivity
summarization based on minimum cuts. In (ACL-04), pages 271–278, Barcelona, ES. Association
for Computational Linguistics
[13] Laxmi-India, Gr.Noiida, March 2010. Development of Expert Search Engine for Web
Environment. In International Journal for Computer Science and Security, pages 130-135, Vol 4.
Issue 1, CSC Journals, Malaysia.
[14] J. Yuan, J. Brenier, and D. Jurafsky, “Pitch accent prediction: Effects of genre and speaker,”
in Proc. Interspeech 2005, Lisbon, Portugal, 2005.
[15] V. Strom, R. Clark, and S. King, “Expressive prosody for unit-selection speech synthesis,” in
Proc. Interspeech, Pittsburgh, 2006.
International Journal of Computer Science and Security, Volume (4): Issue (3) 360](https://image.slidesharecdn.com/ijcssv4i3-110103003116-phpapp02/85/International-Journal-of-Computer-Science-and-Security-IJCSS-Volume-4-Issue-3-104-320.jpg)


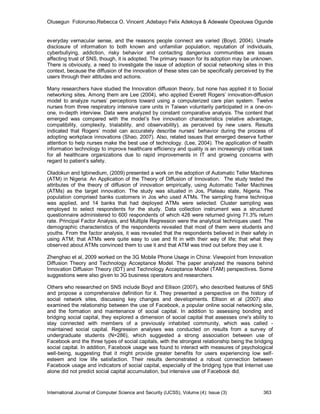


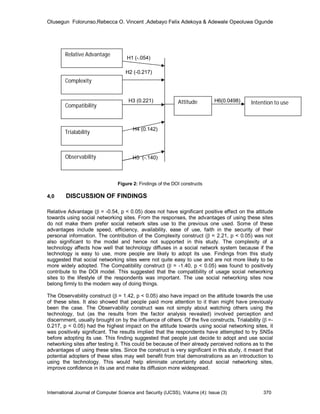


International Journal of Computer Science and Security (IJCSS) Volume (4) Issue (3)
- 2. International Journal of Computer Science and Security (IJCSS) Volume 4, Issue 3, 2010 Edited By Computer Science Journals www.cscjournals.org
- 3. Editor in Chief Dr. Haralambos Mouratidis International Journal of Computer Science and Security (IJCSS) Book: 2010 Volume 4, Issue 3 Publishing Date: 31-07-2010 Proceedings ISSN (Online): 1985-1553 This work is subjected to copyright. All rights are reserved whether the whole or part of the material is concerned, specifically the rights of translation, reprinting, re-use of illusions, recitation, broadcasting, reproduction on microfilms or in any other way, and storage in data banks. Duplication of this publication of parts thereof is permitted only under the provision of the copyright law 1965, in its current version, and permission of use must always be obtained from CSC Publishers. Violations are liable to prosecution under the copyright law. IJCSS Journal is a part of CSC Publishers http://www.cscjournals.org © IJCSS Journal Published in Malaysia Typesetting: Camera-ready by author, data conversation by CSC Publishing Services – CSC Journals, Malaysia CSC Publishers
- 4. Editorial Preface This is third issue of volume four of the International Journal of Computer Science and Security (IJCSS). IJCSS is an International refereed journal for publication of current research in computer science and computer security technologies. IJCSS publishes research papers dealing primarily with the technological aspects of computer science in general and computer security in particular. Publications of IJCSS are beneficial for researchers, academics, scholars, advanced students, practitioners, and those seeking an update on current experience, state of the art research theories and future prospects in relation to computer science in general but specific to computer security studies. Some important topics cover by IJCSS are databases, electronic commerce, multimedia, bioinformatics, signal processing, image processing, access control, computer security, cryptography, communications and data security, etc. This journal publishes new dissertations and state of the art research to target its readership that not only includes researchers, industrialists and scientist but also advanced students and practitioners. The aim of IJCSS is to publish research which is not only technically proficient, but contains innovation or information for our international readers. In order to position IJCSS as one of the top International journal in computer science and security, a group of highly valuable and senior International scholars are serving its Editorial Board who ensures that each issue must publish qualitative research articles from International research communities relevant to Computer science and security fields. IJCSS editors understand that how much it is important for authors and researchers to have their work published with a minimum delay after submission of their papers. They also strongly believe that the direct communication between the editors and authors are important for the welfare, quality and wellbeing of the Journal and its readers. Therefore, all activities from paper submission to paper publication are controlled through electronic systems that include electronic submission, editorial panel and review system that ensures rapid decision with least delays in the publication processes. To build its international reputation, we are disseminating the publication information through Google Books, Google Scholar, Directory of Open Access Journals (DOAJ), Open J Gate, ScientificCommons, Docstoc and many more. Our International Editors are working on establishing ISI listing and a good impact factor for IJCSS. We would like to remind you that the success of our journal depends directly on the number of quality articles submitted for review. Accordingly, we would like to request your participation by submitting quality manuscripts for review and encouraging your colleagues to submit quality manuscripts for review. One of the great benefits we can provide to our prospective authors is the mentoring nature of our review
- 5. process. IJCSS provides authors with high quality, helpful reviews that are shaped to assist authors in improving their manuscripts. Editorial Board Members International Journal of Computer Science & Security (IJCSS)
- 6. Editorial Board Editor-in-Chief (EiC) Dr. Haralambos Mouratidis University of East London (United Kingdom) Associate Editors (AEiCs) Professor. Nora Erika Sanchez Velazquez The Instituto Tecnológico de Estudios Superiores de Monterrey (Mexico) Associate Professor. Eduardo Fernández University of Castilla-La Mancha (Spain) Dr. Padmaraj M. V. nair Fujitsu’s Network Communication division in Richardson, Texas (United States of America) Dr. Blessing Foluso Adeoye University of Lagos (Nigeria) Dr. Theo Tryfonas University of Bristol (United Kindom) Associate Professor. Azween Bin Abdullah Universiti Teknologi Petronas (Malaysia) Editorial Board Members (EBMs) Dr. Alfonso Rodriguez University of Bio-Bio (Chile) Dr. Srinivasan Alavandhar Glasgow Caledonian University (United Kindom) Dr. Debotosh Bhattacharjee Jadavpur University (India) Professor. Abdel-Badeeh M. Salem Ain Shams University (Egyptian) Dr. Teng li Lynn University of Hong Kong (Hong Kong) Dr. Chiranjeev Kumar Indian School of Mines University (India) Professor. Sellappan Palaniappan Malaysia University of Science and Technology (Malaysia) Dr. Ghossoon M. Waleed University Malaysia Perlis (Malaysia) Dr. Srinivasan Alavandhar Caledonian University (Oman) Dr. Deepak Laxmi Narasimha University of Malaya (Malaysia) Professor. Arun Sharma Amity University (India)
- 7. Table of Content Volume 4, Issue 3, July 2010. Pages 265 - 274 Different Types of Attacks on Integrated MANET-Internet Communication Abhay Kumar Rai, Rajiv Ranjan Tewari, Saurabh Kant Upadhyay 275 - 284 A Robust Approach to Detect and Prevent Network Layer Attacks in MANETS G. S. Mamatha, S. C. Sharma 285 - 294 Design Network Intrusion Detection System using hybrid Fuzzy- Neural Network Muna Mhammad T.Jawhar, Monica Mehrotra 295 - 307 Optimization RBFNNs Parameters Using Genetic Algorithms: Applied on Function Approximation Mohammed Awad 308 - 315 Improving Seismic Monitoring System for Small to Intermediate Earthquake Detection V. Joevivek, N. Chandrasekar, Y. Srinivas International Journal of Computer Science and Security (IJCSS), Volume (4), Issue (3)
- 8. 316 - 330 A Self-Deployment Obstacle Avoidance (SOA)Algorithm for Mobile Sensor Networks Bryan Sarazin, Syed S. Rizvi 331 - 345 Online Registration System Ala'a M. Al-Shaikh 346 - 351 New trust based security method for mobile ad-hoc networks Renu Mishra, Inderpreet Kaur, Sanjeev Sharma 352-360 Text to Speech Synthesis with Prosody feature: Implementation of Emotion in Speech Output using Forward Parsing M.B.Chandak, Dr.R.V.Dharaskar, Dr.V.M.Thakre 361 – 372 Diffusion of Innovation in Social Networking Sites among University Students Olusegun Folorunso, Rebecca O. Vincent , Adebayo Felix Adekoya, Adewale Opeoluwa Ogunde International Journal of Computer Science and Security (IJCSS), Volume (4), Issue (3)
- 9. Abhay Kumar Rai, Rajiv Ranjan Tewari & Saurabh Kant Upadhyay Different Types of Attacks on Integrated MANET-Internet Communication Abhay Kumar Rai [email protected] Department of Electronics & Communication University of Allahabad Allahabad, 211002, India Rajiv Ranjan Tewari [email protected] Department of Electronics & Communication University of Allahabad Allahabad, 211002, India Saurabh Kant Upadhyay [email protected] Department of Electronics & Communication University of Allahabad Allahabad, 211002, India Abstract Security is an important issue in the integrated MANET-Internet environment because in this environment we have to consider the attacks on Internet connectivity and also on the ad hoc routing protocols. The focus of this work is on different types of attacks on integrated MANET-Internet communication. We consider most common types of attacks on mobile ad hoc networks and on access point through which MANET is connected to the Internet. Specifically, we study how different attacks affect the performance of the network and find out the security issues which have not solved until now. The results enable us to minimize the attacks on integrated MANET-Internet communication efficiently. Keywords: Ad hoc networks, Home agent, Foreign agent, Security threats. 1. INTRODUCTION Mobile ad hoc network has been a challenging research area for the last few years because of its dynamic topology, power constraints, limited range of each mobile host’s wireless transmissions and security issues etc. If we consider only a stand-alone MANET then it has limited applications, because the connectivity is limited to itself. MANET user can have better utilization of network resources only when it is connected to the Internet. But, global connectivity adds new security threats to the existing active and passive attacks on MANET. Because we have to consider the attacks on access point also through which MANET is connected to Internet. In the integrated MANET-Internet communication, a connection could be disrupted either by attacks on the Internet connectivity or by attacks on the ad hoc routing protocols. Due to this reason, almost all possible attacks on the traditional ad hoc networks also exist in the integrated wired and mobile ad hoc networks. Whatever the attacks are, the attackers will exhibit their actions in the form of refusal to participate fully and correctly in routing protocol according to the principles of integrity, authentication, confidentiality and cooperation. Hence to design a robust framework for integrated MANET-Internet communication we have to minimize attacks on the internet connectivity and also on the ad hoc routing protocols. International Journal of Computer Science and Security (IJCSS) Volume (4): Issue (3) 265
- 10. Abhay Kumar Rai, Rajiv Ranjan Tewari & Saurabh Kant Upadhyay The rest of the paper is organized as follows. Section 2 explores the related work in the area of attacks on MANET- Internet communication and stand alone MANET. Section 3 represents a detailed description of different types of attacks on integrated MANET- Internet communication. In this section we consider most common types of attacks on mobile ad hoc networks and on access point through which MANET is connected to the Internet. Specifically, we study how different attacks affect the performance of the network. We also discuss some secure routing protocols for integrated MANET- Internet communication and find out the security issues which have not solved until now. Finally section 4 is about conclusions and future work. 2. RELATED WORK In this section we explore related work on security challenges in integrated MANET-Internet and stand alone MANET. The attacks on stand alone MANET and MANET-Internet communication have been normally studied separately in the past literature. [1, 2] have considered only the attacks on stand alone MANET. [3, 4] have proposed the frameworks to provide security from different types of attacks on MANET but they have considered only the attacks on the stand alone MANET. Xie and Kumar [5] and Kandikattu and Jacob [6] have considered both types of attacks (on MANET- Internet and on stand alone MANET communication) but their proposed routing protocols have considered them separately. 3. ATTACKS ON MANET-INTERNET COMMUNICATION An integrated Internet and mobile ad hoc network can be subject to many types of attacks. These attacks can be classified into two categories, attacks on Internet connectivity and attacks on mobile ad hoc networks. 3.1 Attacks on Internet Connectivity Attacks on Internet connectivity can be classified into following categories: 3.1.1 Bogus Registration A bogus registration is an active attack in which an attacker does a registration with a bogus care-of- address by masquerading itself as some one else. By advertising fraudulent beacons, an attacker might be able to attract a MN (mobile node) to register with the attacker as if MN has reached HA (home agent) or FA (foreign agent). Now, the attacker can capture sensitive personal or network data for the purpose of accessing network and may disrupt the proper functioning of network. It is difficult for an attacker to implement such type of attack because the attacker must have detailed information about the agent. 3.1.2 Replay Attack A replay attack is a form of network attack in which a valid data transmission is maliciously or fraudulently repeated or delayed. This is carried out either by the originator or by an adversary who intercepts the data and retransmits it. Suppose any mobile node A wants to prove its identity to B. B requests his password as proof of identity, which A dutifully provides (possibly after some transformation like a hash function); at the same time, C is eavesdropping the conversation and keeps the password. After the interchange is over, C connects to B presenting itself as A; when asked for a proof of identity, C sends A's password read from the last session, which B accepts. Now, it may ruin the proper operation of the network. 3.1.3 Forged FA It is a form of network attack in which a node advertises itself as a fraudulent FA then MN’s under the coverage of the forged FA may register with it. Now, forged FA can capture the sensitive network data and may disrupt the proper functioning of the network. In general, attacks on Internet connectivity are caused by malicious nodes that may modify, drop or generate messages related to mobile IP such as advertisement, registration request or reply to disrupt the global Internet connectivity. International Journal of Computer Science and Security (IJCSS) Volume (4): Issue (3) 266
- 11. Abhay Kumar Rai, Rajiv Ranjan Tewari & Saurabh Kant Upadhyay Bin Xie and Anup Kumar [5] have proposed a secure routing protocol for integrated MANET-Internet communication. It achieves the goals of preventing the attacks from malicious nodes. If a node counterfeits a registration by inventing a non-existent address, its registration will fail at HA while HA validates the secret key of the malicious node. It prevents attacks due to bogus registration requests, replay attacks caused by malicious nodes, preventing the attacks of advertising fraudulent beacons by a counterfeit agent and preventing the attacks using old registration messages by a malicious node. But the proposed protocol uses digital signature based hop by hop authentication in route discovery which floods the route request in entire network. Hence every node in the network gets involved in the signature generation and verification process which consumes a lot of node’s resources. Ramanarayana & Jacob [6] have proposed a protocol named as secure global dynamic source routing protocol (SGDSR) in which the mutual authentication of MN, FA and HA is carried out with the help of public key and shared key cryptography techniques. It uses light weight hash codes for sign generation and verification, which greatly reduces the computational load as well as processing delay at each node without compromising security. But it also uses public key cryptography partly in the mutual authentication of MN, FA and HA which increases computational overhead. K. Ramanarayana and Lillykutty Jacob [7] have proposed a light weight solution for secure routing in integrated MANET-Internet communication named as IGAODV (IBC-based secure global AODV). The secure registration process adopted in this protocol supports mutual authentication of MN, FA and HA with help of identity based cryptography techniques. All the registration messages contain time stamp to avoid replay attacks and signature to protect the message from modification attacks and to ensure that the message is originated by an authorized party. Registration process builds trust among MN, HA and FA and ensures that they are communicating with authorized nodes and not with any fraudulent node. But it does not prevent from many internal attacks. Vaidya, Pyun and Nak-Yong Ko [8] have proposed a secure framework for integrated multipath MANET with Internet. In this scheme a secret key between mobile node and home agent is shared between them for authentication purpose. Therefore, it is not possible for an attacker to obtain the secret key SMN-HA, so it has no knowledge of session key. Since session key is frequently changed so this will prevent guessing attack. The temporary session key that is distributed by the HA can be used to encrypt the communications data. This provides the data confidentiality between the FA and MN over the air. To achieve a high level of security, it is designed that a node only accepts messages from verified one hop neighbors. The proposed protocol provides a secure framework for global connectivity with multipath MANET but it does not prevent many internal attacks. 3.2 Attacks on Mobile Ad hoc Networks Attacks on mobile ad hoc networks can be classified into following two categories: 3.2.1 Passive Attacks A passive attack does not disrupt proper operation of the network. The attacker snoops the data exchanged in the network without altering it. Here, the requirement of confidentiality can be violated if an attacker is also able to interpret the data gathered through snooping. Detection of passive attacks is very difficult since the operation of the network itself does not get affected. One way of preventing such problems is to use powerful encryption mechanisms to encrypt the data being transmitted, thereby making it impossible for eavesdroppers to obtain any useful information from the data overheard. There is an attack which is specific to the passive attack a brief description about it is given below: 3.2.1.1 Snooping Snooping is unauthorized access to another person's data. It is similar to eavesdropping but is not necessarily limited to gaining access to data during its transmission. Snooping can include casual observance of an e-mail that appears on another's computer screen or watching what someone else is typing. More sophisticated snooping uses software programs to remotely monitor activity on a computer or network device. Malicious hackers (crackers) frequently use snooping techniques to monitor key strokes, capture passwords and login information and to intercept e-mail and other private communications and data International Journal of Computer Science and Security (IJCSS) Volume (4): Issue (3) 267
- 12. Abhay Kumar Rai, Rajiv Ranjan Tewari & Saurabh Kant Upadhyay transmissions. Corporations sometimes snoop on employees legitimately to monitor their use of business computers and track Internet usage. Governments may snoop on individuals to collect information and prevent crime and terrorism. Although snooping has a negative aspect in general but in computer technology snooping can refer to any program or utility that performs a monitoring function. For example, a snoop server is used to capture network traffic for analysis, and the snooping protocol monitors information on a computer bus to ensure efficient processing. 3.2.2 Active Attacks An active attack attempts to alter or destroy the data being exchanged in the network, thereby disrupting the normal functioning of the network. It can be classified into two categories external attacks and internal attacks. External attacks are carried out by nodes that do not belong to the network. These attacks can be prevented by using standard security mechanisms such as encryption techniques and firewalls. Internal attacks are carried out by compromised nodes that are actually part of the network. Since the attackers are already part of the network as authorized nodes, internal attacks are more severe and difficult to detect when compared to external attacks. Brief descriptions of active attacks are given below. 3.2.2.1 Network Layer Attacks The list of different types of attacks on network layer and their brief descriptions are given below: 3.2.2.1.1 Wormhole Attack In wormhole attack, a malicious node receives packets at one location in the network and tunnels them to another location in the network, where these packets are resent into the network. This tunnel between two colluding attackers is referred to as a wormhole. It could be established through wired link between two colluding attackers or through a single long-range wireless link. In this form of attack the attacker may create a wormhole even for packets not addressed to itself because of broadcast nature of the radio channel. For example in Fig. 1, X and Y are two malicious nodes that encapsulate data packets and falsified the route lengths. FIGURE 1: Wormhole attack Suppose node S wishes to form a route to D and initiates route discovery. When X receives a route request from S, X encapsulates the route request and tunnels it to Y through an existing data route, in this case {X --> A --> B --> C --> Y}. When Y receives the encapsulated route request for D then it will show that it had only traveled {S --> X --> Y --> D}. Neither X nor Y update the packet header. After route discovery, the destination finds two routes from S of unequal length: one is of 4 and another is of 3. If Y tunnels the route reply back to X, S would falsely consider the path to D via X is better than the path to D via A. Thus, tunneling can prevent honest intermediate nodes from correctly incrementing the metric used to measure path lengths. Though no harm is done if the wormhole is used properly for efficient relaying of packets, it puts the attacker in a powerful position compared to other nodes in the network, which the attacker could use in a manner that could compromise the security of the network. International Journal of Computer Science and Security (IJCSS) Volume (4): Issue (3) 268
- 13. Abhay Kumar Rai, Rajiv Ranjan Tewari & Saurabh Kant Upadhyay The wormhole attack is particularly dangerous for many ad hoc network routing protocols in which the nodes that hear a packet transmission directly from some node consider themselves to be in range of (and thus a neighbor of) that node. For example, when used against an on-demand routing protocols such as DSR [9], a powerful application of the wormhole attack can be mounted by tunneling each route request packet directly to the destination target node of the request. When the destination node’s neighbors hear this request packet, they will follow normal routing protocol processing to rebroadcast that copy of the request and then discard without processing all other received route request packets originating from this same route discovery. This attack thus prevents any routes other than through the wormhole from being discovered, and if the attacker is near the initiator of the route discovery. This attack can even prevent routes more than two hops long from being discovered. Possible ways for the attacker to then exploit the wormhole include discarding rather than forwarding all data packets, thereby creating a permanent Denial-of-Service attack or selectively discarding or modifying certain data packets. So, if proper mechanisms are not employed to protect the network from wormhole attacks, most of the existing routing protocols for ad hoc wireless networks may fail to find valid routes. 3.2.2.1.2 Black hole Attack In this attack, an attacker uses the routing protocol to advertise itself as having the shortest path to the node whose packets it wants to intercept. An attacker listen the requests for routes in a flooding based protocol. When the attacker receives a request for a route to the destination node, it creates a reply consisting of an extremely short route. If the malicious reply reaches the initiating node before the reply from the actual node, a fake route gets created. Once the malicious device has been able to insert itself between the communicating nodes, it is able to do anything with the packets passing between them. It can drop the packets between them to perform a denial-of-service attack, or alternatively use its place on the route as the first step in a man-in-the-middle attack. For example, in Fig. 2, source node S wants to send data packets to destination node D and initiates the route discovery process. We assume that node 2 is a malicious node and it claims that it has route to the destination whenever it receives route request packets, and immediately sends the response to node S. If the response from the node 2 reaches first to node S then node S thinks that the route discovery is complete, ignores all other reply messages and begins to send data packets to node 2. As a result, all packets through the malicious node is consumed or lost. FIGURE 2: Black hole attack 3.2.2.1.3 Byzantine Attack In this attack, a compromised intermediate node or a set of compromised intermediate nodes works in collusion and carries out attacks such as creating routing loops, forwarding packets on non-optimal paths and selectively dropping packets [10] which results in disruption or degradation of the routing services. It is hard to detect byzantine failures. The network would seem to be operating normally in the viewpoint of the nodes, though it may actually be showing Byzantine behavior. 3.2.2.1.4 Information Disclosure Any confidential information exchange must be protected during the communication process. Also, the critical data stored on nodes must be protected from unauthorized access. In ad hoc networks, such information may contain anything, e.g., the specific status details of a node, the location of nodes, private International Journal of Computer Science and Security (IJCSS) Volume (4): Issue (3) 269
- 14. Abhay Kumar Rai, Rajiv Ranjan Tewari & Saurabh Kant Upadhyay keys or secret keys, passwords, and so on. Sometimes the control data are more critical for security than the traffic data. For instance, the routing directives in packet headers such as the identity or location of the nodes can be more valuable than the application-level messages. A compromised node may leak confidential or important information to unauthorized nodes present in the network. Such information may contain information regarding the network topology, geographic location of nodes or optimal routes to authorized nodes in the network. 3.2.2.1.5 Resource Consumption Attack In this attack, an attacker tries to consume or waste away resources of other nodes present in the network. The resources that are targeted are battery power, bandwidth, and computational power, which are only limitedly available in ad hoc wireless networks. The attacks could be in the form of unnecessary requests for routes, very frequent generation of beacon packets, or forwarding of stale packets to nodes. Using up the battery power of another node by keeping that node always busy by continuously pumping packets to that node is known as a sleep deprivation attack. 3.2.2.1.6 Routing Attacks There are several attacks which can be mounted on the routing protocols and may disrupt the proper operation of the network. Brief descriptions of such attacks are given below: Routing Table Overflow: In the case of routing table overflow, the attacker creates routes to nonexistent nodes. The goal is to create enough routes to prevent new routes from being created or to overwhelm the protocol implementation. In the case of proactive routing algorithms we need to discover routing information even before it is needed, while in the case of reactive algorithms we need to find a route only when it is needed. Thus main objective of such an attack is to cause an overflow of the routing tables, which would in turn prevent the creation of entries corresponding to new routes to authorized nodes. Routing Table Poisoning: In routing table poisoning, the compromised nodes present in the networks send fictitious routing updates or modify genuine route update packets sent to other authorized nodes. Routing table poisoning may result in sub-optimal routing, congestion in portions of the network, or even make some parts of the network inaccessible. Packet Replication: In the case of packet replication, an attacker replicates stale packets. This consumes additional bandwidth and battery power resources available to the nodes and also causes unnecessary confusion in the routing process. Route Cache Poisoning: In the case of on-demand routing protocols (such as the AODV protocol [11]), each node maintains a route cache which holds information regarding routes that have become known to the node in the recent past. Similar to routing table poisoning, an adversary can also poison the route cache to achieve similar objectives. Rushing Attack: On-demand routing protocols that use duplicate suppression during the route discovery process are vulnerable to this attack [12]. An attacker which receives a route request packet from the initiating node floods the packet quickly throughout the network before other nodes which also receive the same route request packet can react. Nodes that receive the legitimate route request packets assume those packets to be duplicates of the packet already received through the attacker and hence discard those packets. Any route discovered by the source node would contain the attacker as one of the intermediate nodes. Hence, the source node would not be able to find secure routes, that is, routes that do not include the attacker. It is extremely difficult to detect such attacks in ad hoc wireless networks. 3.2.2.2 Transport Layer Attacks There is an attack which is specific to the transport layer a brief description about it is given below: 3.2.2.2.1 Session Hijacking Session hijacking is a critical error and gives an opportunity to the malicious node to behave as a legitimate system. All the communications are authenticated only at the beginning of session setup. The attacker may take the advantage of this and commit session hijacking attack. At first, he or she spoofs the IP address of target machine and determines the correct sequence number. After that he performs a DoS International Journal of Computer Science and Security (IJCSS) Volume (4): Issue (3) 270
- 15. Abhay Kumar Rai, Rajiv Ranjan Tewari & Saurabh Kant Upadhyay attack on the victim. As a result, the target system becomes unavailable for some time. The attacker now continues the session with the other system as a legitimate system. 3.2.2.3 Application Layer Attacks There is an attack that is specific to application layer and a brief description about it is given below: 3.2.2.3.1 Repudiation In simple terms, repudiation refers to the denial or attempted denial by a node involved in a communication of having participated in all or part of the communication. Example of repudiation attack is a commercial system in which a selfish person could deny conducting an operation on a credit card purchase or deny any on-line transaction Non-repudiation is one of the important requirements for a security protocol in any communication network. 3.2.2.4 Multi-layer Attacks Here we will discuss security attacks that cannot strictly be associated with any specific layer in the network protocol stack. Multi-layer attacks are those that could occur in any layer of the network protocol stack. Denial of service and impersonation are some of the common multi-layer attacks. Here we will discuss some of the multi-layer attacks in ad hoc wireless networks. 3.2.2.4.1 Denial of Service In this type of attack, an attacker attempts to prevent legitimate and authorized users from the services offered by the network. A denial of service (DoS) attack can be carried out in many ways. The classic way is to flood packets to any centralized resource present in the network so that the resource is no longer available to nodes in the network, as a result of which the network no longer operating in the manner it was designed to operate. This may lead to a failure in the delivery of guaranteed services to the end users. Due to the unique characteristics of ad hoc wireless networks, there exist many more ways to launch a DoS attack in such a network, which would not be possible in wired networks. DoS attacks can be launched against any layer in the network protocol stack [13]. On the physical and MAC layers, an adversary could employ jamming signals which disrupt the on-going transmissions on the wireless channel. On the network layer, an adversary could take part in the routing process and exploit the routing protocol to disrupt the normal functioning of the network. For example, an adversary node could participate in a session but simply drop a certain number of packets, which may lead to degradation in the QoS being offered by the network. On the higher layers, an adversary could bring down critical services such as the key management service. For example, consider the following Fig. 3. Assume a shortest path exists from S to X and C and X cannot hear each other, that nodes B and C cannot hear each other, and that M is a malicious node attempting a denial of service attack. Suppose S wishes to communicate with X and that S has an unexpired route to X in its route cache. S transmits a data packet toward X with the source route S --> A - -> B --> M --> C --> D --> X contained in the packet’s header. When M receives the packet, it can alter the source route in the packet’s header, such as deleting D from the source route. Consequently, when C receives the altered packet, it attempts to forward the packet to X. Since X cannot hear C, the transmission is unsuccessful. FIGURE 3: Denial of service attack Some of the DoS attacks are described below: Jamming: In this form of attack, the attacker initially keeps monitoring the wireless medium in order to determine the frequency at which the destination node is receiving signals from the sender. It then transmits signals on that frequency so that error-free reception at the receiver is hindered. Frequency hopping spread spectrum (FHSS) and direct sequence spread spectrum (DSSS) are two commonly used techniques that overcome jamming attacks. International Journal of Computer Science and Security (IJCSS) Volume (4): Issue (3) 271
- 16. Abhay Kumar Rai, Rajiv Ranjan Tewari & Saurabh Kant Upadhyay SYN Flooding: In this form of attack, a malicious node sends a large amount of SYN packets to a victim node, spoofing the return addresses of the SYN packets. The SYN-ACK packets are sent out from the victim right after it receives the SYN packets from the attacker and then the victim waits for the response of ACK packet. Without any response of ACK packets, the half-open data structure remains in the victim node. If the victim node stores these half-opened connections in a fixed-size table while it awaits the acknowledgement of the three-way handshake, all of these pending connections could overflow the buffer, and the victim node would not be able to accept any other legitimate attempts to open a connection. Normally there is a time-out associated with a pending connection, so the half-open connections will eventually expire and the victim node will recover. However, malicious nodes can simply continue sending packets that request new connections faster than the expiration of pending connections. Distributed DoS Attack: Distributed denial of service attack is more severe form of denial of service attack because in this attack several adversaries that are distributed throughout the network collude and prevent legitimate users from accessing the services offered by the network. 3.2.2.4.2 Impersonation In this attack, a compromised node may get access to the network management system of the network and may start changing the configuration of the system as a super-user who has special privileges. An attacker could masquerade as an authorized node using several methods. It may be possible that by chance it can guess the identity and authentication details of the authorized node or target node, or it may snoop information regarding the identity and authentication of the target node from a previous communication, or it could disable the authentication mechanism at the target node. A man-in-the-middle attack is an example of impersonation attack. Here, the attacker reads and possibly modifies messages between two end nodes without letting either of them know that they have been attacked. Suppose two nodes A and B are communicating with each other; the attacker impersonates node B with respect to node A and impersonates node A with respect to node B, exploiting the lack of third-party authentication of the communication between nodes A and B. In the protocol given by Bin Xie and Anup Kumar [5], there is a defense mechanism due to which a node cannot generate a valid route discovery message by spoofing or inventing an IP address. In the route discovery process, control messages created by a node must be signed and validated by a receiving node. Therefore the route discovery prevents anti-authenticating attacks such as creating routing loop, fabrication because no node can create and sign a packet in the name of a spoofed or invented node. Since there is no centralized administration hence MN’s can change their identities easily. But in the proposed approach, the ad hoc host’s home address is bound with their identities in ad hoc network. Therefore, it becomes difficult for any ad hoc host to masquerade itself by creating a valid address. Nonce and timestamp make a route request or route reply containing unique data to prevent duplication from a malicious node. But, it is not secured from some internal attacks like resource consumption attack, black hole attack. In the protocol given by Ramanarayana & Jacob [6], the secure registration adopted prevents impersonation, modification and fabrication attacks by any fraudulent node but gives no security from internal attacks such as black hole attack, wormhole attack and resource consumption attack. The protocol given by K. Ramanarayana and Lillykutty Jacob [7] is resistant against modification and fabrication attacks on the source route because intermediate nodes authenticate the route based on the token, which is not revealed until the exchange of route request and route reply has finished. In the route request phase end-to-end authentication avoids impersonation of source and destination nodes. End-to- end integrity in the route request phase avoids modification attacks caused by intermediate nodes. Hop- by-hop authentication in the route reply phase avoids external malicious nodes to participate in the routing protocol and avoids the attacks caused by them. But the proposed protocol is not resistant to collaborative, black hole and gray hole attacks. In the protocol proposed by Vaidya, Pyun and Nak-Yong Ko [8], modification attacks have been removed. Route request and route reply packets are signed by the source node and validated by intermediate nodes along the path. If there are altered packets, they would be subsequently discarded. Hence route request and route reply packets remain unaltered and modification attacks are prevented. Every routing International Journal of Computer Science and Security (IJCSS) Volume (4): Issue (3) 272
- 17. Abhay Kumar Rai, Rajiv Ranjan Tewari & Saurabh Kant Upadhyay message is signed by the sender and its certificate and signature are verified by the receiver. This prevents spoofing and unauthorized participation in routing, ensuring nonrepudiation. The proposed approach binds the MN’s IP address and MAC address with public key. Neighbor discovery process in this scheme assures the communication between authenticated one-hop neighbors. Since only sender can sign with its own private key hence nodes cannot spoof other nodes in route instantiation. Destination node’s certificate and signature are included in the route reply, ensuring that only the destination can respond to route discovery. Hence, it is not possible for any MN to masquerade itself by spoofing or inventing an address in route discovery. The proposed protocol provides a secure framework for global connectivity with multipath MANET and provides the security mechanism for the above discussed attacks but it does not prevent many internal attacks. 4. CONCLUSION AND FUTURE WORK We have discussed security issues related to integrated mobile ad hoc network (MANET)-Internet and stand alone MANET. The proposed mechanisms until now have solved many security issues related to integrated MANET-Internet communication but they have not solved them completely. So, we can design a security mechanism by which we can minimize or completely remove many of those attacks. In future, we will propose to design a robust framework that uses minimal public key cryptography to avoid overload on the network and uses shared key cryptography extensively to provide security. The performance analysis of the protocol shall be done using NS-2 simulation software. It is expected that it shall minimize the security attacks due to both integrated MANET-Internet and stand alone MANET. REFERENCES 1. Nishu Garg, R.P.Mahapatra. “MANET Security Issues”. IJCSNS International Journal of Computer Science and Network Security, Volume.9, No.8, 2009. 2. Hoang Lan Nguyen, Uyen Trang Nguyen. “A study of different types of attacks on multicast in mobile ad hoc networks”. Ad Hoc Networks, Volume 6, Issue 1, Pages 32-46, January 2008. 3. F. Kargl, A. Geiß, S. Schlott, M. Weber. “Secure Dynamic Source Routing”. Hawaiian International Conference on System Sciences 38 Hawaii, USA, January 2005. 4. Jihye Kim, Gene Tsudik. “SRDP: Secure route discovery for dynamic source routing in MANET’s”. Ad Hoc Networks, Volume 7, Issue 6, Pages 1097-1109, August 2009. 5. Bin Xie and Anup Kumar. “A Framework for Internet and Ad hoc Network Security”. IEEE Symposium on Computers and Communications (ISCC-2004), June 2004. 6. Ramanarayana Kandikattu and Lillykutty Jacob. “Secure Internet Connectivity for Dynamic Source Routing (DSR) based Mobile Ad hoc Networks”. International Journal of Electronics, Circuits and Systems Volume 2, October 2007. 7. K. Ramanarayana, Lillykutty Jacob. “Secure Routing in Integrated Mobile Ad hoc Network (MANET)- Internet”. Third International Workshop on Security, Privacy and Trust in Pervasive and Ubiquitous Computing, Pages 19-24, 2007. 8. Vaidya, B., Jae-Young Pyun, Sungbum Pan, Nak-Yong Ko. “Secure Framework for Integrated Multipath MANET with Internet”. International Symposium on Applications and the Internet, Pages 83 – 88, Aug. 2008. 9. David B. Johnson and David A. Maltz. “Dynamic Source Routing in Ad Hoc Wireless Networks”. In Mobile Computing, edited by Tomasz Imielinski and Hank Korth, chapter 5, pages 153–181. Kluwer Academic Publishers, 1996. International Journal of Computer Science and Security (IJCSS) Volume (4): Issue (3) 273
- 18. Abhay Kumar Rai, Rajiv Ranjan Tewari & Saurabh Kant Upadhyay 10. B. Awerbuch, D. Holmer, C. Nita Rotaru and Herbert Rubens. “An On-Demand Secure Routing Protocol Resilient to Byzantine Failures”. Proceedings of the ACM Workshop on Wireless Security 2002, Pages 21-30, September 2002. 11. C. E. Perkins and E. M. Royer. "Ad Hoc On-Demand Distance Vector Routing". Proceedings of IEEE Workshop on Mobile Computing Systems and Applications, Pages 90-100, February 1999. 12. Y. Hu, A. Perrig, and D. B. Johnson. “Rushing Attacks and Defense in Wireless Ad Hoc Network Routing Protocols”. Proceedings of the ACM Workshop on Wireless Security 2003, Pages 30-40, September 2003. 13. L. Zhou and Z. J. Haas. “Securing Ad Hoc Networks”. IEEE Network Magazine, Volume. 13, no. 6, Pages 24-30, December 1999. International Journal of Computer Science and Security (IJCSS) Volume (4): Issue (3) 274
- 19. G.S. Mamatha & S.C. Sharma A Robust Approach to Detect and Prevent Network Layer Attacks in MANETS G. S. Mamatha [email protected] Assistant Professor/ISE Department R. V. College of Engineering Bangalore, 560059, India Dr. S. C. Sharma [email protected] Vice Chancellor Tumkur University Tumkur, 572 101, India Abstract A dynamic wireless network that is formed without any pre-existing infrastructure, in which every node can act as a router is called a mobile ad hoc network (MANET). Since MANETS has not got clear cut security provisions, it is accessible to any of the authorized network users and malicious attackers. The greatest challenge for the MANETS is to come with a robust security solution even in the presence of malicious nodes, so that MANET can be protected from various routing attacks. Several countermeasures have been proposed for these routing attacks in MANETS using various cryptographic techniques. But most of these mechanisms are not considerably suitable for the resource constraints, i.e., bandwidth limitation and battery power, since they results in heavy traffic load for exchanging and verification of keys. In this paper, a new semantic security solution is provided, which suits for the different MANET constraints and also is robust in nature, since it is able to identify and prevent four routing attacks parallelly. The experimental analysis shows the identification and prevention of the four attacks parallelly I.e., packet dropping, message tampering, black hole attack and gray hole attack. Keywords: MANET, Security, Robust, Malicious nodes, Semantic security, Routing attacks 1. INTRODUCTION A MANET has got some of the important properties like self organized and rapid deployable capability; which makes it widely used in various applications like emergency operations, battlefield communications, relief scenarios, law enforcement, public meeting, virtual class rooms and other security-sensitive computing environments [1]. There are several issues in MANETS which addresses the areas such as IP addressing, radio interference, routing protocols, power Constraints, security, mobility management, bandwidth constraints, QOS, etc;. As of now some hot issues in MANETS can be related to the routing protocols, routing attacks, power and bandwidth constraints, and security, which have raised lot of interest in researchers. Even though in this paper we only focus on the routing attacks and security issue in MANETS. The MANET security can be classified in to 5 layers, as Application layer, Transport layer, Network layer, Link layer, and Physical layer. However, the focus is on the network layer, which International Journal of Computer Science and Security, Volume (4): Issue (3) 275
- 20. G.S. Mamatha & S.C. Sharma considers mainly the security issues to protect the ad hoc routing and forwarding protocols. When the security design perspective in MANETS is considered it has not got a clear line defense. Unlike wired networks that have dedicated routers, each mobile node in an ad hoc network may function as a router and forward packets for other peer nodes. The wireless channel is accessible to both legitimate network users and malicious attackers. There is no well defined place where traffic monitoring or access control mechanisms can be deployed. As a result, the boundary that separates the inside network from the outside world becomes blurred. On the other hand, the existing ad hoc routing protocols, such as (AODV (Ad Hoc on Demand Distance vector protocol)) [2] [3], (DSR (Dynamic Source Routing)) [4], and wireless MAC protocols, such as 802.11 [5], typically assume a trusted and cooperative environment. As a result, a malicious attacker can readily become a router and disrupt network operations by intentionally disobeying the protocol specifications. Recently, several research efforts introduced to counter against these malicious attacks. Most of the previous work has focused mainly on providing preventive schemes to protect the routing protocol in a MANET. Most of these schemes are based on key management or encryption techniques to prevent unauthorized nodes from joining the network. In general, the main drawback of these approaches is that they introduce a heavy traffic load to exchange and verify keys, which is very expensive in terms of the bandwidth-constraint for MANET nodes with limited battery and limited computational capabilities. The MANET protocols are facing different routing attacks, such as flooding, black hole; link withholding, link spoofing, replay, wormhole, and colluding misrelay attack. A comprehensive study of these routing attacks and countermeasures against these attacks in MANET can be found in [6] [1]. The main goal of the security requirements for MANET is to provide a security protocol, which should meet the properties like confidentiality, integrity, availability and non-repudiation to the mobile users. In order to achieve this goal, the security approach should provide overall protection that spans the entire protocol stack. But sometimes the security protocol may not be able to meet the requirements as said above and results in a packet forwarding misbehavior. That is why the approach proposed here is not coupled to any specific routing protocol and, therefore, it can operate regardless of the routing strategy used. The main criterion for identification of a malicious node is the estimated percentage of packets dropped, which is compared against a pre-established misbehavior threshold. Any other node which drops packets in excess of the pre-established misbehavior threshold is said to be misbehaving, while for those nodes percentage of dropping packets is below the threshold are said to be properly behaving. The approach proposed here identifies and prevents misbehaving nodes (malicious), which are capable of launching four routing attacks parallelly: the black hole attack, wherein a misbehaving node drops all the packets that it receives instead of normally forwarding them. A variation of this attack is the gray hole attack, in which nodes either drop packets selectively (e.g. dropping all UDP packets while forwarding TCP packets) or drop packets in a statistical manner (e.g. dropping 50% of the packets or dropping them with a probabilistic distribution). The gray hole attacks of this types will anyhow disrupt the network operation, if proper security measures are not used to detect them in place [7]. A simple eavesdropping of packets attack and message tampering attacks are also identified and prevented by the proposed approach. The proposed approach is demonstrated through a practical experiment for an appropriate selection misbehaved and well-behaved nodes using a misbehavior threshold. We tested for the robustness of the approach against fixed node mobility in a network that is affected parallelly by four attacks. The rest of this paper is organized as follows. Section II describes related work in the area of MANET security. Section III describes the proposed algorithm for packet forwarding misbehavior identification and prevention, and Section IV presents the experimental analysis and performance evaluation. Finally, the paper is concluded in Section V. International Journal of Computer Science and Security, Volume (4): Issue (3) 276
- 21. G.S. Mamatha & S.C. Sharma 2. RELATED WORK Reliable network connectivity in wireless networks is achieved if some counter measures are taken to avoid data packet forwarding against malicious attacks. A lot of research has taken place to avoid malicious attackers like, a Survey on MANET Intrusion Detection [8], Advanced Detection of Selfish or Malicious Nodes in Ad hoc Networks [9], Detecting Network Intrusions via Sampling : A Game Theoretic Approach [10], Collaborative security architecture for black hole attack prevention in mobile ad hoc networks [11], A Distributed Security Scheme for Ad Hoc Networks [6], Wormhole attacks detection in wireless ad hoc networks: a statistical analysis approach [12], Enhanced Intrusion Detection System for Discovering Malicious Nodes in Mobile Ad Hoc Networks [13], Detection and Accusation of Packet Forwarding Misbehavior in Mobile Ad- Hoc networks[7], WAP: Wormhole Attack Prevention Algorithm in Mobile Ad Hoc Networks [4], A Reliable and Secure Framework for Detection and Isolation of Malicious Nodes in MANET [14], Secure Routing Protocol with Malicious Nodes Detection for Ad Hoc Networks (ARIADNE) [15], A Cooperative Black hole Node Detection Mechanism for ADHOC Networks [5], Malicious node detection in Ad Hoc networks using timed automata [16], Addressing Collaborative Attacks and Defense in Ad Hoc Wireless Networks [17], dpraodv: a dynamic learning system against black hole attack in aodv based manet [18], and Performance Evaluation of the Impact of Attacks on Mobile Ad hoc Networks [19]. All these research work reveals that a single or to a maximum of two or three attacks identification and prevention using some approach is considered. Our solution to this research gap is to provide a semantic security scheme that considers a minimum of 4 attacks identification and prevention parallelly using a simple acknowledgement approach. The above related study justifies that, the proposed scheme is not considered anywhere and is a new security solution for network layer attacks. The reason to concentrate on network layer attacks because; as we know a MANETS network connectivity is mainly through the link-layer protocols and network-layer protocols. The Link-layer protocols are used to ensure one-hop connectivity while network-layer protocols extend this connectivity to multiple hops [2]. So only to incorporate MANETS security we can consider two possible counter measures namely, link-layer security and network-layer security. Link-layer security is to protect the one-hop connectivity between two adjacent nodes that are within each other’s communication range through secure protocols, such like the IEEE 802.11 WEP protocol [3] or the more recently proposed 802.11i/WPA protocol [20] [2]. The network-layer security mainly considers for delivering the packets between mobile nodes in a secure manner through multihop ad hoc forwarding. This ensures that the routing message exchange within the packets between nodes is consistent with the protocol specification. Even the packet forwarding of every node is consistent with its routing states. Accordingly, the protocols are broadly classified in to two categories: secure ad hoc routing protocols and secure packet forwarding protocols. The paper mainly discusses about the network-layer security. 3. PROPOSED APPROACH The routing attacks like black hole, gray hole, worm hole, rushing attack, DOS attack, flooding etc; can become hazardous to the network-layer protocol which needs to be protected. Further the malicious nodes may deny forwarding packets properly even they have found to be genuine during the routing discovery phase. A malicious node can pretend to join the routing correctly but later goes on ignoring all the packets that pass through it rather than forwarding them. This attack is called black hole, or selective forward of some packets is known as grey hole attack. The basic solution needed to resolve these types of problems is to make sure that every node in a network forwards packets to its destination properly. To ensure this kind of security to network layer in MANETS a new secure approach which uses a simple acknowledgement approach and principle of flow conservation is proposed here. As a part of this research work we have tried the same approach with AODV protocol and it has identified two of the attacks namely message tampering and packet eavesdropping. Here, in this International Journal of Computer Science and Security, Volume (4): Issue (3) 277
- 22. G.S. Mamatha & S.C. Sharma proposed work the same approach has been tested to identify more than two attacks in a network without the use of protocol. The related work in section 2 exactly reveals that there has been no approach till yet found to identify and prevent the network layer attacks parallelly. This paper mainly concentrates on this part of the research and unveils that the more than one attack can be identified and prevented parallelly independent of the protocol for routing. The design of the proposed algorithm is done based on three modules, namely the sender module, the intermediate node module and the receiver module. The approach is independent of the data forwarding protocol. To develop the proposed algorithm, a simple acknowledgement approach and principle of flow conservation have been applied. Conventions used for the algorithm development: The packet sending time by the source node will be start time. According to principle of flow conservation the limit of tolerance is set to some threshold value i.e. in this algorithm it will be 20%. The time taken for the acknowledgement to reach back the source is end time. The total time taken for transmission will be (end-start) = RTT (Round Trip Time). To count the packets sent a counter Cpkt is used. The RTT time limit is set to 20 milliseconds. When an acknowledgement that is received by the sender exceeds the 20 ms time limit, then the data packet will be accounted as a lost packet. To count the number of lost packets another counter Cmiss is used. The ratio of (Cmiss/Cpkt) is calculated. If the ratio calculated exceeds the limit of tolerance threshold value 20%, then the link is said to be misbehaving otherwise properly behaving. Parallelly using the ratio value, the corresponding attacks will be identified. The algorithm is explained as follows: The sender node module generates the front end and asks the user to enter the message. The user enters the messages or browses the file to be sent and clicks on send button. The counter Cpkt gets incremented every time a packet is sent and the time will be the start time. According to the data format only 48 bytes are sent at a time. If the message is longer than 48 bytes then it is divided into packets each of 48bytes. For maintaining intact security in the algorithm a semantic mechanism like one-way hash code generation to generate the hash code for the message is used. For generating hash code hash function is applied in the algorithm. A hash function is an algorithm that turns messages or text into a fixed string of digits, usually for security or data management purposes. The "one way" means that it's nearly impossible to derive the original text from the string. A one-way hash function is used to create digital signatures, which in turn identify and authenticate the sender and message of a digitally distributed message. The data to be encoded is often called the "message", and the hash value is sometimes called the message digest or simply digests. Sender module then prepares the data frame appending the necessary fields namely source address, destination address, hash code and data to be sent. Then the data packets will be sent to nearest intermediate nodes. On receiving the message at the intermediate node, a choice will be made available at the nodes module to alter or not to alter the data and the intermediate node behaves accordingly. Then the intermediate node finds the destination address in the data frame and forwards data to it. Once the receiver receives the message, it extracts the fields from the data frame. These extracted fields are displayed on to the front end generated by the receiver module. The receiver also computes the hash code for the message received using the same hash function that was used at the sender. The receiver compares the hash code that was extracted from the data frame with the hash code that it has generated. An accidental or intentional change to the data will change the hash value. If the hash codes match, then the acknowledgement packet sent back to the sender through the intermediate node consists of “ACK”. Else when the hash codes do not match the acknowledgement packet sent back to the sender through the intermediate node consists of “CONFIDENTIALITY LOST”. At the sender International Journal of Computer Science and Security, Volume (4): Issue (3) 278
- 23. G.S. Mamatha & S.C. Sharma node, the sender waits for the acknowledgement packet to reach. Once it receives the acknowledgement packet it computes the time taken for this acknowledgement to reach I.e. the end time. If the total transmission time taken I.e. (end-start) is more than the pre-specified interval of 20 ms, it discards the corresponding data packet and accounts it as lost data packet, thereby incrementing the Cmiss counter. Else it checks for the contents of acknowledgement field. If the ratio of (Cmiss/Cpkt)>=20%, then the intermediate node is said to be misbehaving and a new field “CONFIDENTIALITY LOST” is built in to the acknowledgement frame. In such a case, sender switches to an alternate intermediate node for the future sessions. Otherwise another new field “ACK” is built in to the acknowledgement frame. In this case the intermediate node is considered to be behaving as expected and transmission is continued with the same intermediate node. Such intermediate nodes can be called genuine nodes. Simultaneously malicious nodes are identified and prevented which launch attacks. The algorithm mainly identifies four attacks parallelly namely packet eavesdropping, message tampering, black hole attack and gray hole attack. This reason makes the algorithm more robust in nature against other approaches. Even it can also be extended to few more network layer attacks. The attacks explanation is as follows: 1.Packet eavesdropping: In mobile ad hoc networks since nodes can move arbitrarily the network topology which is typically multi hop can change frequently and unpredictably resulting in route changes, frequent network partitions and possibly packet losses. Some of the malicious nodes tend to drop packets intentionally to save their own resources and disturb the network operation. This particular attack is identified by the value of the (Cmiss/Cpkt) ratio. If (Cmiss/Cpkt)>20%, them link contains a malicious node launching packet eavesdropping attack. 2. Message tampering: The intermediate nodes sometimes don’t follow the network security principle of integrity. They will tend to tamper the data that has been sent either by deleting some bytes or by adding few bytes to it. This attack can be an intentional malicious activity by the intermediate nodes. The algorithm identifies such nodes and attack by the value of the ratio calculated for different data transmissions. If the acknowledgement frame sent by the receiver contains “CONFIDENTIALITY LOST” field in it, then the node is said to be tampered the data sent. Along with that if the ratio (Cmiss/Cpkt)>20%, then link is said to be misbehaving and message tampering attack is identified. 3. Black hole attack: In this attack a misbehaving node drops all the packets that it receives instead of normally forwarding those [2]. The routing message exchange is only one part of the network-layer protocol which needs to be protected. It is still possible that malicious nodes deny forwarding packets correctly even they have acted correctly during the routing discovery phase. For example, a malicious node can join the routing correctly but simply ignore all the packets passing through it rather than forwarding them, known as black hole attack [2] [21] [22]. In a blackhole attack, a malicious node sends fake routing information, claiming that it has an optimum route and causes other good nodes to route data packets through the malicious one. For example, in AODV, the attacker can send a fake RREP (including a fake destination sequence number that is fabricated to be equal or higher than the one contained in the RREQ) to the source node, claiming that it has a sufficiently fresh route to the destination node. This cause the source node to select the route that passes through the attacker. Therefore, all traffic will be routed through the attacker, and therefore, the attacker can misuse or discard the traffic [1]. This attack is identified if the ratio (Cmiss/Cpkt)>=1.0, then all the sent packets are said to be lost or eavesdropped by the malicious node. 4. Gray hole attack: A variation of the black hole attack is the gray hole attack [7]. This attack when launched by the intermediate nodes selectively eaves drop the packets I.e. 50% of the packets, instead of forwarding all. This attack is identified if the ratio (Cmiss/Cpkt)>0.2 and (Cmiss/Cpkt) = 0.5, then we can say half of the packets that have been sent are eaves dropped by the malicious node. International Journal of Computer Science and Security, Volume (4): Issue (3) 279
- 24. G.S. Mamatha & S.C. Sharma 4. EXPERIMENTAL ANALYSIS The proposed algorithm was practically implemented and tested in a lab terrain with 24 numbers of nodes in the network. Through the experiment analysis it is found that the algorithm exactly shows the results for four attacks parallelly namely packet eaves dropping, message tampering, black hole attack and gray hole attack. To analyze the semantic security mechanism, two laptops are connected at both the ends in between 22 numbers of intermediate nodes with WI-FI connection. The data pertaining to the lab records are, the underlying MAC protocol defined by IEEE 802.11g with a channel data rate of 2.4 GHZ. The data packet size can vary up to 512-1024 bytes. The wireless transmission range of each node is 100 meters. Traffic sources of constant bit rate (CBR) based on TCP (Transmission Control Protocol) have been used. The evaluation has been done for about 10 messages that are sent from the sender node. The messages are tabulated as MSG1 to MSG10. Based on the values calculated and comparing those with the limit values, the four attacks have been identified. Based on the ratio value and attack identification, the link status is also explained. When a link misbehaves, any of the nodes associated with the link may be misbehaving. In order to decide the behavior of a node and prevent it, we may need to check the behavior of links around that node [23].Such a solution is also provided by the proposed approach. All the transmissions will take place in few milliseconds, without consuming much of the network bandwidth, battery power and memory. The algorithm doesn’t require any special equipment to carry out the experiment. So only the approach is more economic in nature and it can be considered as more robust in nature, since it is able to identify and prevent four attacks parallelly in MANETS. The same algorithm can be extended to few more network layer attacks identification and prevention, which can be taken as the future enhancement. Further the network density can also be increased and using the proposed approach it can be tested and analyzed. Simulation can also be taken as another enhancement for the approach to consider more number of nodes and graphical analysis. The following Table 1 shows the results for the experiment conducted: (cmiss/ RTT Node Data Sent cpkt) Link Status Attack Identified (ms) Status ratio MSG1 16 0.0 Working properly Genuine nil MSG2 10 0.014 Working properly Genuine nil MSG3 10 0.014 Working properly Genuine nil Working Properly MSG4 16 0.0 but CONFIDENTI- Malicious Message tampering ALITY LOST MSG5 10.47 1.0 Misbehaving Malicious Packet dropping Packet dropping and MSG6 10.68 1.0 Misbehaving Malicious black hole attack Misbehaving and Packet dropping , MSG7 23 1.0 CONFIDENTI- Malicious black hole attack and ALITY LOST message tampering International Journal of Computer Science and Security, Volume (4): Issue (3) 280
- 25. G.S. Mamatha & S.C. Sharma Misbehaving and Packet dropping , MSG8 20 0.5 CONFIDENTI- Malicious Gray hole attack and ALITY LOST message tampering Packet dropping and MSG9 17 0.5 Misbehaving Malicious Gray hole attack Misbehaving and Packet dropping, MSG10 31 1.0 CONFIDENTI- Malicious message tampering ALITY LOST TABLE 1: Summary of Results. 4.1. Performance Analysis We have considered four of the network parameters for evaluating the performance with the proposed approach. Further it can be extended to a few more parameters based upon the network density. The algorithm can also be extended to identify and prevent few more network layer attacks. Packet delivery ratio (PDR) – the ratio of the number of packets received at the destination and the number of packets sent by the source. The PDR of the flow at any given time is calculated as, PDR = (packets received/packets sent) Routing overhead – The number of routing packets transmitted per data packet delivered at the destination. Power consumption- the power is calculated in terms of total time taken for transmission of a message from sender to receiver. Since this time elapses in milliseconds, the power consumed by anode will be considered as less. Throughput- It is sum of sizes (bits) or number (packets) of generated/sent/forwarded/received packets, calculated at every time interval and divided by its length. Throughput (bits) is shown in bits. Throughput (packets) shows numbers of packets in every time interval. Time interval length is equal to one second by default [6]. Another important fact can be considered with respect to the approach is the power consumption of the nodes in the network. When compared to other approaches, the proposed scheme presents a simple one-hop acknowledgement and one way hash chain, termed as semantic security mechanism, greatly reduces overhead in the traffic and the transmission time. The overall transmission for sending and receiving data happens in just few milliseconds, overcoming the time constraint thereby reducing power consumption. As a part of the analysis, the proposed approach which is a protocol less implementation is compared with the protocol performances like AODV and DSR. Only one network parameter I.e. throughput has been taken for comparison with increasing the number of nodes up to 24. The following Table 2 shows the three comparison values for throughput in bps and Figure 1 shows the graph of comparison results. Throughput (in bps) Number of Nodes Proposed approach AODV DSR 4 500 500 500 8 1000 750 700 12 2000 1000 1200 16 3000 2000 1900 20 4000 3000 2500 24 5000 4500 3700 TABLE 2: Throughput values for Proposed approach, AODV and DSR. International Journal of Computer Science and Security, Volume (4): Issue (3) 281
- 26. G.S. Mamatha & S.C. Sharma FIGURE 1: Graph of Comparison Results for Throughput. The graph in figure 1 clearly shows the performance of one of the network parameter, throughput for the proposed approach. As the graph indicates the throughput for both AODV and DSR protocols are calculated and tested. When compared to the proposed approach, which uses a protocol less simple acknowledgement method and one way hash chain, the protocols performance results in lesser throughput. 5. CONCLUSION AND FUTURE WORK In mobile ad hoc networks, protecting the network layer from attacks is an important research topic in wireless security. This paper describes a robust scheme for network-layer security solution in ad hoc networks, which protects both, routing and packet forwarding functionalities without the context of any data forwarding protocol. This approach tackles the issue in an efficient manner since four attacks have been identified parallelly. The overall idea of this algorithm is to detect malicious nodes launching attacks and misbehaving links to prevent them from communication network. This work explores a robust and a very simple idea, which can be implemented and tested in future for more number of attacks, by increasing the number of nodes in the network. To this end, we have presented an approach, a network-layer security solution against attacks that protects routing and forwarding operations in the network. As a potential direction for future work, we are considering measurement of more number of network parameters, to analyze the performance of such a network using the proposed approach. 6. REFERENCES [1] Rashid Hafeez Khokhar, Md Asri Ngadi and Satria Mandala. “A Review of Current Routing Attacks in Mobile Ad hoc Networks”. International Journal of Computer Science and Security, 2(3):18-29, 2008 [2] Bingwen He, Joakim Hägglund and Qing Gu. “Security in Adhoc Networks”, An essay produced for the course Secure Computer Systems HT2005 (1DT658), 2005 [3] IEEE Std. 802.11. “Wireless LAN Medium Access Control (MAC) and Physical Layer (PHY) Specifications”, 1997 International Journal of Computer Science and Security, Volume (4): Issue (3) 282
- 27. G.S. Mamatha & S.C. Sharma [4] Sun Choi, Doo-young Kim, Do-hyeon Lee and Jae-il Jung. “WAP: Wormhole Attack Prevention Algorithm In Mobile Ad Hoc Networks”, In Proceedings of International Conference on Sensor Networks, Ubiquitous, and Trustworthy Computing, Vol. 0, ISBN = 978-0-7695-3158-8, pp. 343-348, 2008 [5] Moumita Deb, “A Cooperative Black hole Node Detection Mechanism for ADHOC Networks”, Proceedings of the World Congress on Engineering and Computer Science, 2008 [6] Dhaval Gada, Rajat Gogri, Punit Rathod, Zalak Dedhia, Nirali Mody, Sugata Sanyal and Ajith Abraham. “A Distributed Security Scheme for Ad Hoc Networks”, ACM Publications, Vol-11, Issue 1, pp.5–5, 2004 [7] Oscar F. Gonzalez, God win Ansa, Michael Howarth and George Pavlou. “Detection and Accusation of Packet Forwarding Misbehavior in Mobile Ad-Hoc networks”. Journal of Internet Engineering, 2:1, 2008 [8] Satria Mandala, Md. Asri Ngadi, A.Hanan Abdullah. “A Survey on MANET Intrusion Detection”. International Journal of Computer Science and Security, 2(1):1-11, 1999 [9] Frank Kargl, Andreas Klenk, Stefan Schlott and Michael Weber. “Advanced Detection of Selfish or Malicious Nodes in Ad hoc Networks”, In Proceedings of IEEE/ACM Workshop on Mobile Ad Hoc Networking and Computing, 2002 [10] Murali Kodialam, T. V. Lakshman. “Detecting Network Intrusions via Sampling: A Game Theoretic Approach”, In Proceedings of IEEE INFOCOM, 2003 [11] Patcha, A; Mishra, A. “Collaborative security architecture for black hole attack prevention in mobile ad hoc networks”, In Proceedings of Radio and Wireless conference, RAWCON apos; 03, Vol. 10, Issue 13, pp. 75–78, Aug 2003 [12] N. Song, L. Qian and X. Li. “Wormhole attacks detection in wireless ad hoc networks: A statistical analysis approach”, In proceedings of 19th IEEE International Parallel and Distributed Processing Symposium, 2005 [13] Nasser, N, Yunfeng Chen. “Enhanced Intrusion Detection System for Discovering Malicious Nodes in Mobile Ad Hoc Networks”, In proceedings of IEEE International Conference on Communications, ICC apos; Vol-07 , Issue 24-28, pp.1154 – 1159, June 2007 [14] S.Dhanalakshmi, Dr.M.Rajaram. “A Reliable and Secure Framework for Detection and Isolation of Malicious Nodes in MANET”, IJCSNS International Journal of Computer Science and Network Security, 8(10), October 2008 [15] Chu-Hsing Lin, Wei-Shen Lai, Yen-Lin Huang and Mei-Chun Chou. “Secure Routing Protocol with Malicious Nodes Detection for Ad Hoc Networks”, In Proceedings of 22nd International Conference on Advanced Information Networking and Applications - Workshops, 2008, AINAW March 2008 [16] Yi, Ping Wu, Yue Li and Jianhua. “Malicious node detection in Ad Hoc networks using timed automata”, In Proceedings of IET Conference on Wireless, Mobile and Sensor Networks (CCWMSN07), Shangai, China, 2007 [17] Bharat Bhargava, Ruy de Oliveira, Yu Zhang and Nwokedi C. Idika. "Addressing Collaborative Attacks and Defense in Ad Hoc Wireless Networks", In Proceedings of 29th IEEE International Conference on Distributed Computing Systems Workshops, pp. 447-450, 2009 International Journal of Computer Science and Security, Volume (4): Issue (3) 283
- 28. G.S. Mamatha & S.C. Sharma [18] Payal N. Raj, Prashant B. Swadas. “DPRAODV: A Dynamic Learning System Against Blackhole Attack in AODV Based MANET”, IJCSI International Journal of Computer Science Issues, 2:54-59, 2009 [19] Malcolm Parsons, Peter Ebinger. “Performance Evaluation of the Impact of AttacksOn Mobile Ad hoc Networks”, In Proceedings of Field Failure Data Analysis Workshop September 27-30, Niagara Falls, New York, U.S.A, 2009 [20] IEEE Std. 802.11i/D30. “Wireless Medium Access Control (MAC) and Physical Layer (PHY) Specifications: Specification for Enhanced Security”, 2002 [21] S. Yi, P. Naldurg and R. Kravets. “Security-Aware Ad Hoc Routing for Wireless Networks”, In Proceedings of ACM MOBIHOC 2001, pp.299-302, October 2001 [22] H. Deng, W. Li and D. P. Agrawal. “Routing Security in Wireless Ad Hoc Networks”, IEEE Communications Magazine, 40(10):70-75, October 2002 [23] T.V.P.Sundararajan, Dr.A.Shanmugam. “Behavior Based Anomaly Detection Technique to Mitigate the Routing Misbehavior in MANET”, International Journal of Computer Science and Security, 3(2):62-75, April 2009 International Journal of Computer Science and Security, Volume (4): Issue (3) 284
- 29. Muna Mhammad T. Jawhar & Monica Mehrotra Design Network Intrusion Detection System using hybrid Fuzzy-Neural Network Muna Mhammad T. Jawhar [email protected] Faculty of Natural Science Department of computer science Jamia Millia Islamia New Delhi, 110025, India Monica Mehrotra [email protected] Faculty of Natural Science Department of computer science Jamia Millia Islamia New Delhi, 110025, India Abstract As networks grow both in importance and size, there is an increasing need for effective security monitors such as Network Intrusion Detection System to prevent such illicit accesses. Intrusion Detection Systems technology is an effective approach in dealing with the problems of network security. In this paper, we present an intrusion detection model based on hybrid fuzzy logic and neural network. The key idea is to take advantage of different classification abilities of fuzzy logic and neural network for intrusion detection system. The new model has ability to recognize an attack, to differentiate one attack from another i.e. classifying attack, and the most important, to detect new attacks with high detection rate and low false negative. Training and testing data were obtained from the Defense Advanced Research Projects Agency (DARPA) intrusion detection evaluation data set. Keywords: FCM clustering, Neural Network, Intrusion Detection. 1. INTRODUCTION With the rapid growth of the internet, computer attacks are increasing at a fast pace and can easily cause millions of dollar in damage to an organization. Detection of these attacks is an important issue of computer security. Intrusion Detection Systems (IDS) technology is an effective approach in dealing with the problems of network security. In general, the techniques for Intrusion Detection (ID) fall into two major categories depending on the modeling methods used: misuse detection and anomaly detection. Misuse detection compares the usage patterns for knowing the techniques of compromising computer security. Although misuse detection is effective against known intrusion types; it cannot detect new attacks that were not predefined. Anomaly detection, on the other hand, approaches the problem by attempting to find deviations from the established patterns of usage. Anomaly detection may be able to detect new attacks. However, it may also cause a significant number of false alarms because the normal behavior varies widely and obtaining complete description of normal behavior is often difficult. Architecturally, an intrusion detection system can be categorized into three types host based IDS, network based IDS and hybrid IDS [1][2]. A host based intrusion detection International Journal of Computer Science and Security, Volume (4): Issue (3) 285
- 30. Muna Mhammad T. Jawhar & Monica Mehrotra system uses the audit trails of the operation system as a primary data source. A network based intrusion detection system, on the other hand, uses network traffic information as its main data source. Hybrid intrusion detection system uses both methods [3]. However, most available commercial IDS's use only misuse detection because most developed anomaly detector still cannot overcome the limitations (high false positive detection errors, the difficulty of handling gradual misbehavior and expensive computation[4]). This trend motivates many research efforts to build anomaly detectors for the purpose of ID [5]. The main problem is the difficulty of distinguishing between natural behavior and abnormal behavior in computer networks due to the significant overlap in monitoring data. This detection process generates false alarms resulting from the Intrusion Detection based on the anomaly Intrusion Detection System. The use of fuzzy clustering might reduce the amount of false alarm, where fuzzy clustering is usesd to separate this overlap between normal and abnormal behavior in computer networks. This paper addresses the problem of generating application clusters from the KDD cup 1999 network intrusion detection dataset. The Neural Network and Fuzzy C-Mean (FCM) clustering algorithms were chosen to be used in building an efficient network intrusion detection model. We organize this paper as follows, section 2 review previous works, section 3 provides brief introduction about Neural Network, section 4 present fuzzy C-means clustering algorithm, section 5 explain the model designer and training Neural Network, section 6 discusses the experiments results followed by conclusion. 2. PREVIOUS WORK In particular several Neural Networks based approaches were employed for Intrusion Detection. Tie and Li [6] used the BP network with GAs for enhance of BP, they used some types of attack with some features of KDD data. The detection rate for Satan, Guess-password, and Peral was 90.97, 85.60 and 90.79 consequently. The overall accuracy of detection rate is 91.61 with false alarm rate of 7.35. Jimmy and Heidar [7] used feed-forward Neural Networks with Back Propagation training algorithm, they used some feature from TCP Dump and the classification result is 25/25. Dima, Roman and Leon[8] used MLP and Radial Based Function (RBF) Neural Network for classification of 5 types of attacks, the accuracy rate of classifying attacks is 93.2 using RBF and 92.2 using MLP Neural Network, and the false alarm is 0.8%. Iftikhar, Sami and Sajjad [9] used Resilient Back propagation for detecting each type of attack along, the accurse detection rate was 95.93. Mukkamala, Andrew, and Ajith [10] used Back Propagation Neural Network with many types of learning algorithm. The performance of the network is 95.0. The overall accuracy of classification for RPBRO is 97.04 with false positive rate of 2.76% and false negative rate of 0.20. Jimmy and Heidar[11] used Neural Network for classification of the unknown attack and the result is 76% correct classification. Vallipuram and Robert [12] used back-propagation Neural Network, they used all features of KDD data, the classification rate for experiment result for normal traffic was 100%, known attacks were 80%, and for unknown attacks were 60%. Dima, Roman, and Leon used RBF and MLP Neural Network and KDD dataset for attacks classification and the result of accuracy of classification was 93.2% using RBF Neural Network and 92.2% using MLP Neural Network. 3. NEURAL NETWORK Neural Networks (NNs) have attracted more attention compared to other techniques. That is mainly due to the strong discrimination and generalization abilities of Neural Networks that utilized for classification purposes [13]. Artificial Neural Network is a system simulation of the neurons in the human brain [14]. It is composed of a large number of highly interconnected processing elements (neurons) working with each other to solve specific problems. Each processing element is basically a summing element followed by an active function. The output of International Journal of Computer Science and Security, Volume (4): Issue (3) 286
- 31. Muna Mhammad T. Jawhar & Monica Mehrotra each neuron (after applying the weight parameter associated with the connection) is fed as the input to all of the neurons in the next layer. The learning process is essentially an optimization process in which the parameters of the best set of connection coefficients (weights) for solving a problem are found [15]. An increasing amount of research in the last few years has investigated the application of Neural Networks to intrusion detection. If properly designed and implemented, Neural Networks have the potential to address many of the problems encountered by rule-based approaches. Neural Networks were specifically proposed to learn the typical characteristics of system’s users and identify statistically significant variations from their established behavior. In order to apply this approach to Intrusion Detection, we would have to introduce data representing attacks and non- attacks to the Neural Network to adjust automatically coefficients of this Network during the training phase. In other words, it will be necessary to collect data representing normal and abnormal behavior and train the Neural Network on those data. After training is accomplished, a certain number of performance tests with real network traffic and attacks should be conducted [16]. Instead of processing program instruction sequentially, Neural Network based models on simultaneously explorer several hypotheses make the use of several computational interconnected elements (neurons); this parallel processing may imply time savings in malicious traffic analysis [17]. 4. FUZZY C-MEANS CLUSTERING The FCM based algorithms are the most widely used fuzzy clustering algorithms in practice. It is based on minimization of the following objective function [18], with respect to U, a fuzzy c- partition of the data set, and to V, a set of K prototypes: 2 , 1<m<∞ …… (1) Where m is any real number greater than 1, Uij is is the degree of membership of Xj in the cluster I, Xj is jth of d-dimensional measured input data, Vi is the d-dimension center of the cluster, and ║*║is any norm expressed the similarity between any measured data and the center. Fuzzy partition is carried out through an iterative optimization of (1) with the update of membership Uij and the cluster centers Vi by: …. (2) …. (3) The criteria in this iteration will stop when maxij │Uij-Ûij│< ε, where ε is a termination criterion between 0 and 1, also the maximum number of iteration cycles can be used as a termination criterion [19]. 5. EXPERIMENT DESIGN The block diagram of the hybrid model is showed in the following figure (1) International Journal of Computer Science and Security, Volume (4): Issue (3) 287
- 32. Muna Mhammad T. Jawhar & Monica Mehrotra Dos KDD FCM NN U2R data set clustering (MLP) U2l prob Normal No action FIGURE 1: the block diagram of the model 5.1 KDD Data Set KDD 99 data set are used as the input vectors for training and validation of the tested neural network. It was created based on the DARPA intrusion detection evaluation program. MIT Lincoln Lab that participates in this program has set up simulation of typical LAN network in order to acquire raw TCP dump data [20]. They simulated LAN operated as a normal environment, which was infected by various types of attacks. The raw data set was processed into connection records. For each connection, 41 various features were extracted. Each connection was labeled as normal or under specific type of attack. There are 39 attacker types that could be classified into four main categories of attacks: DOS (Denial of Service): an attacker tries to prevent legitimate users from using a service e.g. TCP SYN Flood, Smurf (229853 record). Probe: an attacker tries to find information about the target host. For example: scanning victims in order to get knowledge about available services, using Operating System (4166 record). U2R (User to Root): an attacker has local account on victim’s host and tries to gain the root privileges (230 records). R2L (Remote to Local): an attacker does not have local account on the victim host and try to obtain it (16187 records). The suggested model was trained with reduced feature set (35 out of 41 features as in appendix A). We get 25000 training data patterns from 10 percent training set and test data patterns from test set which has attack patterns that are not presented in the training data, we divided test data pattern into two sets. 5.2 FCM Algorithm The first stage of the FCM algorithm is to initialize the input variable, the input vector consists of 35 features as mentioned previously, the number of cluster is 2 (1=attack and 2=normal), and the center of cluster is calculated by taking the means of all feature from random records in KDD dataset, and the parameter of the object function (m) is 2. After apply the FCM to two different datasets the result after iteration four is 99.99% classification of normal from attack records as seen in the following tables. Input data Iteration Iteration Iteration Iteration Iteration Iteration No.1 No. 2 No. 3 No. 4 No. 5 No. 6 Normal 1725 1049 1003 1001 1001 1001 998 Attack 20408 21081 21130 21132 21132 21132 21135 TABLE (1): the result of the first experiment of using FCM clustering International Journal of Computer Science and Security, Volume (4): Issue (3) 288
- 33. Muna Mhammad T. Jawhar & Monica Mehrotra Iteration No. 1 2 3 4 5 6 Normal classification rate 57.80 95.10 99.59 99.98 99.98 99.98 (%) Attack classification rate (%) 96.50 99.74 99.97 99.98 99.98 99.98 False positive (%) 0.728 0.0541 0.00501 0.0030 0.0030 0.0030 False negative (%) 0.421 0.048 0.0049 0.0029 0.0029 0.0029 TABLE (2): the classification rate of the first experiment Input data Iteration Iteration Iteration Iteration Iteration Iteration No.1 No. 2 No. 3 No. 4 No. 5 No. 6 Normal 1752 1062 1022 1019 1019 1019 1018 Attack 8277 8958 8998 9001 9001 9001 9002 TABLE (3): the result of the second experiment of using FCM clustering Iteration No. 1 2 3 4 5 6 Normal classification rate 57.62 95.77 99.60 99.99 99.99 99.99 (%) Attack classification rate (%) 91.90 99.57 99.95 99.99 99.99 99.99 False positive (%) 0.7121 0.0432 0.0039 0.0009 0.0009 0.0009 False negative (%) 0.418 0.0414 0.0039 0.0009 0.0009 0.0009 TABLE (4): the classification rate of the second experiment As shown in table 1 the total input data is 22133 records, 998 records as normal and 21135 records as attacker. After applying FCM algorithm, the result after iteration one is 1725 record for normal and 20408 records for attack. After second iteration of FCM algorithm the result is 1049 records for normal and 2108 records for attack, after iteration three the result is 1003 records for normal and 21130 records for attack, the result after iteration four is 1001 records for normal and 21132 records for attack and the result after iteration five and six is the same and there is no change, therefore FCM algorithm is stopped. As seen the final result of the first experiment in table 1 is 1001 records are normal and 21132 records are attack, the original input data is 998 records as normal and 21135 records as attack. Then we calculated the normal and attack classification rate by the following equation[3]: Number of classified patterns Classification rate= * 100 ..…..(4) Total number of patterns False negative means if it is attack and detection system is normal, false positive means if it is normal and detect system is attack. The false positive alarm rate calculated as the total number of normal instances that were classified as intrusions divided by the total number of normal instances and the false negative alarm rate calculated as the total number of attack instances that were classified as normal divided by the total number of attack instances. The same calculation is applied for the second experiment. 5.3 MLP Training Algorithm The anomaly detection is to recognize different authorized system users and identify intruders from that knowledge. Thus intruders can be recognized from the distortion of normal behavior. Because the FCM clustering stages are classified normal from attack, the second stage of NN is used for classification of attacks type. Multi-layer feed forward networks (MLP) is used in this International Journal of Computer Science and Security, Volume (4): Issue (3) 289
- 34. Muna Mhammad T. Jawhar & Monica Mehrotra work. The number of hidden layers, and the number of nodes in the hidden layers, was also determined based on the process of trial and error. We choose several initial values for the network weight and biases. Generally these chosen to be small random values. The Neural Network was trained with the training data which contains only attack records. When the generated output result doesn’t satisfy the target output result, the error from the distortion of target output was adjusted. Retrain or stop training the network depending on this error value. Once the training was over, the weight value is stored to be used in recall stage. The result of the training stage of different network architectures with different training algorithms and different activation functions is shown in the following tables. Function No of Accuracy Epochs (%) Gradient descent 3500 61.70 Gradient descent with moment 3500 51.60 Resilient back propagation 67 98.04 Scaled conjugate gradient 351 80.87 BFGS quasi-Newton method 359 75.67 One step secant method 638 89.60 Levenberg- marquardt 50 79.34 TABLE (5): test performance of different Neural Network training functions FIGURE (2) : the performance of Resilient back propagation As seen from above table the best training algorithm is Resilient back propagation which takes less time, low no. of epoch, and high accuracy, the performance of the Resilient back propagation is shown in figure(2), therefore we used it in this paper. The architecture based on this program used one hidden layer, consisting of 12 neurons and 3 neurons in the output layer, the desired mean square error is 0.00001 and the No. of Epoch is 1000, the result of training is illustrated in table(6). Input Output Accuracy Dos 23084 23084 100% U2R 7 7 100% U2L 608 608 100% Prob 1301 1301 100% MSE 0.00001 Time 00:00:54 Epoch 56 TABLE (6): the training experiment of Resilient back propagation International Journal of Computer Science and Security, Volume (4): Issue (3) 290
- 35. Muna Mhammad T. Jawhar & Monica Mehrotra 6. TEST AND RESULTS The model was designed to provide output values between 0.0 and 1.0 in the output nodes. The first stage of the model is FCM clustering, the classification rate is 99.99% which means that the false negative rate is 0.01% and the false positive rate is 0.01% as mentioned previously the manner of calculation them, is very low according to the previous researches. FCM algorithm separates the normal records from attack records, then the MLP stage is the classification of attack to four types. During the testing phase, the accuracy classification of each attack types was calculated, classification time of two different inputs of datasets, the result is shown in table (7). Attack name Input 1 Output Accuracy Input 2 Output Accuracy Dos 23088 23089 99.9% 20463 20463 100% U2R 7 7 100% 2 2 100% U2L 608 608 100% 5 2 40% Prob 1301 1301 100% 665 666 99.8% Unknown 18 17 94.4% 114 166 68.6% Time(sec) 5.8292 4.6766 TABLE (7): The result of testing phase 7. CONCLUSION The main contribution of the present work is to achieve a classification model with high intrusion detection accuracy and mainly with low false negative; this was done through the design of a classification model for the problem using FCM with Neural Network for detection of various types of attacks. The first stage of the model is FCM clustering, the classification rate is 99.99% that is means the false negative rate is 0.01% and false positive rate is 0.01% which is very low according to the previous researches as illustrated in table (8) and figure(3). The second stage of the model is Neural Network. After many experiment on the Neural Network using different training algorithms and object functions, we observed that Resilient back propagation with sigmoid function was the best one for classification therefore we used it in this work. And we trail many architectures with one hidden layer and two hidden layers with different number of neurons to obtain the best performance of the Neural Network. author Mehdi Srinivas Dima Iftikar Pizeniyslaw Khattab Muna name 2004 2005 2006 2007 2008 2009 2010 properties Classification 87% 97.07% 93% 95.93% 92% 97.0% 99.9% rate False negative - 2.76% - - - 0.80% 0.01% False positive - 0.20% 0.8% - 8.8% 2.76% 0.01% TABLE (8): the comparison result with previous works International Journal of Computer Science and Security, Volume (4): Issue (3) 291
- 36. Muna Mhammad T. Jawhar & Monica Mehrotra result compare 120 97.04 97.1 97 99 100 92.2 93.25 87 80 detection rate 80 60 40 20 0 "2003" "2004" "2005" "2006" "2007" "2008" "2009" "2010" years FIGURE (3): The result compare 8. REFERENCES 1. J., Muna. M. and Mehrotra M., "Intrusion Detection System : A design perspective", 2rd International Conference On Data Management, IMT Ghaziabad, India. 2009. 2. M. Panda, and M. Patra, “Building an efficient network intrusion detection model using Self Organizing Maps", proceeding of world academy of science, engineering and technology, Vol. 38. 2009. 3. M. Khattab Ali, W. Venus, and M. Suleiman Al Rababaa, "The Affect of Fuzzification on Neural Networks Intrusion Detection System", IEEE computer society.2009. 4. B. Mykerjee, L. Heberlein T., and K. Levitt N., "Network Intrusion Detection", IEEE Networks, Vol. 8, No.3, PP.14-26. 1994. 5. W. Jung K., "Integration Artificial Immune Algorithms for Intrusion Detection", dissertation in University of London, PP.1-5.2002. 6. T. Zhou and LI Yang, "The Research of Intrusion Detection Based on Genetic Neural Network", Proceedings of the 2008 International Conference on Wavelet Analysis and Pattern Recognition, Hong Kong, IEEE.2008. 7. J. Shum and A. Heidar Malki, "Network Intrusion Detection System Using Neural Networks", Fourth International Conference on Natural Computation, IEEE computer society.2008. 8. D. Novikov, V. Roman Yampolskiy, and L. Reznik, "Anomaly Detection Based Intrusion Detection", IEEE computer society.2006. 9. I. Ahmad, S. Ullah Swati and S. Mohsin, "Intrusions Detection Mechanism by Resilient Back Propagation (RPROP)", European Journal of Scientific Research ISSN 1450-216X Vol.17 No.4, pp.523-531.2007. 10. S. Mukkamala, H. Andrew Sung, and A. Abraham, "Intrusion detection using an ensemble of intelligent paradigms", Journal of Network and Computer Applications 28. pp167–182.2005. 11. S. Jimmy and A. Heidar, "Network Intrusion Detection System using Neural Networks", IEEE computer society.2008. 12. M. Vallipuram and B. Robert, "An Intelligent Intrusion Detection System based on Neural Network", IADIS International Conference Applied Computing.2004. 13. M. Al-Subaie, "The power of sequential learning in anomaly intrusion detection", degree master thesis, Queen University, Canada.2006. 14. P. Kukielka and Z. Kotulski, "Analysis of different architectures of neural networks for application in intrusion detection systems", proceeding of the international multiconference on computer science and information technology, pp. 807-811.2008. 15. M. Moradi and M. Zulkernine, "A Neural Network based system for intrusion detection and classification of attacks", Queen University, Canada.2004. 16. D. Novikov, V. Roman Yampolskiy, and L. Reznik, "Artificial Intelligence Approaches For Intrusion Detection", IEEE computer society.2006. International Journal of Computer Science and Security, Volume (4): Issue (3) 292
- 37. Muna Mhammad T. Jawhar & Monica Mehrotra 17. S. Lília de Sá, C. Adriana Ferrari dos Santos, S. Demisio da Silva, and A. Montes, "A Neural Network Application for Attack Detection in Computer Networks", Instituto Nacional de Pesquisas Espaciais – INPE, BRAZIL.2004. 18. J. Bezdek, C., "pattern Recognition with Fuzzy Objective Function Algorithms". Plenum, New York.1981. 19. Y. John and R. Langari, "Fuzzy Logic intelligence, control, and information", Publish by Dorling Kindersley, India, pp.379-383.2006. 20. P. Kukiełka and Z. Kotulski, "Analysis of Different Architectures of Neural Networks for Application in Intrusion Detection Systems", Proceedings of the International Multiconference on Computer Science and Information Technology, IEEE, pp. 807– 811.2008. 21. KDD-cup dataset. http://kdd.ics.uci.edu/data base/ kddcupaa/kddcup.html 22. Loril D., "Applying Soft Computing Techniques to intrusion Detection", Ph.D thesis, Dep. Of Computer Sce. University of Colorado at Colorado Spring, 2005. APPENDIX -A- The table (A1) describes the 41 features of each connection record in the DARPA KDD cup 1999[23]. The fields with blue color are features that have been considered in this research. Table (A1): feature of KDD cup 1999 data No. Feature name Description Type 1 Duration length (number of seconds) of the connection Continuous 2 Protocol-type type of the protocol, e.g. tcp, udp, etc. Discrete 3 Service network service on the destination, e.g., http, telnet, Discrete etc. 4 Flag normal or error status of the connection discrete 5 Src-bytes number of data bytes from source to destination Continuous 6 Det-bytes number of data bytes from destination to source Continuous 7 Land 1 if connection is from/to the same host/port; 0 Discrete otherwise 8 Wrong fragment number of ``wrong'' fragments Continuous 9 Urgent number of urgent packets Continuous 10 Hot number of ``hot'' indicators Continuous 11 Num-failed-logien number of failed login attempts Continuous 12 Logged-in 1 if successfully logged in; 0 otherwise Discrete 13 Num-compromised number of ``compromised'' conditions continuous 14 Root-shell 1 if root shell is obtained; 0 otherwise discrete 15 Su-attempted 1 if ``su root'' command attempted; 0 otherwise discrete 16 Num-root number of ``root'' accesses discrete 17 Num-file-creation number of file creation operations continuous 18 Num-shells number of shell prompts continuous 19 Num-access-file number of operations on access control files continuous 20 Num-outbound- number of outbound commands in an ftp session continuous cmds 21 Is-hot-login 1 if the login belongs to the ``hot'' list; 0 otherwise discrete 22 Is-guest-login 1 if the login is a ``guest''login; 0 otherwise discrete 23 Count number of connections to the same host as the continuous current connection in the past two seconds 24 Srv-count number of connections to the same service as the continuous current connection in the past two seconds 25 Serror-rate % of connections that have ``SYN'' errors continuous 26 Srv-serror-rate % of connections that have ``SYN'' errors continuous 27 Rerror-rate % of connections that have ``REJ'' errors continuous 28 Srv-error-rate % of connections that have ``REJ'' errors continuous 29 Same-srv-rate % of connections to the same service Continuous 30 Diff-srv-rate % of connections to different services Continuous 31 Srv-diff-host-rate % of connections to different hosts Continuous 32 Det-host-count Number of connection to the same host Continuous 33 Dst-host-srv-co Number of connection to the same serves for the Continuous host International Journal of Computer Science and Security, Volume (4): Issue (3) 293
- 38. Muna Mhammad T. Jawhar & Monica Mehrotra 34 Dst-host-same-srv- % of connections with the same service Continuous rate 35 Dst-host-diff-srv- % of connections different services Continuous rate 36 Dst-host-same-srv- % of connections using same source port Continuous host-rate 37 Dst-host-diff-srv- % of connections with same service but to different Continuous host-rate host 38 Dst-host-serror-rate % of connections that have "SYN" error Continuous 39 Dst-host-srv-rate % of connections with same service that have "SYN" Continuous errors 40 Dst-host-error-rate % of connections that have "REJ" error Continuous 41 Dst-host-srv-rer-rate % of connections with same service that have "REJ" continuous errors International Journal of Computer Science and Security, Volume (4): Issue (3) 294
- 39. Mohammed Awad Optimization RBFNNs Parameters Using Genetic Algorithms: Applied on Function Approximation Mohammed Awad [email protected] Faculty Engineering and Information Technology /CIT Dept. Arab American University Jenin, 240, Palestine Abstract This paper deals with the problem of function approximation from a given set of input/output (I/O) data. The problem consists of analyzing training examples, so that we can predict the output of a model given new inputs. We present a new approach for solving the problem of function approximation of I/O data using Radial Basis Function Neural Networks (RBFNNs) and Genetic Algorithms (GAs). This approach is based on a new efficient method of optimizing RBFNNs parameters using GA, this approach uses GA to optimize centres c and radii r of RBFNNs, such that each individual of the population represents centres and radii of RBFNNs. Singular value decomposition (SVD) is used to optimize weights w of RBFNNs. The GA initial population performed by using Enhanced Clustering Algorithm for Function Approximation (ECFA) to initialize the RBF centres c and k-nearest neighbor to initialize the radii r. The performance of the proposed approach has been evaluated on cases of one and two dimensions. The results show that the function approximation using GA to optimize RBFNNs parameters can achieve better normalized- root-mean square-error than those achieved by traditional algorithms. Keywords: Radial Basis Function Neural Networks, Genetic Algorithms and Function Approximation. 1. INTRODUCTION Function approximation is the name given to a computational task that is of interest to many science and engineering communities [1]. Function Approximation consists of synthesizing a complete model from samples of the function and its independent variables [2]. In supervised learning, the task is to map from one vector space to another with the learning based on a set of instances of such mappings. We assume that a function F does exist and we endeavor to synthesize a computational model of that function. As a general mathematical problem, function approximation has been studied for centuries. For example, in pattern recognition, a function mapping is made whose objective is to assign each pattern in a feature space to a specific label in a class space [3, 12]. The idea of combining genetic algorithms and neural networks occurred initially at the end of the 1980s. The problem of neural networks is that the number of parameters has to be determined before any training begins and there is no clear rule to optimize them, even though these parameters determine the success of the training process [23]. Genetic algorithms (GAs), on the other hand, are very robust and explore the search space more uniformly, since every individual is evaluated independently, which makes GAs very suitable to the optimization of Neural Networks [4]. However, the choice of the basic parameters (network topology, initial weights) often determines the success of the training process. The selection of these parameters is practically determined by accepted rules of thumb, but their value is at most arguable. GAs are global search methods, that are based on the principles of selection, crossover and mutation [23, 25]. GAs increasingly have been applied to the design of neural networks in several ways, such as optimization of the topology of neural networks by International Journal of Computer Science and Security (IJCSS), Volume (4): Issue (3) 295
- 40. Mohammed Awad optimizing the number of hidden layers and the number of nodes in each hidden layer, and the optimization of neural network parameters by optimizing the weights [5, 6]. One type of neural network, called Radial Basis Function Neural Networks (RBFNNs) [24], has the property of universal approximation and has received some attention by other researchers, but its parameters have, so far, been only partially optimized using GAs [1, 12]. RBFNNs are characterized by a transfer function in the hidden unit layer having radial symmetry with respect to a centre [7]. The basic architecture of RBFNNs is a 3-layer network as in Figure 1. The output of the RBFNNs is given by the following expression: m F (x, , w) i 1 i ( x ) wi (1) Where {i : i 1,..., m} is the basis functions set, and wi is the associate weights for every RBF. The basis function can be calculated as a Gaussian function using the following expression: x c ( x , c , r ) exp (2) r Where c is the central point of the function , r is its radius and x is the input vector. 1 w1 x1 2 F(X) w2 …. … xm wm m Fig.1. Radial Basis Function Network Topology optimization is a common learning method for RBFNNs, but a big challenge is optimization that includes the full parameter sets of centres c, radii r and weights w along with the number of neurons per hidden layer. There are several possibilities of using GAs to configure RBFNNs. A straightforward approach is to fix a topology and use GA as an optimization tool to compute all free-parameters [8]. In [9] the author fixed the number of hidden neurons, and used GA to optimize only the location of the RBFNNs centres. The radii and output weights were computed by the K-nearest neighbor KNN and the singular value decomposition SVD, respectively. In [10] the author also fixed the number of centres, and evolved their locations and radii, instead of encoding a network in each individual, the entire set of chromosomes cooperates to constitute RBFNNs. Another idea is to hybridize the configuration process, using GA as a support tool. Chen et. al. [13] presented a two-level learning method for RBFNNs, where a regularized orthogonal least squares (ROLS) algorithm was employed to construct the RBFNNs at the inner level, while the two main parameters of this algorithm were optimized by a GA process at the outer level. In [14], GA was used to optimize the number and initial positions of the centres using the k-means clustering algorithm; the RBFNNs first training then proceeded as in [15]. In our approach we present a different way that depends on optimizing the topology of RBFNNs and its parameters centres c, and radii r using GA. Weights w are calculated by means of methods of resolution of linear equations. In this proposed approach we use the singular values decomposition (SVD) to solve this system of linear equations and assign the International Journal of Computer Science and Security (IJCSS), Volume (4): Issue (3) 296
- 41. Mohammed Awad weights w for RBFNNs to calculate the output. Each individual is an entire set of chromosomes cooperate to constitute a RBFNNs. In our proposed approach we use the incremental method to determine the number of RBF (neurons) depending on the data-test- error that the system produces which means, an increase in each iteration will be only one RBF until there is no improvement in test error during several iterations. The organization of the rest of this paper is as follow: Section 2 presents an overview of the proposed approach. In Section 3, we present in detail the proposed approach for the determination of the pseudo-optimal RBFNNs parameters. Then, in Section 4 we show some results that confirm the performance of the proposed approach. Some final conclusions are drawn in Section 5. 2. THE PROPOSED APPROACH As mentioned before, the problem of function approximation consists of synthesizing a complete model from samples of the function and it is independent variables. Consider a function y F ( x ) where x is a vector (x 1,…,x p) in k-dimensional space from which a set of input/output data pairs is available. The process of combining RBFNNs and GA is based on the using of GA to optimize the RBFNNs parameters (centres c, and radii r) so that the neuron is put in a suitable place in input data space [11]. The form of combining RBFNNs with GAs appears in Figure 2. Original Problem Input Data GAs/ RBFNN Output Approximation Fig.2. Combining GA and RBFNN The process begins with an initial population generated using three techniques for the initialization of centres c, radii r, and weights w. The first technique is a clustering algorithm, designed for function approximation (ECFA) [16], which is used for initializing the RBF centres c. ECFA calculates the error committed in every cluster using the real output of the RBFNN, which is trying to concentrate more in those input regions where the approximation error is bigger, thus attempting to homogenize the contribution to the error of every cluster. Due to this fact, the cluster locations are located in different places depending on the paradigm used to model the internal relation in the I/O data [16]. The second technique is the k-nearest neighbors technique (Knn), which is used for the initialization of the radii r of each RBF. The Knn technique sets the radius of each RBF to a value equal to the mean of the Euclidean distance between the centres of their nearest RBF [1, 20]. The last technique is singular value decomposition (SVD), which is used to optimize directly the weights. The SVD technique is used to solve the problem of RBF misplacement by using singular matrix activation. If two functions are almost identical in the activation matrix, then two columns will be produced with equal weight, whereas if a RBF is not activated for any point, zero columns in the matrix will be produced [16, 20]. All these techniques are used once for the first configuration. The fitness function (NRMSE) that is used to evaluate the population will establish the fitness for every chromosome depending on its functions in the training set. The best population will be selected for promotion to the next generation, where the genetic operators of crossover and mutation produce a new population. The population leads the process of the selection to the best value of the fitness (small error). Crossover and mutation lead to exploring the unknown regions of the search space. Then, the population converges to the best parameters of optimization of weights, centres and radii of RBFNNs. The process repeats until it finds the best fitness or until the generation number reaches the maximum with the same genetic operators in every generation. International Journal of Computer Science and Security (IJCSS), Volume (4): Issue (3) 297
- 42. Mohammed Awad 3. PARAMETER OPTIMIZATION OF RBFNN USING GAs A GA is a search or an optimization algorithm, which is invented based on genetics and evolution. The initial population of individuals that have a digit string as the chromosome is usually generated randomly. Each element of a chromosome is called a gene. The fitness, which is a measure of improvement of approximation, is calculated for each individual. The selection operations choose the best individuals for the next generation depending on the fitness value. Then, crossover and mutation are performed on the selected individuals to create a new individual that replaces the worst members of the population offspring. These procedures are continued until the end-condition is satisfied. This algorithm confirms the mechanism of evolution, in which the genetic information changes for every generation, and the individuals that better adapt to their environment survives preferentially [17]. Our new proposed approach use GAs to construct optimal RBFNNs. The approach uses GAs evolving to optimize the two RBFNNs parameters (centres c, and radii r) and uses singular value decomposition (SVD) to optimize directly the weights w. The general process of our proposed approach can be depicted in Figure 3, and the pseudo-code of this algorithm reads: Begin Initialize population P {c [by ECFA], r [by Knn]}; and w [by SVD]. Evaluate each individual on population P by fitness function F ( x, , w) ; While not (stop criteria) ([threshold of NRMSE] || [number of Generation β]) do Select individual’s i1 and i2; ip+1 ← Crossover(i 1, i2); Mutation (i p+1); Evaluate (ip+1); if matches threshold → stop else insert(i p+1, Pnew); End; Start Number of RBF ≥ 1 Generate Initial Population P with Each Individual S represent the number of RBF using ECFA to initialize the centers, KNN for radii and SVD for Weights Insert the two Individuals in the Evaluate the Fitness Function New Generated Population. for each Individual. (NRMSE) Increased Number RBF by One Apply Mutation with Probability Pc to create two Offspring. Apply Crossover on the two selected individuals NO NRMSE ≤ α Select the Best two Individuals || G#≤β YES Stop Fig. 3. General description of the proposed algorithm International Journal of Computer Science and Security (IJCSS), Volume (4): Issue (3) 298
- 43. Mohammed Awad 3.1 Initialization Each gene is constituted by a real vector representing centres, and a real value representing radii of RBFs m. Chromosomes have a variable length which defined as follow: c h r o m c 1 m , r1 m , c 2m , r2 m . ... c im , ri m (3) In our approach the chromosome that consists of (centres c, radii r) is generated initially depending on classical algorithms so that initial centres will be generated once in the first configuration by an efficient method of clustering of the centres c of the RBF Network (ECFA) [16]. The K-nearest neighbors technique (Knn) used once in the first configuration for the initialization of the radii r of each RBF. The number of parameters in each chromosome calculated by [(# of RBF centres × # of dimensions) + # of RBF radii]. Singular value decomposition (SVD) is used directly to optimize the weights w. 3.2 The Evaluation Function The evaluation function is the function that calculates the value of the fitness in each chromosome, in our case, the fitness function is the error between the target output and the current output, (Fitness = error). In this paper, the fitness function we are going to use is the so-called Normalized-Root-Mean-Squared-Error (NRMSE). This performance-index is defined as: P 2 P 2 NRMSE ( y F(x,, w)) / (y y) i1 i i1 i (4) Where y is the mean of the target output, and p is the input data number. 3.3 Stop Process A GA evolves from generation to generation selecting and reproducing parents until reaching the end criterion. The criterion that is most used to stop the algorithm is a stated maximum number of generations. With this work we use the maximum number of generation β or the value of the fitness (NRMSE) threshold α as the criterion of End. This finishes the process when the fitness (NRMSE) value reaches the determined threshold value α or when the maximum number of performed generations exceeds the determined number of generations. In practice, however, the process of optimization can finish before approaching the termination conditions, which can happen when a GA moves from generation to generation without resulting in any improvement in the value of the fitness. If Current Generation ≥ Maximum Generation β || Fitness (NRMSE) ≤ Threshold value α → End the optimization 3.4 Selection The selection of the individuals to produce the consecutive generation is an important role in genetic algorithms. The probable selection arises the fitness of each individual. This fitness presents the error between the objective output and actual output of RBFNN, such that the individual that produces the smallest error has higher possibility to be selected. An individual in the population can be selected once in conjunction with all the individuals in the population who has a possibility of being selected to produce the next generation. There are many methods that are used for the process of the selection as: roulette wheel selection, geometric ranking method, and rank selection… etc [18, 19]. The most common selection method depends on assignment of a probability pj to every individual j based on its value of fitness. A series of numbers N is generated and compared against the accumulative i probability C i Pj , of the population. The appropriate individual j, is selected and copied in j 1 the new population if Ci 1 U (0,1) Ci . In our work we use a Geometric Ranking method; in this method the function of the evaluation determines the solution with a partially ordered set. By this we guarantee the minimization and the negative reaction of the geometric method of International Journal of Computer Science and Security (IJCSS), Volume (4): Issue (3) 299
- 44. Mohammed Awad classification. It works by assigning Pi based on the line of the solution i when all solutions are classified. In this method the probability Pi of the definite classification is calculated as in the following expressions [18, 19]: P individual selection-i q (1 q ) s1 (5) Where q is the probability of selecting the best individual, s is the line of the individual, where one is the best. q q (6) 1 (1 q ) P Where P is the population size. 3.5 Crossover and Mutation Crossover and mutation provide the basic search mechanism of a GA. The operators create new solutions based on the previous solutions created in the population. Crossover takes two individuals and produces two new recombinant individuals, whereas the mutation changes the individual by random alteration in a gene to produce a new solution. The use of these two basic types of genetic operators and their derivatives depends on the representation of the chromosome. For the real values that we use in our work, we use the arithmetical crossover, which produces two linear combinations of the parents (two new individuals) as in the following equations: ! X r X (1 r ) Y (7) ! Y (1 r ) X rY (8) Where X and Y are two vectors of k-dimensional that denote to individuals (parents) of the population and r is the probability of crossover between (0, 1) in this work probability of crossover r = 0. 5. From these equations we can present the process of the arithmetic crossover as shown in Figure 4. X c1X r1X w1X c2 X r2 X w2 X ! X c1Y r1Y w1Y c2 X r2 X w2 X ! Y c1Y r1X w1Y c2Y r2Y w2Y Y c1X r1X w1X c2Y r2Y w2Y Fig.4. The process of the arithmetic crossover of three points in two neurons RBF We can find many methods of mutation in [19], such as uniform mutation, non-uniform mutation (odd number - uniform mutation), and multi-non-uniform mutation. In our work we use the process of uniform mutation that changes one of the parameters of the parent. The uniform mutation selects one j element randomly and makes it equal to a uniform selected number inside the interval. The equation that presents the uniform mutation is shown in equation (Eq. 9): U ( a i , bi ) if i j x i' (9) xi o th e rw is e International Journal of Computer Science and Security (IJCSS), Volume (4): Issue (3) 300
- 45. Mohammed Awad Where ai and bi are down and top level, for every variable i. Figure 5 present the process of mutation that appears among the parameters of the RBFNNs. ! X c1X r1X w1X c2 X r2 X w2 X X c1Y r1Y w1Y c2 X r2 X w2 X * * * * Fig.5. The uniform mutation of two points in two neurons RBF 4. SIMULATION EXAMPLES The objective of this study is to develop and test an efficient approach that use to solve the problem of function approximation. Therefore, we assume different polynomial function to test the improvement of the approximation process depending on this approach. We have investigated three polynomial function problems, one function in one dimension and other two in two dimensions. The first function in figure 6 tests a case where there are many curves in the function structure. The numerical values in the function are created to proof that the proposed approach converges and dose not stuck in local minimums. Experiments have been performed to test the proposed approach. The system is simulated in MATLAB 7.0 under Windows XP with a Pentium IV processor running at 2.4 GHz. In this section we will compare the result of our approach with the results of other algorithms that approximate functions using GAs to optimize RBFNNs parameters. Two types of results are presented: The results of the validity of the algorithm in approximate functions from samples of I/O data of one dimension compared with other algorithms as [21, 22], and the approximation of function in two dimensions with the NRMSE and execution time. The results are obtained in five executions. NRMSETest is the mean of normalized mean squared error of the test index (for 1000 test data). The GA parameters that used are; the population-size = 100, crossover rate = 0.5 and mutation rate = 0.05. 4.1 One Dimension Examples F1(x) To test the effects caused by the proposed approach on initialization and avoiding local minimum of RBFs placement, Training set of 2000 samples of the function was generated by evaluating inputs taken uniformly from the interval [0, 1], from which we have removed 1000 points for test. This function is defined by the following expression: F1 ( x) e 3 x sin (10 x), x 0,1 (10) We can note from figure 6 (a) that the error produces before the training process distributed in unhomogenized form along with the input data space. In figure 6 (b) the training process that depends on optimizing RBFNN parameters (centres and radii) by GA produce error distribution is homogenized form for each RBF along with the input data space Fig. 6. (a) Error of each RBF in the input (b) Error of each RBF in the input space space Before the Training. After the Training. In Table 1, it can be seen that the proposed approach converge. This implies that RBFNN optimize not fall into local optimum solution. The NRMSETest predicted by the proposed International Journal of Computer Science and Security (IJCSS), Volume (4): Issue (3) 301
- 46. Mohammed Awad approach shown that the proposed approach minimizes the approximation error with much accuracy than other algorithms. Method # RBF NRMSE Test 5 0.1771 González [22] 6 0.1516 8 0.0674 10 0.0882 4±7 0.7 ± 0.2 Generation = 10 5±6 0.7 ± 0.2 Generation = 25 Rivas [21] 8±9 0.6 ± 0.3 Generation = 50 23 ± 7 0.2 ± 0.3 Generation = 75 22 ± 11 0.4 ± 0.3 Generation = 100 2 0.059 Generation = 50 4 0.0485 Generation = 50 Our Approach 6 0.0274 Generation = 50 8 0.0205 Generation = 50 10 0.0223 Generation = 50 TABLE1: Comparison Result of NRMSETest Error of different approach It’s clear in figure 7 that the distribution of RBFs in the case of approximation with 8 RBF is not affected in the right part of the function, but when we increased the number of RBF as in approximation with 10 RBF, the approximation process is efficient, which is clear in the improvement of the fitness value with the increased number of generations. These results indicate that using GA to optimize RBFNN centres and radii give optimal performance. Optimization with 8 RBF Fitness Improvement with Generations Optimization with 10 RBF Fitness Improvement with Generations Fig. 7. Approximation of the function and Improvement of fitness with Generations A comparison between three approaches applied is shown in figure 8. We can see that the training precision of the algorithm presented in this paper is higher than other algorithms. The International Journal of Computer Science and Security (IJCSS), Volume (4): Issue (3) 302
- 47. Mohammed Awad NRMSETest becomes smaller and the fitness becomes larger accompanying the increase of the generation; the fitness changes slowly when the generation number is between 20 and 50; we can judge that the convergence condition is satisfied when the generation number reaches 20, because the fitness does not increase any more. 1 González[22] 0.9 Rivas [21] Our Approach 0.8 0.7 0.6 N SE RM 0.5 0.4 0.3 0.2 0.1 0 5 6 7 8 9 10 Fig. 8. Comparison the NRMSETest with the increase of RBF numbers between different approaches. 4.2 Two Dimension Examples F1(x1,x2) In this part we used functions of two-dimensions (see Figure 9, Figure 11). These functions of two-dimension use a set of training data formed by 441 points distributed as 21 x 21 cells in the input space. These examples of two dimensions are used to demonstrate the ability of the proposed approach in approximating two dimension examples. In this example we use number of Generations =250. Fig. 9. Objective function F1(x1,x2) Figure 10 presents different result of approximation of the function F1 ( x1 , x2 ) , and the improvement of fitness function (NRMSETest) with the increased generation numbers. NRMSE Execution Time (sec) Nº RBF Mean Max Min Mean 2 0.224 130 122 127 4 0.176 164 144 156 6 0.124 169 147 157 8 0.115 192 181 186 10 0.27 203 184 192 TABLE3. Result of NRMSETest and Execution Time of the proposed approach applied on 2D Function F1(x1,x2) International Journal of Computer Science and Security (IJCSS), Volume (4): Issue (3) 303
- 48. Mohammed Awad Table 3 shows two results, the mean of NRMSETest after 5 executions and the time of the approximation in seconds. The NRMSETest of the RBFNN trained by GA is lower which means that the proposed approach converges and dose not stuck in local minimum. Although the RBFNN optimized by GA gives a lower NRMSETest and higher approximation accuracy on the training data, it requires small computation time to converge. Optimization with 8 RBF Fitness Improvement with Generations Optimization with 10 RBF Fitness Improvement with Generations Fig. 10. Approximation of the function F1(x1,x2) and Improvement of fitness with Generations The NRMSETest becomes smaller and the fitness becomes larger accompanying the increase of the generation; the fitness changes slowly when the generation number is between 175 and 250; we can judge that the convergence condition is satisfied in this study case of 2 dimensions when the generation number reaches 175, because the fitness does not increase any more. 4.3 Two Dimension Example F2(x1,x2) Fig. 11. Objective function F2(x1,x2) International Journal of Computer Science and Security (IJCSS), Volume (4): Issue (3) 304
- 49. Mohammed Awad Figure 12 presents different result of approximation of the function F2 ( x1 , x2 ) and the improvement of Fitness function (NRMSETest) with the increased generation numbers. NRMSE Execution Time (sec) Nº RBF Mean Max Min Mean 2 0.53 122 112 117 4 0.37 132 121 127 6 0.28 169 147 158 8 0.22 188 175 178 TABLE4. Result of NRMSETest and Execution Time of the proposed approach applied on 2D Function F2(x1,x2) Optimization with 6 RBF Fitness Improvement with Generations Optimization with 8 RBF Fitness Improvement with Generations Fig. 12. Approximation of the function F2(x1,x2) and Improvement of fitness with Generations 5. CONCLUSION In our paper an efficient way of applying GA to RBFNNs configuration has been presented. The approach optimizes centres c and Radii r parameters of RBFNN using GAs. The weights w are optimized by using singular value decomposition SVD. The initialization of the centres depends on an efficient algorithm of clustering (ECFA) [16] which means less complexity of calculation to optimize each parameter alone. This approach was compared to two approaches to optimize RBFNNs. The proposed approach is accurate as the best of the others approaches and with significantly less number of RBFs in all experiments. Simulations have demonstrated that the approach can produce more accurate prediction. This approach is easy to implement and is superior in both performance and computation time compared to other algorithms. Normally, GAs took a long training time to achieve results, International Journal of Computer Science and Security (IJCSS), Volume (4): Issue (3) 305
- 50. Mohammed Awad but in the proposed approach the time taken is suitable and that because of using algorithms for the initialization of the RBFNN parameters. We have also shown that it is possible to use this approach to find the minimal number of RBF (Neurones) that satisfy a certain error target for a given function approximation problem. 6. REFERENCES [1] M. J. D. Powell. “The Theory of Radial Basis Functions Approximation, in Advances of Numerical Analysis”. pp. 105–210, Oxford: Clarendon Press, 1992. [2] Z. Zainuddin O. Pauline. “Function approximation using artificial neural networks”. 12th WSEAS International Conference on Applied Mathematics, 2007 Cairo, Egypt pp: 140- 145. [3] Gen .M, Cheng .R. “Genetic algorithms and Engineering Optimization”. A Wiley- Interscience Publication, Johan Wiley and Sons, Inc. 2000. [4] B. Carse, A.G. Pipe, T.C. Forgarty and T. Hill, "Evolving radial basis function neural networks using a genetic algorithm", IEEE International Conference on Evolutionary Computation, Vol. 1, page 300 (1995) [5] D. Schaffer, D. Whitley and L.J. Eshelman, “Combinations of genetic algorithms and neural networks”. A survey of the state of the art, in Combinations of Genetic Algorithms and Neural Networks, pp. 1-37, IEEE Computer Society Press, 1992. [6] D. Prados. “A fast supervised learning algorithm for large multilayered neural networks”. in Proceedings of 1993 IEEE International Conference on Neural Networks, San Francisco, v.2, pp.778-782, 1993. [7] A. Topchy, O. Lebedko, V. Miagkikh, “Fast Learning in Multilayered Neural Networks by Means of Hybrid Evolutionary and Gradient Algorithm”. in Proc. of the First Int. Conf. on Evolutionary Computations and Its Applications, ed. E. D. Goodman et al., (RAN, Moscow), pp.390–399, 1996. [8] B. A. Whitehead and T.D. Choate. “Cooperative - Competitive Genetic Evolution of Radial Basis Function Centers and Widths for Time Series Predictio”. IEEE Transactions on Neural Networks, vol. 7, no. 8, pp.869-880, 1996. [9] Fogel L.J., Owens A.J. and Walsh M.J. “Artificial Intelligence through Simulated Evolution”. John Wiley & Sons, 1966. [10] M. W. Mak and K. W. Cho. “Genetic evolution of radial basis function centers for pattern classification”. In Proc. Of The 1998 IEEE International Joint Conference on Neural Networks, pages 669 – 673, 1998. Volume 1. [11] A. F. Sheta and K. D. Jong. “Time-series forecasting using GA-tuned radial basis functions”. Information Sciences, Special issue, 2001. [12] M. Awad, H. Pomares, F. Rojas, L.J. Herrera, J. González, A. Guillén. “Approximating I/O data using Radial Basis Functions:A new clustering-based approach”. IWANN 2005, LNCS 3512, pp. 289– 296, 2005.© Springer-Verlag Berlin Heidelberg 2005. [13] S. Chen, Y. Wu, and B. L. Luk. “Combined genetic algorithm optimization and regularized orthogonal least squares learning for radial basis function networks”. IEEE-NN, 10(5):1239, September 1999. [14] B. Burdsall and C. Giraud-Carrier. “GA-RBF: A selfoptimising RBF network”. In Proc. of the Third International Conference on Artificial Neural Networks and Genetic Algorithms, pages 348–351. Springer-Verlag, 1997. [15] Y. Hwang and S. Bang. “An efficient method to construct a radial basis function neural network classifier”. Neural Networks, 10(8):1495–1503, 1997. [16] M. Awad, H. Pomares, I. Rojas, Member, IEEE. “Enhanced Clustering Technique in RBF Neural Network for Function Approximation”. INFOS2007, Fifth International Conference 24-26 March 2007, Cairo University Post Office, Giza, Egypt. [17] T. Hatanaka, N. Kondo and K. Uosaki. “Multi–Objective Structure Selection for Radial Basis Function Networks Based on Genetic Algorithm”. Department of Information and Physical Science Graduate School of Information Science and Technology, Osaka University 2–1 YamadaOka, Suita, 565–0871, Japan. International Journal of Computer Science and Security (IJCSS), Volume (4): Issue (3) 306
- 51. Mohammed Awad [18] P. T. Rodríguez-Piñero. “Introducción a los algoritmos genéticos y sus aplicaciones”. Universidad Rey Juan Carlos, España, Madrid. (2003) [19] Z. Michalewickz. Univ. of North Carolina, Charlotte “Genetic Algorithms + Data Structures = Evolution Programs”. Springer-Verlag London, UK (1999). [20] Gonzalez, J.; Rojas, H.; Ortega, J.; Prieto, A. “A new clustering technique for function approximation”. Neural Networks, IEEE .Transactions on, Volume: 13 Issue: 1, Jan. 2002. Page(s): 132 -142. “Conditional fuzzy C-means,” Pattern Recognition Lett., vol. 17, pp. 625– 632, 1996 [21] Rivas. A. “Diseño y optimización de redes de funciones de base radial mediante técnicas bioinspiradas”. .PhD Thesis. University of Granada. 2003. [22] González. J, “Identificación y optimización de redes de funciones de base radiales para aproximación funcional”. PhD Thesis. University of Granada. 2001. [23] Ph. Koehn. “Combining Genetic Algorithms and Neural Networks”. Master Thesis University of Tennessee, Knoxville, December 1994. [24] Sambasiva, R. Baragada, S. Ramakrishna, M.S. Rao, S. P. “Implementation of Radial Basis Function Neural Network for Image Steganalysis”, International Journal of Computer Science and Security, Vol. 2, Issue 1, pp. 12 – 22, March 2008 [25] Sufal D. Banani Saha, “Data Quality Mining using Genetic Algorithm”, International Journal of Computer Science and Security, ISSN: 1985-1553, 3(2): pp 105-112, 2009. International Journal of Computer Science and Security (IJCSS), Volume (4): Issue (3) 307
- 52. V. Joevivek, N. Chandrasekar & Y.Srinivas Improving Seismic Monitoring System for Small to Intermediate Earthquake Detection V. Joevivek [email protected] Research scholar/Centre for Geo -Technology Manonmaniam Sundaranar University Tirunelveli, 627 012, Tamil nadu, India N. Chandrasekar [email protected] Professor and Head/Centre for Geo -Technology Manonmaniam Sundaranar University Tirunelveli, 627 012, Tamil nadu, India Y. Srinivas [email protected] Associate professor/Centre for Geo -Technology Manonmaniam Sundaranar University Tirunelveli, 627 012, Tamil nadu, India Abstract Efficient and successful seismic event detection is an important and challenging issue in many disciplines, especially in tectonics studies and geo-seismic sciences. In this paper, we propose a fast, efficient, and useful feature extraction technique for maximally separable class events. Support vector machine classifier algorithm with an adjustable learning rate has been utilized to adaptively and accurately estimate small level seismic events. The algorithm has less computation, and thereby increased high economic impact on analyzing the database. Experimental results demonstrate the strength and robustness of the method. Keywords: Feature extraction, Support Vector Machines, Kernels, Seismic signals, Wavelet decomposition Energy. 1. INTRODUCTION Seismic recorder based on 24-bit digitizer could not provide desired resolution for entire spectrum of seismic signals emanated from micro to intermediate level earthquakes [13]. Therefore it is necessary to characterize much small size seismic signals by employing a special algorithm to distinguish between seismic and non-seismic sources. Several algorithms are there in literature. Freiberger developed the theory of the Maximum likelihood detector assuming Gaussian signal superimposed on Gaussian noise. But real seismic data are not so statistically predictable [3]. Allen described an event detector based on an envelope that is equal to the square of the first derivative. The scheme well suited for short period data (frequency > 1Hz). It missed events from tele-seismic and volcanic events [1]. Clark and Rodger developed an adaptive prediction scheme suitable for small event detection. The drawback of the algorithm is that the signal becomes distorted during processing and event and noise components in the same frequency range are not separated well [2]. Similarly, Stearns and Vortman algorithm could not provide event and noise components in a separate manner [14]. International Journal of Computer Science and Security (IJCSS), Volume (4): Issue (3) 308
- 53. V. Joevivek, N. Chandrasekar & Y.Srinivas Fretcher et. al. described an approach to seismic event detection based on the Walsh transform theory. This method has complicated computing and unsuitable for online real time seismic applications [4]. Houliston et. al. have described a Short term to Long term average ratio (STA/LTA) algorithm for multichannel seismic network system. This algorithm is based on three components which is STA, LTA and Threshold value. The scheme depends on the amplitude fluctuations of seismic signals rather than signal polarization and frequencies [6]. Improved version of STA/LTA algorithm for 24 bit seismic data recording system has been developed by Kumar et. al. [9]. Even though STA/LTA algorithm performs better, sometimes it provides false event identification and incorrect time picking [13]. Ahmed et. al. developed wavelet based Akaike Information Criteria (AIC) method. It gives good result for event signal having different type of frequency [8] [18] [21]. But this could not be provided desired result when the local noise (Induced seismic events) is overlapping. Therefore the objective of our present work is to provide additional new features in existing 24-bit seismic monitoring system for reducing false events. 2. METHODOLOGY An aim in this research was to identify small to intermediate seismic events. We began this study with feature extraction technique, which is used to extract the information from the signals. Then the data is aligned into a single row as a vector for the SVM training and testing. The SVM is a learning machine for two-group classification problems that transforms the attribute space into multidimensional feature space using a kernel function to separate dataset instances by an optimal hyperplane. Subsequent section explained entire structure of methodology. 2.1. Data Source Our seismic monitoring network has included 8 substations and 1 head station. The purpose of this monitoring is to compile a complete database of earthquake activity in South India to predict as low magnitude as possible to understand the causes of the earthquakes in the region, to assess the potential for future damaging earthquakes, and to have better constrain in the patterns of strong ground motions from earthquakes in the region. Andaman and Java-Sumatra ridges where active collision and sudden changes taking place, have resulted very high seismicity in the northeast coast of India and Andaman belts. Therefore, station locations were fixed in and around this region. In this research, we used three years (2007-2010) of seismic data acquired from above mentioned seismic monitoring network. 2.2. Feature extraction We proposed a combined algorithm to extract the features from real time data. The combined algorithm includes Amplitude statistics, Phase statistics and Wavelet Decomposition Energy. 2.2.1. Statistical parameters Standard statistical techniques have been established for discriminate analysis of time series data [12], and structural techniques have been shown to be effective in a variety of domains involving time series data [17][19][20]. Mainly we focused four standard statistical parameters to extract the features from the seismic signals. Those parameters are Mean, Standard deviation, Skewness and Kurtosis. Mean and variance are fundamental statistical attributes of a time series. The arithmetic mean of a time series is the average or expected value of that time series. In some cases, the mean value of a time series can be the operating point or working point of a physical system that generates the time series. The Skewness and Kurtosis are higher- order statistical attributes of a time series. Skewness indicates the symmetry of the probability density function (PDF) of the amplitude of a time series. A time series with an equal number of large and small amplitude values has a Skewness of zero. A time series with many small values and few large values is positively skewed (right tail), and the Skewness value is positive. A time series with many large values and few small values is negatively skewed (left tail), and the Skewness value is negative. Amplitude and Shape Statistical parameters are shown in Table 1. International Journal of Computer Science and Security (IJCSS), Volume (4): Issue (3) 309
- 54. V. Joevivek, N. Chandrasekar & Y.Srinivas Methods Parameters Notation Mean 1 N A X (i) N i 1 , Where X (i ) is the spectral magnitude for the i th frequency bin Standard deviation 1 N 2 Amplitude B ( X (i ) A ) N i 1 Skewness 1 N X (i ) A 3 C B N i 1 Kurtosis 1 N X (i ) A 4 D B 3 N i 1 Mean 1 N N E iX (i) Where Q i 1 X (i) Q i 1 , Standard deviation 1 N F (i E ) 2 X (i ) Q i 1 Shape Skewness 1 N i E 3 G X (i ) Q i 1 F Kurtosis 1 N i E 4 D X (i) 3 Q i 1 F TABLE 1: Amplitude and Shape Statistical Parameters 2.2.2. Wavelet Decomposition Energy We derive a set of features from Wavelet Decomposition Energy generated from a discrete Wavelet Transform [20]. Decomposition energy equation (Equation 1) and its results (see figure 1) are described below. E p (i ) log p (i ) , (1) i X (i ) 2 Where, p(i) and X (i ) is a samples of the decomposition signals. 2 i X (i ) International Journal of Computer Science and Security (IJCSS), Volume (4): Issue (3) 310
- 55. V. Joevivek, N. Chandrasekar & Y.Srinivas FIGURE 1: Energy difference between Earthquake and Non-earthquake signals The result in Figure 1 is a good example to show that level 1 and level 2 of earthquake and non- earthquake signals are well separable. Finally thirteen features have been developed from both statistical and wavelet decomposition energy. Next subsection illustrates SVM classifier mechanism. 2.3. SVM classifier In support vector machines, the learning machine is given a set of examples (training data) and its associated class labels. SVM tries to construct a maximally separating hyperplane between classes, thus by differentiating the classes [5]. The maximally separating linear hyperplane in support vector binary classifiers can be expressed as w T x 0 and two bounding hyperplanes can be expressed as wT x 1 and wT x 1 . The training data belonging to +1 class obey the constraint wT x 1 and the training data point belonging to -1 class obeys the constraint wT x 1 . However, there are cases where our training data points will be deviated from their respective bounding plane, such deviation of data points from their respective bounding planes are called as error. A positive quantity called ξ is added or subtracted to the training data that constitutes to error to obey the constraints. SVM aims at obtaining a maximum margin and minimum error classifier. General formulation of SVM is given in equation 2. m 1 min wT w C i w , , 2 i 1 subject to di (w T xi ) i 1 0, 1 i m The quantity i 0, 1 i m 1 T ensures maximum w w 2 margin, which is the reciprocal of the distance between the two bounding hyperplanes from the m origin. Minimization of the quantity ensures minimum error. The parameter ‘C’ controls the i 1 i International Journal of Computer Science and Security (IJCSS), Volume (4): Issue (3) 311
- 56. V. Joevivek, N. Chandrasekar & Y.Srinivas weightage for maximum margin requirement and sum of error. Maximum margin and minimum error are contradictory and the value ‘C’ controls these parameters to achieve optimum results. 3. EXPERIMENTAL WORK 3.1. Training The dataset contains two classes (earthquake and non-earthquake) of seismic signals with 200 feature vectors. We have analysed our training data using linear, polynomial and RBF kernels. Ten fold cross validation is done for training set and for best ‘C’ value and classification accuracy is calculated. Training results are listed below. Linear Kernel = 88.35% Polynomial Kernel = 94.68% RBF Kernel = 95.87% From the training results, it is found that RBF kernel gives a good training accuracy and the accuracy of polynomial kernel is comparable to RBF. Training accuracy of linear kernel seems to be less compared with the other two. In order to evaluate the effectiveness of our algorithm, classified results were compared with other well-known algorithms. Misclassification cases were given in Table 2. S.No Type of Number of Input Misclassification Time elapsed (S) classifier patterns cases 1 Euclidean 90 11 5.33 2 SVM 90 5 5.91 3 K-nn 90 8 13.52 4 Weighted 90 7 5.94 average TABLE 2: Algorithm Evaluation From the results in table 2, it is understood that SVM based classification gives good classification accuracy with less computational time. In other hand, Euclidean distance gives less classification accuracy with more computation time and also K-nn classifier takes more time to construct the rules. 3.2. Prediction The real time acquisition allows the recognition of the electrical precursors and their analysis well before the earthquake occurrence. Hence predictions are issued well in advance, which include estimation of the parameters such as epicenter, time and Magnitude of the impending. Main shock seismic signals can be recognized on a real time basis. Our database contains three years of real time seismic signals, from that 90 were chosen randomly. In first, STA/LTA ratio is calculated and optimum threshold values have been determined. STA/LTA is already well established technique so that detailed part of this algorithm is omitted. Based on STA/LTA threshold values, event locations were established. This technique predicted some false events due to higher threshold level. To improve these results, we applied Support Vector Machine classifier. The value ‘C’ controls the marginal parameters to achieve optimum results. In this application, the best value of ‘C’ for Linear kernel is 0.1 and Non-linear 0.01. Prediction of new class values is done using the SVM classifier for all the three kernels. Prediction results are: Linear Kernel = 85.11% International Journal of Computer Science and Security (IJCSS), Volume (4): Issue (3) 312
- 57. V. Joevivek, N. Chandrasekar & Y.Srinivas Polynomial Kernel = 92.88% RBF Kernel = 93.91% From prediction accuracy, it is found that RBF kernel performs much better, and the polynomial is nearly comparable. Linear kernel gives low percentage of accuracy compared with other two. Figure 2 illustrates step-by-step procedure of prediction process. FIGURE 2: (a) Noisy data, (b) STA/LTA result, (c) Prediction using SVM Figure 2(a) is a noisy signal which is emanated from sensors (raw data). Figure 2 (b) shown results obtained from STA/LTA algorithm. This figure illustrates three possible earthquake events based on STA/LTA threshold level (We obtained 0.5). But the result has produced two false predictions. In order to improve the performance we evaluated these results by SVM classifier. Figure 2 (c) shown optimum predicted results. SVM may prevent the overfitting problem and makes its solution global optimum since the feasible region is convex set. SVM classifier has been evaluated with 90 test samples and few of them we listed below (Table 3). S.No Magnitude Co-ordinates Event location Data acquisition time Prediction Lat Long USGS Station Result (N) (E) (UTC) (UTC) (hh:mm:ss) (hh:mm:ss) 1 3.4 19.0 84.4 Gajapathi district, 0:55:30 0:59:28 Correct Orissa 2 4.3 23.3 70.3 Kachchh, Gujarat 11:10:45 11:55:30 Incorrect 3 3.8 12.8 78.8 Vellore, Tamilnadu 18.5.23 18: 06:01 Correct 4 5.0 10.7 92.0 Andaman 18:5:5 18:08:43 Correct 5 4.9 10.6 92.2 Little Andaman 9:12:53 9:46:33 Incorrect 6 5.3 14.1 93.2 Andaman 19:39:50 19:43:32 Correct 7 3.4 8.29 76.59 Tiruvananthapuram 13:15:12 13:15:30 Correct TABLE 3. Prediction result The SVM classifier could detect the magnitude of very low ranging between 3 to 5.5 particularly the regions of Tamilnadu and Andaman. Whereas the magnitude of 4.9 could not be predicted by the SVM classifier due to the local explosives used in opencast limestone mining resulting heavy noise (see Table 3). To evaluate the prediction performance of this model, we compared its International Journal of Computer Science and Security (IJCSS), Volume (4): Issue (3) 313
- 58. V. Joevivek, N. Chandrasekar & Y.Srinivas prediction time with USGS record. The present method could also be validated through long term generated data with time and different earthquake magnitudes. The obtained results in the present method have showed good for prediction of small scale seismicity. 4. CONCLUSION The SVM classifier has been tested on different real seismic datasets and works well even when the S/N ratio is low. However, this greater reliability is achieved at the expense of speed. To validate the prediction performance of this model, we statistically compared its training accuracy with Euclidean, K-nn and Weighted average methods respectively. The results of empirical analysis showed that SVM outperformed the other methods. In the search of best kernels for SVM it is found that RBF kernel performs better. Some misclassifications occurred in Table 3 due to overlapping of local mining effect. The proposed algorithm would give the accuracy of 93.91% in the seismic events as cataloged earthquake of USGS record. Besides the continuous database in a specific location or other network station may enhance the prediction accuracy by using this classifier. We perceived a high reliability method to detect the seismic events as better as the classical algorithm such as STA/LTA. This research work is purely software approach and there by reduced the cost of expenditure in data analysis. 5. Acknowledgement The authors are highly thankful to Dr. B.K. Bansal, Adviser Seismology, Ministry of Earth Sciences, New Delhi, for his kind support to develop the manuscript. We also thank, the Department of Science and Technology and Ministry of earth science for providing the financial assistance under the project KANSCOPE (MOES/P.O/(SEISMO)/23/(577)/2005). 6. REFERENCES 1. R. Allen. “Automatic earthquake recognition and timing from single traces”. Bull. Seismological Soc. Amer., v.68: 1521-1532, 1978 2. A. Clark, Gregory Rodgers, W. Peter. “Adaptive Prediction Applied to Seismic Event Detection”. Proc. IEEE, v.69: 1166-1168, 1981 3. W. Freiberger. “An approximate method in signal detection”. Jour. Applied Math, v.20: 373-378, 1963 4. K. Fretcher, Sharon. “Walsh Transforms in Seismic event Detection”. IEEE Trans. Electromagnetic Compatibility, v.25, 1983 5. V.Joevivek, T. Hemalatha, K.P. Soman “Determining an Efficient Supervised Classification Algorithm for Hyperspectral Image” proceedings of ARTCOM (IEEE), pp. 384-386, 2009 6. Tom, Herrin, Eugence. “An Automatic Seismic Signal Detection Algorithm based on the Walsh Transform”. Bull. Seismological Soc. Amer., v.71: 1351-1360, 1981 7. D.J. Houliston, G. Waugh, J. Laughlin. “Automatic Real-Time Event Detection for Seismic Networks”. Computers & Geosciences, v.10: 413-436, 1984 8. H.S. Manjunatha Reddy, K.B. Raja “High Capacity and Security Steganography using Discrete Wavelet Transform” International Journal of Computer Science and Society, v. 3, International Journal of Computer Science and Security (IJCSS), Volume (4): Issue (3) 314
- 59. V. Joevivek, N. Chandrasekar & Y.Srinivas Issue 6, pp. 462-472, 2009 9. Kumar Satish, B.K. Sharma, Sharma Parkhi and M.A. Shamshi. “24 Bit seismic processor for analyzing extra large dynamic range signals for early warnings”. Jour. Scientific and Industrial Res., v.68: 372-378, 2009 10. T. Pavlidis. “Structural Pattern Recognition”. SpringerVerlag, Berlin, (1977) 11. Ping An. “Application of multi-wavelet seismic trace decomposition and reconstruction to seismic data interpretation and reservoir characterization”. SEG/New Orleans 2006 Annual Meeting. pp. 973-977, 2006 12. G. Richard, Shiavi, John R. Bourne.(1986): Methods of Biological Signal Processing. In Tzay Y. Young and KingSun Fu, editors, “Handbook of Pattern Recognition and Image Processing”, Academic Press, Orlando, Florida, chapter 22, pp. 545-568 (1986) 13. B.K. Sharma, Kumar Amod, V.M. Murthy. “Evaluation of Seismic Events Detection Algorithms”. Jour. Geol. Soc. India, v.75, pp.533-538, 2010 14. D. Stearns, Samuel Vortman, J. Luke. “Seismic Event Detection using Adaptive Predictors”. IEEE International conference on Acoustic, Speech and Signal Processing, USA, v.3, pp.1058-1061, 1981 15. K. Robert, Vincent, Zheng Zhizhen, Shen Ping; Zhang Shaofen. “ Wavelet-Packet Transformation Analysis of Seismic Signals Recorded from a Tornado in Ohio Bull”. Seismological Soc. Amer v. 92, no. 6, pp. 2352-2368, Aug.2002 16. K.S. Fu. Editor. “Syntactic Pattern Recognition, Applications”. SpringerVerlag, Berlin. Goforth, (1977) 17. K.S.W. Stewart. “Real time detection and location of local seismic events in central California” Bulletin of Seismological Soc. Amer, v. 67, pp. 433-452, 1977 18. A.Ahmed, M.L. Sharma, A. Sharma. “Wavelet Based Automatic Phase Picking Algorithm for 3-Component Broadband Seismological Data” JSEE: Spring and Summer, v. 9, no. 1,2, pp. 15-24, 2007 19. Abualgla Babiker Mohd, Sulaiman bin Mohd Nor. “Towards a Flow-based Internet Traffic Classification for Bandwidth Optimization” International Journal of Computer Science and Society, v. 3, Issue 2, pp. 146-153, 2009 20. Man-Kwan Shan “Discovering Color Styles from Fine Art Images of Impressionism” International Journal of Computer Science and Society, v. 3, Issue 4, pp. 314-324, 2009 21. G.T. Heydt, A.W. Galli. “Transient power quality problems analyzed using wavelets”. IEEE Trans. Power Delivery, vol. 12, no. 2: 908-915, Apr. 1997 International Journal of Computer Science and Security (IJCSS), Volume (4): Issue (3) 315
- 60. Bryan Sarazin & Syed Rizvi A Self-Deployment Obstacle Avoidance (SOA) Algorithm for Mobile Sensor Networks Bryan Sarazin [email protected] Department of Computer Science and Engineering University of Bridgeport Bridgeport, 06601, USA Syed S. Rizvi [email protected] Department of Computer Science and Engineering University of Bridgeport Bridgeport, 06601, USA Abstract A mobile sensor network is a distributed collection of nodes, each of which has sensing, computing, communicating, and locomotion capabilities. This paper presents a self-deployment obstacle avoidance (SOA) algorithm for mobile sensor networks. The proposed SOA algorithm provides full coverage and can be efficiently used in a complex, unstable, and unknown environment. Moreover, the SOA algorithm is implemented based on the assumption that nodes are randomly deployed near the sink where each node knows the location of the target. In proposed SOA algorithm, the nodes determine a partner node and link up effectively to form a node pair. A node pair which is closest to the target searches for the target with all other node pairs following the previous node. There are number of priority rules on which the mobility of sensor nodes is based. The SOA algorithm ensures that the nodes determine a path around any obstacles. Once a connection is established from the sink to the target, the node pair separates and starts providing the full coverage. The experimental verifications and simulation results demonstrate that the proposed algorithm provides three main advantages. First, it reduces the total computation cost. Second, it increases the stability of the system. Third, it provides greater coverage to unknown and unstable environment. Keywords: Mobile nodes, Mobile networks, Self deployment, Sensor networks. 1. INTRODUCTION The purpose of a mobile sensor network is to provide a reliable connection from sink to target and perform some form of information gathering. Wireless sensor networks provide different functions in a variety of applications including environmental monitoring, target tracking, and distributed data storage. A basic problem faced by the current sensor network is the need of an efficient deployment of sensor nodes that can provide the required coverage [1], [13]. In some situations, the tasks put forward higher requirements; they not only need a connection, but also require the connection to be efficient and secure. If the environment changes or a hostile environment can not guarantee the security of sensors, resulting in damage to sensors, or loss of contact with sensors, the entire system still has to ensure the realization of the most basic functions. International Journal of Computer Science and Security (IJCSS), Volume (4): Issue (3) 316
- 61. Bryan Sarazin & Syed Rizvi For instance, a mobile sensor network used in natural disaster relief such as earthquake, a safe route through hazardous terrain may need to be determined. The environment is complex and variable, and may continually change. There may be any number of unknown obstacles within this environment, with the possibility that they may shift or move. Therefore, in this defined area, we can not know the state of the environment, all sensors must be able to locate obstacles at run time and be able to negotiate them. The sensing and computation must be efficient [1] [2] since the response time is pressing in natural disaster relief. If it takes too long, the value of such a system is lost. This implies that, for each of the sensors to sense, perform computation, and then communicate with each other is inefficient [3] [11] [12]. Another case is in military applications such as target detection. The sensors should provide detection of the enemy in a given area. In this application, coverage is vital. If coverage criteria cannot be met, the enemy may not be detected, rendering the network virtually useless. There are a number of problems associated with current mobile sensor networks. For instance, how can nodes provide sensing capability, how do we make computation and locomotion efficient, and how do the sensors create a stable connection while providing coverage? The proposed SOA algorithm provides solution to these problems. First, we assume that all nodes are randomly deployed near the sink. Each node has a priority based on its relative position to the sink, the target, and all other nodes. The nodes interact with each other to construct node pairs based on priority where each node pair effectively moving as a single node. Only the node pair with the highest target priority begins moving towards the target. The node pair with the second highest target priority follows the first pair and so on. Each node pair stays within communication range of the pair with higher target priority and higher sink priority. Only the node pair with the highest target priority performs computation to determine movement while the other node pairs simply follow the pair with higher priority. The proposed SOA algorithm shows a significant reduction in the number of computations that each sensor node has to perform in order to locate the position – thus it provides an efficient and faster way to calculate the position. When the first node pair encounters an obstacle, it does three things. First, it calculates the range to the obstacle. Second, it determines the direction to avoid the obstacle. Third, it negotiates with the obstacle. Once the target is reached, the node pairs separate to provide coverage and connection reliability. We assume that the radius of the coverage area that each node provides is r whereas the amount of sensors in a combination (referred to as a pair) is assumed to be n. Taking these parameters into account, the whole mobile sensor network can cover an area of a width up to n*r. Coverage criteria may be met by defining the number of nodes paired together. We can control the distance of separation and adjust this distance to meet our requirements. One of the nodes can keep communicating with all surrounding nodes, ensuring the connection is maintained even during the separation period (i.e., it shows a strong connection). Otherwise, the node can maintain a connection with at least two other nodes. The strong connection can make the mobile sensor network more stable and secure, because if one of the nodes is destroyed, its neighboring nodes can maintain communication with the other nodes. The strong connection could be used in a hazardous environment, such as on a battle field or in natural disaster relief. In this environment, the nodes could be easily damaged, but the mobile sensor network is pivotal, so it must keep working despite the loss of nodes. 2. PROBLEM FORMULIZATION The goal of this research work is to develop an algorithm for self-deployment of a mobile sensor network which has the ability to build an uninterrupted wireless connection between the sink and the target while at the same time provides coverage to a certain area within an unknown environment. To achieve this goal, we use the moving algorithm for self-deployment of a mobile sensor network. International Journal of Computer Science and Security (IJCSS), Volume (4): Issue (3) 317
- 62. Bryan Sarazin & Syed Rizvi The moving algorithm is based on the connection built between multiple nodes, communication range, and the direction of movement of each node. Each node finds a suitable position in the unknown environment to ensure successful deployment. The nodes should have the ability to determine movement without needing a constant connection with other nodes. If the node has enough self-direction, it makes node communication more efficient because it does not need to maintain constant communication. Each node may only communicate with the other nodes within its communication range since the communication between nodes should be efficient as possible. However, each node has the ability to communicate with the sink via multi-hop communication. The nodes use this multi-hop communication system to report obstacle position if known, target position if known, and its own position. An obstacle may exist in one of the two possible states. The obstacle may be a safe distance from the node. In this case, the node broadcasts its location and keeps moving. In the other case, the obstacle is in the path of the node. The node broadcasts the location of the obstacle and navigates it. Self-organization allows the following nodes (i.e., nodes immediately behind the higher priority nodes) to navigate the obstacle without performing any computation (i.e., these nodes simply follow the path of a higher priority node). Before we present the proposed SOA algorithm, it is worth mentioning some of our key assumptions and notations we use in the proposed algorithm. Locomotion (i.e., each node has the capability of movement). Communication (i.e., each node can communicate with the other nodes within the communication rage). Observation (i.e., each node can detect potential obstacles and the target). Position detection (i.e., each node can detect its position such as using a GPS system) For the sake of the simulation results, we shall assume that the sink knows its position and the position of the target. This prevents the nodes from attempting to scan the entire environment in order to detect the target. We shall also assume that the target is detectable by each node and does not have the capability of movement. Also, we assume that the potential obstacles are present within the paths (i.e., no obstacle is too large to avoid). 3. MOVING AND PRIORITY RULES FOR SOA ALGORITHM Mobile sensor networks (MSNs) have received considerable research attention over the last decade because of their ease of deployment without the need of any fixed infrastructure [14]. Due to its highly dynamic nature and network topology, one of the fundament challenges in MSN is the design of self deployment algorithms that can enable the sensor nodes to organize themselves while at the same time maintain a consistent connection with the other deployed nodes and provide a coverage, so that the sensor nodes can communicate with each other within their respective communication range. Several self-deployment algorithms have been suggested for MSNs over the past few years [3] [9] [11] [15]. The proposed SOA algorithm is the extension of the obstacle avoidance algorithm proposed by Takahashi et. al [3]. However, our SOA algorithm differs from the algorithm proposed by [3] since the proposed SOA algorithm not only avoids the obstacles but also provides coverage to sensor nodes which is a significant improvement over the algorithm suggested by [3]. The algorithm is based upon a number of priority and moving rules. The priority rules for a node n establish the priority rules for all objects which include the sink, target, and all other nodes. These priority rules are as follows: International Journal of Computer Science and Security (IJCSS), Volume (4): Issue (3) 318
- 63. Bryan Sarazin & Syed Rizvi Priority rule I: priority-s is settled to the node which is nearest to node n and closer to the sink. If there are no nodes closer to the sink than node n, priority-s is settled to the sink. Priority rule II: priority-t is settled to the node which is nearest to node n and closer to the target. If there are no nodes closer to the target than node n, priorities-t is settled to the target. Priority rule III: It is not permitted that priority-t is settled to an object for which priority has already been settled. It should be noted that the stable connection area is defined as the area within which node n can effectively communicate. Taking this into consideration, the moving rules can be defined as follows: Moving rule I: Node n moves to the stable connection area of priority-s and keeps this condition. If node n cannot move to that area, it moves to the nearest position in the area it can reach. In this case, the Moving rule I is not satisfied. Moving rule II: Node n moves to the stable connection area of priority-t and keeps this condition with maintenance of Moving rule I. If node n cannot move to that area, node n moves to nearest position in the area it can reach. In this case, the Moving rule II is not satisfied. Moving rule III: The higher priority rule preferentially gets executed. Moving rule II is executed only after the Moving rule I is satisfied. Also, the obstacle avoidance algorithm used is the Virtual Force Field (VFF) [13] method. Any obstacle acts as a virtual repulsive force against any node once it has been detected. 4. SELF-DEPLOYMENT OBSTACLE AVOIDANCE (SOA) ALGORITHM We assume every node is initially deployed near the sink as shown in Fig. 1. FIGURE 1: Initial Deployment of Nodes. 4.1 Determination of Connection Priority First, the sink receives the position information of all nodes. Then the sink determines the relative distance between each node and the target, and each node and the sink. 4.2 Determination of Partner Node Each node determines its partner node based on Priority rule II. For instance, the node with the highest priority-t partners with the second highest priority-t (Fig. 2), this continues until all nodes are paired. Once two nodes are partnered, they are closed enough to assume that they can move as one pair node. International Journal of Computer Science and Security (IJCSS), Volume (4): Issue (3) 319
- 64. Bryan Sarazin & Syed Rizvi FIGURE 2: Formation of Node Pairs. Information node n has Relative Distance node ID number position to node n to target to sink target (Xt, Yt) D(t, n) - D(t, s) sink (Xs, Ys) D(s, n) D(s, t) - Node 1 (X1, Y1) D(1, n) D(1, t) D(1, s) Node 5 (X5, Y5) D(5, n) D(5, t) D(5, s) Node 3 (X3, Y3) D(3, n) D(3, t) D(3, s) Node n (Xn, Yn) - D(n, t) D(n, s) Node 2 (X2, Y2) D(2, n) D(2, t) D(2, s) Node 6 (X6, Y6) D(6, n) D(6, t) D(6, s) Table 1: Node n’s Information about Position and Relative Distance The distance (d) between two nodes, a and b, is shown using the following expression: d a,b = xa xb 2 + ya yb 2 where x and y are the x-axis and y-axis coordinates in the constellation diagram. The complete information and relative distance for an arbitrarily node n is shows in Table 1. 4.3 Decision of Moving Direction Each node pair moves toward its target based on the priority order. Based on the relative distance between the center point to the target, the node which is nearest to target gets the highest priority-t where as the node nearest to the sink gets the highest priority-s. The node determines its movement based on the location of the node-pair with higher priority-t. This location is determined as follows (see Fig. 3). xc xa d = (1) xb xa d a and ya yc d a = (2) ya yb d where r d= da = v (3) 2 All node pairs begin moving toward the target following the established moving and priority rules. The node pair with the highest priority-t moves directly toward target. The node pair with the second highest priority-t directly follows the highest priority-t node pair and so on (see Fig. 4). International Journal of Computer Science and Security (IJCSS), Volume (4): Issue (3) 320
- 65. Bryan Sarazin & Syed Rizvi FIGURE 3: Determination of Movement Direction. FIGURE 4: Setup of a Node Pair FIGURE 5: Navigation of an Obstacle by a Node Pair Fig.5 shows the navigation method that will be discussed later in detail. After each time interval, each node pair communicates its location, and each node pair recalculates its destination based on the calculations in (3) (4) and (5). The node pair with the highest priority-s can not break the link with the sink. When it reaches the stable connection edge, it moves to the nearest position in the area that it can reach without breaking the connection with the sink. International Journal of Computer Science and Security (IJCSS), Volume (4): Issue (3) 321
- 66. Bryan Sarazin & Syed Rizvi FIGURE 6a: Highest Priority-t Node Pair (A) Encounters Obstacle. The Next Node Pair (B) Simply Follows Node Pair A. FIGURE 6b: Node Pair A has Negotiated Obstacle. Node Pair B has Simply Followed A. When a node pair reaches the stable connection edge, it ceases movement in order to maintain its connection with the higher priority-t node pair, or the higher priority-s node pair, or both. When the highest priority-t node pair reaches the target the connection is built. 4.4 Obstacle Violation We shall assume the obstacle is rectangular in shape. When the node pair detects the obstacle it calculates the edge position. If the obstacle does not impede the path to the target, it broadcasts the obstacle’s location and continues moving. If the obstacle does block the path, the node pair attempts to move around it (Fig. 5). The node pair's direction of movement is parallel to the surface of obstacle while still close enough to detect the obstacle. The node pair continues to move this direction until it determines it can move safely in the direction of the target. The worst- case scenario occurs when obstacle runs perpendicular to the node pair's path to the target. The node pair moves around the obstacle in a predetermined direction. When the highest priority-t node pair changes its direction of movement, the path of the next node pair automatically updates. This occurs because each node pair follows the higher priority-t node pair (Fig. 6a and 6b). 4.5 Partner Separation The algorithm to determine separation is essential in order to ensure the full coverage and the ability to communicate with as many neighboring nodes as possible. After a connection between International Journal of Computer Science and Security (IJCSS), Volume (4): Issue (3) 322
- 67. Bryan Sarazin & Syed Rizvi FIGURE 7a: The Maximum Distance between Nodes is r. Node A can Communicate with Node B and Node C but not Node D. FIGURE 7b: Node A may Communicate with Node D. the target and the sink is built, the node pairs separate to cover more area and also create a more reliable connection. The maximum allowable separation distance r is defined by the communication range of the nodes. In Fig. 7a, node A can communicate with nodes B and C but not node D because its distance is greater than r. We can ensure node A may communicate with node D by reducing the distance between node A and node B and also node B and node D (see Fig. 7b for complete illustration). System parameters along with their definitions are presented in Table 2. Specifically, the distance between nodes A and B can be defined in (4) d b,c r (4) In order to achieve this, the distance from A to B must be: r d b,c = (5) 2 Using by the Pythagorean Theorem: International Journal of Computer Science and Security (IJCSS), Volume (4): Issue (3) 323
- 68. Bryan Sarazin & Syed Rizvi Parameters Definitions a Pa to Pb Distance from c Pc to Pb Distance from Pa Position of Node a defined by xa , ya Pb Position of Node b defined by xb , yb Pc Position of Node c defined by xc , yc Broadcast range of Node a ra Broadcast range of Node c rc TABLE 2: Definition of Parameters to Determine Separation 2 2 r r r= + (6) 2 2 Equation (6) gives ideal location of the separation node. It is calculated based on the location of node A and node C. The distance between node A and node B is displayed in (7) and the distance between node B and C should be no greater than r. In order to determine the location to which the separation node moves, a number of calculations are performed as follows: a 2 + h 2 = ra2 (7) c 2 + h 2 = rc2 (8) 2 ra2 rc2 + a + c a= (9) 2 a+ c a Pc Pa Pcenter = Pa + (10) a+c h yc ya xb = xcenter (11) a+ c h xc xa yb = ycenter (12) a+c and h yc ya xb = xcenter (13) a+c International Journal of Computer Science and Security (IJCSS), Volume (4): Issue (3) 324
- 69. Bryan Sarazin & Syed Rizvi FIGURE 8: Determination of Location which Separating Node should move. h xc xa yb = ycenter (14) a+c Finally, the direction of separation is based on the location of the obstacle. Equations (11) and (12) give two points for which the separation node may move. This movement of nodes is shown in Fig. 8. We can determine which point is based on their distance from the obstacle. The separation node moves to the point whose distance to the obstacle is less. Once the separation has taken place, this system has satisfied the requirements of the mobile sensor network. It has determined a safe path from the sink to the target, detected any obstacle in its path, and provided coverage of the environment. 5. EXPERIMENTAL VERIFICATIONS AND PERFORMANCE ANALYSIS This section presents the performance analysis of the proposed SOA algorithm. Before we present our simulation results, it is worth mentioning some of our key assumptions and simulation environment. 5.1 Simulation Environment The unknown environment is defined to be a square with sides equaling 800m. The origin point (0, 0) is located in the uppermost left corner. Each node is represented as a black square and both the sink and the target are represented by a larger square. The sink is designated by a blue square and the target is represented by a green square. A large obstacle is placed within the field, which is represented by a red square. Each node is capable of sensing and communicating within its communication range designated by r (in meters). Nodes may communicate with nodes outside of its range via a multi-hop communication system. For the simulation, the range is 80m. Each node also has the capability of movement which is designated by v (in meters). Simulation will capture data after each 1 m/s (i.e., time is simulated in 1 second intervals). The initial state of the environment is shown in Fig. 9 and Table 3. International Journal of Computer Science and Security (IJCSS), Volume (4): Issue (3) 325
- 70. Bryan Sarazin & Syed Rizvi FIGURE 9: Initial State of the Simulation Environment. Parameters Definitions Values n Number of mobile nodes 16 V Speed of mobile node 1.0(m/s) S Sink position (700,375) T Target position (10,375) D(S,T) Distance between sink and target 690m R Communication range 114m TABLE 3: Initial State of the Simulation Environment with Simulation Parameters 5.2 Symbols Definition A node is denoted by n. The sink is represented by S, the target T, and the obstacle O. Within the environment shown in Fig. 9, all objects are represented by an (x, y) grid coordinates. Coverage is the quality of service by which the wireless mobile sensor network is measured. The nodes must be placed as efficiently as possible within the environment so they may communicate with neighboring nodes and also provide maximum coverage. For the sake of simulation, the distance between nodes is the metric by which the system is evaluated. We examine the distance between a sample node and the node it follows during the deployment. We also examine the distance to the node following it. If this distance becomes greater than r at any point, the nodes have lost communication. Ideally, the distance between the nodes can be calculated using (5) as described earlier. Also, as the nodes separate, the distance of the separation node and its partner is important. The distance to neighboring node is equally important. If this distance exceeds r, communication between nodes is lost. 5.3 Simulation Results Our mathematical model was simulated using Java. We sampled the information from node 2 in 10 second intervals. In order to maintain communication with nodes 0 and 4, the distance cannot at any point be greater than 114 m. As shown in Appendix 1, the distance between nodes 0 and node 4 never exceeds that distance. From this, we can identify that node 2 has maintained communication with both nodes 0 and node 4 during the entire simulation. The distance information is illustrated in Fig. 10b and also presented in Table 4 (see Appendix 1). Also the distance between neighboring nodes should not exceed 114 m in order to maintain communication. In the final state of the simulation, this is achieved as shown in Appendix 1. A International Journal of Computer Science and Security (IJCSS), Volume (4): Issue (3) 326
- 71. Bryan Sarazin & Syed Rizvi FIGURE 10a: Simulation during Nodes Movement. state of the simulation is shown in Fig. 10a. The state of the simulation before node separation is shown in Fig. 11. Finally, the final state of the simulation is shown in Figure 12. 6. CONCLUSION & FUTURE WORK This paper presented a new algorithm that can effectively deploy the sensor nodes by avoiding obstacles (if any) between the source and target. The simulation results demonstrated that the self-deployment algorithm is successful. Moreover, the system is able to negotiate an unknown environment, an obstacle, detect a target, and deploy to provide maximum coverage of the environment. It ensures the connection between the nodes is not lost by maintaining the distance between the nodes. The proposed SOA algorithm is an improvement over current algorithms. By pairing the nodes at the beginning of the deployment, this allows the most efficient deployment time from the sink to the target. While other algorithms provide efficient deployment with regards to time, SOA algorithm provides this, and also increases the amount of coverage of the environment. Also, SOA algorithm ensures that a greater area of coverage can be achieved when the nodes separate. While other algorithms provide effective coverage of an environment, our FIGURE 10b: Distance Information for Node 2 during the Entire Simulation International Journal of Computer Science and Security (IJCSS), Volume (4): Issue (3) 327
- 72. Bryan Sarazin & Syed Rizvi FIGURE 11: State of Simulation before Node Pair Separation. FIGURE 12: Final State of Wireless Sensor Network. proposed algorithm ensures the ability to provide coverage quickly, by initially pairing nodes. It may be possible, in the future, to show that the mobile sensor network is more efficient when more nodes are added into the network. If more nodes are added to a node pair, it takes less of the networks resources to deploy the nodes. Only one node in the node pair must communicate and perform computation during the deployment of the network. Moreover, the proposed SOA algorithm provides fast deployment of nodes to targets since the priority after the pairing of nodes is to reach the target as efficiently as possible. 7. REFERENCES [1] Y. Liang, C. Weidong, X. Yugeng. “A review of control and localization for mobile sensor networks”. In Proceedings of the Sixth World Congress on Intelligent Control and Automation (WCICA 2006), pp. 9164-9168, Dalian, China, 2006. [2] T. Jindong, X. Ning. “Integration of sensing, computation, communication and cooperation for distributed mobile sensor networks”. In Proceedings of the IEEE International Conference on Robotics, Intelligent Systems and Signal Processing, pp. 54- 59, 2003. [3] J. Takahashi, K. Sekiyama, T. Fukuda. "Self-Deployment algorithm of mobile sensor network based on connection priority criteria". Proceedings of 2007 International Symposium on Micro-Nano Mechatronics and Human Science (MHS2007), pp. 564-569, 2007. [4] M. Singh, M. Gore. “A solution to sensor network coverage problem”. In Proceedings of the 2005 IEEE International Conference on Personal Wireless Communications, (ICPWC), pp. 77-80, January, 2005. International Journal of Computer Science and Security (IJCSS), Volume (4): Issue (3) 328
- 73. Bryan Sarazin & Syed Rizvi [5] R. Tynan, G. DavidMarsh, D. O'Kane. “Interpolation for wireless sensor network coverage”. In Proceedings of the Second IEEE Workshop on Embedded Networked Sensors, pp. 123- 131, 2005. [6] M. Cheng, L. Ruan, W. Wu. “Achieving minimum coverage breach under bandwidth constraints in wireless sensor networks”. In Proceedings of the 24th Annual Joint Conference of the IEEE Computer and Communications Societies, pp. 2638- 2645, 2005. [7] S. Ram, D. Majunath, S. Iyer, D. Yogeshwaran. “On the path coverage properties of random sensor networks”, IEEE Transaction on Mobile Computing, 6(5): 494-506, 2007. [8] P. Pennesi, C. Paschalidis. “Solving sensor network coverage problems by distributed asynchronous actor-critic methods”. In Proceedings of the 46th IEEE Conference on Decision and Control, pp. 5300-5305, 2007. [9] N. Aziz, A. Mohemmed, D. Sagar. “Particle swarm pptimization and voronoi diagram for wireless sensor networks coverage optimization” In Proceedings of the International Conference on Intelligent and Advanced Systems, pp. 961-965, 2007. [10] J. Kanno, J. Buchart, R. Selmic, V. Phoha, “Detecting coverage holes in wireless sensor networks”. In Proceedings of the 2009 17th Mediterranean Conference on Control and Automation, pp.452-457, Thessaloniki, Greece June 2009. [11] Y. Li and Y. Liu, "Energy saving target tracking using mobile sensor networks". In Proceedings of the IEEE International Conference on Robotics and Automation, pp. 674-679, April 2007. [12] S. Zhang, J. Cao, L. Chen, D. Chen. "Locating nodes in mobile sensor networks more accurately and faster". In Proceedings of the 5th Annual IEEE Communications Society Conference on Sensor, Mesh and Ad Hoc Communications and Networks, (SECON '08), pp. 37-45, San Francisco, CA, 2008. [13] J. Lu, T. Suda. "Differentiated surveillance for static and random mobile sensor networks. IEEE transactions on wireless communications, 7(11): 4411-4423, 2008. [14] A. Rai, S. Ale, S. Rizvi, A. Riasat. ”New methodology for self localization in wireless sensor networks”. Journal of Communication and Computer, 6(11): 37-44, 2009. [15] S. Rizvi and A. Riasat, “Use of self-adaptive methodology in wireless sensor networks for reducing energy consumption,” IEEE International Conference on Information and Emerging Technologies (IEEE ICIET-2007), pp. 1 – 7, July 06-07, 2007. International Journal of Computer Science and Security (IJCSS), Volume (4): Issue (3) 329
- 74. Bryan Sarazin & Syed Rizvi Time Distance to Node O Distance to Node 4 25 78.47 40.8 50 78.89 33.82 75 79.63 32.47 100 78.86 44.56 125 79.37 61.21 150 79.3 74.44 175 79.21 79.19 200 79.19 79.33 225 79.68 78.13 250 78.9 79.46 275 79.35 79.24 300 79.61 78.99 325 81.64 78.82 350 83.74 78.64 375 84 79.52 400 81.53 80.25 425 79.04 83.79 450 80.7 88.21 475 82.77 91.7 500 87.42 88.38 525 89.85 85.87 550 89.85 87.68 575 89.85 90.96 600 89.85 94.48 625 89.85 96.9 650 89.85 96.9 675 89.85 96.9 700 89.85 96.9 725 78.85 91.9 750 78.85 78.9 775 78.85 78.9 800 78.85 78.9 825 78.85 78.9 850 78.85 78.9 875 78.85 78.9 900 78.85 78.9 925 78.85 78.9 950 78.85 78.9 975 78.85 78.9 1000 78.85 78.9 Appendix 1: TABLE 4: Distance Information for Node 2 International Journal of Computer Science and Security (IJCSS), Volume (4): Issue (3) 330
- 75. Ala'a M. Al-Shaikh Online Registration System Ala'a M. Al-Shaikh [email protected] Computer Department Institute of Public Administration (IPA) Dammam – Saudi Arabia Abstract Problem Statement: Enrolling students into the General Associate-Degree Examinations is a very difficult, critical, and important process. Students are required to pass this exam in Jordan to be given the Associate Degree in the filed of study they studied for 2 years. The exam is held 3 times per annum; annually, more than 15,000 students from different colleges all over the country apply to the exam. Managing all exam activities is a very complex and sophisticated process. In the old, conventional method, i.e. the manual registration system, communication between different parties working with exam activities is very difficult. Lack of technologies used in exam activities obstructs dealing with it in a modern and simplified way. Approach: The main outcome is to computerize everything related to the General Associate- Degree Examination. To do so, the Waterfall Model is to be used to study the new system requirements, analyze it, design, implement, and finally test and deploy it. Results: After the deployment of the new system and working with it, all the problems referred to were solved; this is done by adopting the Online Registration System which helped a lot in reducing the errors resulted in different ways and which in turn afferent the correctness of the exam itself. Conclusion/Recommendation: In conclusion a web-based tool was developed to computerize the required steps already expected by the system. As a further work, some features might be added, such as adding SMS support, adding AJAX functionality to the website to increase response time, and to create a bulletin board system, that might enable different parties working with the system to interact and communicate with each other easily. Keywords: Software Engineering, Web Development, Online Registration, Computerization, Corporate Web Portal, In-house Development. 1. INTRODUCTION In Jordan some students are enrolled in 2-year academic programs called the Associate-Degree Programs. To qualify for the associate degree, student should study the required curriculum relevant to each specialization; they must then apply for what so called the General Associate-Degree Examination (GADE), informally known as the Comprehensive Exam. Only students who pass the exam, i.e. GADE, are granted the Associate Degree in the specialization they studied for 2 years. 50 intermediate colleges, informally known as community colleges, work under the supervision of Al-Balqa' Applied University (BAU), this is according to the statistics of the Unit of Evaluation and General Examinations at BAU. Colleges are classified into the following types: 1. University colleges. 2. Public colleges. 3. Private colleges. 4. Military colleges. Table 1 lists the number of colleges according to their types. International Journal of Computer Science and Security (IJCS), Volume (4), Issue: (3) 331
- 76. Ala'a M. Al-Shaikh College Type Colleges University 14 Public 5 Military 6 Private 25 TABLE 1: Colleges in Jordan classified by type Colleges are grouped into moderates according to their geographical location. Currently, there are 13 moderates spread all around Jordan Table 2, lists all moderates and the number of colleges in colleges in each moderate. No. Moderate Name Colleges st 1 Amman 1 6 nd 2 Amman 2 8 rd 3 Amman 3 9 st 4 Irbid 1 6 nd 5 Irbid 2 4 6 Ajloun 1 7 Salt 2 8 Zerka 8 9 Kerak 1 10 Tafila 1 11 Ma'an 2 12 Aqaba 1 13 Granada 1 TABLE 2: List of moderates and number of colleges in each moderate 1.1 Problem Identification For the exam to take place, the unit of Evaluation and General Examination (UEGE), this is the unit responsible of running and administering the exam all over the kingdom in its different stages, must identify the following factors: 1. Total number of students who will attend the exam. 2. Number of student in each specialization. 3. Number of colleges whose students will attend the exam. 4. What papers the students will have exams on, so UEGE can start preparing the necessary questions of each paper. 5. The specific information about each student wishes to apply for the exam. This is to be verified and audited by UEGE to make sure all students are eligible to exam according to exam rules, regulations, legislations, and instruction. 6. Exam retakers can electively retake the exam in the papers they didn’t already pass during previous exam sessions. However, they keep their marks in the last exam session in which they didn’t' pass the exam. This should also be audited by UEGE. As long moderates, and thus colleges, are distributed in different geographical locations across the country, its very hard, maybe it's impossible, to collect an updated version of each of the previous factors at the time they are needed. Auditing and verifying exam-retaker mars prior to the start of the exam is very crucial. This requires a lot of time and effort by the Computer Staff at UEGE. Delivering this piece of data to UEGE by colleges in a late time may obstruct the running of the exam. The old, yet conventional method used to obtain the required data is to collect the statistics either by phone, fax, or e-mail. A UEGE's employee is named to the colleges as a coordinator; one of his/her responsibilities is to contact colleges and moderates to get the required statistics once they needed. The higher committee of General Examinations (HCGE) at BAU is responsible of issuing all the legislations to run the exam, which is held 3 times annually, they are the: Winter, Spring, and Summer sessions. HCGE is also responsible of specifying exam appointments either for the paper-based International Journal of Computer Science and Security (IJCS), Volume (4), Issue: (3) 332
- 77. Ala'a M. Al-Shaikh section or the practical one. Accordingly, the HCGE specifies the registration duration which allows students to apply for the exam. At the end of registration duration, UEGE start its final activities such as managing student seating in exam halls. Each student is given a Seat Number, which is a unique number, and it's used to identify the student on the coming exam activities. After the expiry of registration duration, college registrars are required to correct any errors that may appear during the registration phase. Thus, they make the necessary updates on their records, and send them in an MS-Excel file with a predetermined format to UEGE via one of the following methods: 1. E-mail. 2. Floppy Diskettes. 3. CD-ROMs. 4. Flash Memories. 5. Papers (Hard Copies) Finally, a unified MS-Excel file is complete, and it's named the Students' Base File. It contains detailed data about the students who will actually attend the exam; and it serves as the exam's database. To summarize, the conventional manual system suffers the following problems: 1. It's a hard method to communicate between UEGE and the colleges. 2. Inaccurate statistical data gathered from time to time due to its dependent on the time in which it's ordered. 3. Not all the colleges fill their students' data correctly or properly in the Excel files; neither they comply to the predetermined file format. 4. The method of data exchange between college registrars and UEGE is unsafe, in that storage media might be susceptible to corruption at any time. 1.2 The Proposed System The key solution to avoiding all the problems mentioned previously is to find a unified way to solve the problems mentioned earlier. The only unified way is by computerization. First, registrars should find a better way to communicate with UEGE; this could only be achieved by an Online Registration System. Since the whole country is connected to the Internet, it's very easy to make use of that feature to facilitate the way in which UEGE can monitor what's going on there in the colleges and detect errors during the registration process once they are entered to the system. Hence, there's no need to wait until the end of the registration duration to start auditing. Not only will the system be a registration system. In fact, Online Registration is a subsystem of the whole system. The system is a Web Portal. By definition, a Web Portal is a system that presents information from [1] diverse sources in a unified way . Contents of a portal may include reports, announcements, e-mail, [2] searches, etc . This portal is classified into a Corporate Web Portal, that is, it allows internal and external access to information specific to GADE. 1.3 Online-Registration Systems Several registrations systems are used in the Jordanian universities and colleges, some of them support the online registration features and some do not. Some of these systems were purchased by local or international software companies, and some are developed internally by the software development teams in the computer centers each in the relevant university or college. What makes this registration system almost distinguished when compared to others, is that it’s a Special-Purpose Registration System. First of all, the system is explicitly used to enroll students to exams, the General-Associate-Degree Examination (GADE); here, courses are grouped into collections called Exam Papers. International Journal of Computer Science and Security (IJCS), Volume (4), Issue: (3) 333
- 78. Ala'a M. Al-Shaikh An Exam Paper is a set of courses each with a definite number of questions, each question has a weight; courses of each specialty are grouped into papers each with a definite mark, when all-paper marks are added to each other final exam mark can be calculated. Secondly, this system is designated to examinations; no other system all over Jordan is used to enroll student for such a general examination. Purchasing a Ready-Made Application to manage GADE Activities will be impossible since GADE is the only examination in Jordan held for the Associate- Degree Students. Finally, this system is to be used by college registrars themselves not the students; most online registration systems in the market and the other that are applied in the other universities and colleges are used by the students themselves. 2. MATERIALS AND METHODS The proposed system is a 3-Tier web-based. 3-Tier Architecture is a Client/Server Architecture in which the user interface, functional process logic (business rules), computer data storage, and data [3] access are developed and maintained as independent modules, most often in different platforms . Fig. 1 shows a 3-Tier Architecture design. 2.1 The Database Layer The proposed system's database will be implemented using Microsoft SQL Server 2005. This layer provides high connectivity and availability, plus, it provides system developers with the ability to manage and administer their databases easily, especially using the Graphical User Interface (GUI) of its Management Studio. In addition to enabling developers to create their own stored procedures or use built-in system ones. International Journal of Computer Science and Security (IJCS), Volume (4), Issue: (3) 334
- 79. Ala'a M. Al-Shaikh FIGURE 1: 3-Tier Architecture Using MS-SQL Server 2005 as a Relational Database Management System (RDBMS) of the entire solution gives the user the ability to create Server-Side Cursors to iterate programmatically through different table records and manipulate them row by row. At development time, developers may need to process resulting records at the server without the need to use another programming language, i.e. by means of the built-in functionality of the RDBMS. Never forgetting the use of triggers to perform actions on data upon insertion, deletion, or updating. All of the previously mentioned features make MS-SQL Server 2005 a good environment to host the system's database. 2.2 The Application Layer As shown in Fig. 1, the Application Layer contains the User Interface (UI), Business Rules, and the Data-Access Components. In this system, .Net 2.0 framework is used to provide data access to the MS-SQL Server 2005 by the use of ADO.NET. All the accessing data code and business rules implementation was developed using Microsoft Visual Basic .NET; the code was written in files, each contains a class or more to handle the operations of web forms designed using ASP.NET. Internet Information Services (IIS) version 5.0 or later must run on the Application Server to enable the use of ASP.NET across it. 2.3 The Client Layer International Journal of Computer Science and Security (IJCS), Volume (4), Issue: (3) 335
- 80. Ala'a M. Al-Shaikh The simplest client must have a PC, preferably running Windows XP as an operating system, with Internet Explorer (IE) installed to enable the users to browse the website over the Internet. As a web-based application, all processing is done on behalf of the users' computers on the server hosting the system. So, other operating systems such as Linux, UNIX, Mac OS, etc. might be acceptable as client machines. 2.4 Process Model The Software Development Process used in this system is the Waterfall Model shown in Fig. 2. The Waterfall Model was chosen because of the fact that system requirements are well understood and [4] won't change during system development . FIGURE 2: The Waterfall Model. Actually, this system is designed, developed, and implemented by the Computer Staff at UEGE, so all requirements are made by UEGE itself, which are already clear by 95% prior to starting. 2.5 System Overview Fig. 3 shows the context diagram of the proposed system. FIGURE 3: System's Context Diagram International Journal of Computer Science and Security (IJCS), Volume (4), Issue: (3) 336
- 81. Ala'a M. Al-Shaikh [5] The Context Diagram is an overview of the system that shows its basic inputs/outputs . 2.6 System Use Case Diagram Use Case Diagram is a graphical representation that describes how users will interact with the [6] proposed system . Fig. 4 shows the Use Case Diagram of the proposed system. FIGURE 4: Use Case Diagram of the Proposed System. 3. RESULTS This system comprises a number of subsystems (smaller systems) that integrate together to form the overall system requirements and functionality. 3.1 Registration Subsystem This is the main and the most important subsystem of the web portal which is depicted in Fig. 5. The main reason led to think in a computerized system to manage GADE's activities was to solve the registration problems, improve communication methods between college registrars and UEGE, and to monitor what's going on there in the colleges during the registration duration trying to catch any exceptional cases. International Journal of Computer Science and Security (IJCS), Volume (4), Issue: (3) 337
- 82. Ala'a M. Al-Shaikh FIGURE 5: Online-Registration's Sequence Diagram. Students wishing to apply to GADE must visit the college's registrar to fill an application form with the required data. The registrar must enter student's data, as filled by the student, into the system's database, by means of the data-entry screen designed for this purpose. After completing the data entry process by the registrar, the system issues a registration receipt; this has to be passed to the student as a proof of registration. The student sings on the two copies of the receipt, hence, it's used from now on as a statement from the student that the data entered to the system by the registrar was correct, in addition to the first reason mentioned earlier. International Journal of Computer Science and Security 338
- 83. Ala'a M. Al-Shaikh Actually, the registration process is not that easy, on the contrary, it's a very vital and crucial component of the system, despite the fact that it's transparent to the end user (registrar). The user enters the student data to the system, and gets two things as a feedback, they are a confirmation from the system to assure that the student was enrolled into the exam, and an exam receipt to be passed to the student as mentioned earlier. But, what goes inside is a complex, yet critical set of operations depicted in Fig. 5, which shows the Sequence Diagram of the Online-Registration Process. The Sequence Diagram shows system [7] objects and how they interact with each other and the order in which these interactions occur . 3.2 Reporting Subsystem Another important aspect of the system is that it provides a reporting subsystem for three different parties dealing with the system, they are: 1. College Registrars. 2. Moderate Exam Coordinators. 3. UEGE Administration. Now, it's easy for each college registrar to know how may students applied for the exam, the fees required from each student, and the papers in which the student will have the exam in. For Moderate Exam Coordinators it's now clear to them how many students will apply for the exam in their moderates, so they can make the necessary calculations regarding each college's fees. Plus, they are now able to know how many halls they will have in the moderate to manage student seating in them, how many labs are needed to be reserved for the purposes of the practical exam, and they'll be able to know what specializations student will have exams in. 3.3 Repository Subsystem By looking to the System's Use Case shown in Fig. 4, it's clear that there are three means of communication between system users and UEGE. The first communication method is by using the reporting subsystem which issues different types of reports as demanded. Another method is by the news updates done by system's administrator, and viewed by registrars. The last method, and it's the most important communication method, is by using the System Repository (Repository Subsystem). Repository Subsystem and System Repository will be used interchangeably henceforth. System Repository is a tool that enables users to download files necessary for managing GADE activities. Such files include the study plans for different Associate-Degree programs and specialties. They also include course-to-paper mapping for each specialty, which acts as a guide to let examinees know how courses they studied are distributed among exam papers, and the weight of each paper (paper full mark and minimum passing mark). Also, they include the files that describe what skills are required for the student to have to be eligible to the practical exam in his/her specialty. As depicted in the Use Case shown in Fig. 4, users of the system may also link to the latest regulations and legislations issued by HCGE, plus they can also download exam appointments, whether for the paper-based or the practical exam. Files are uploaded to the website by a user with administrative privileges, the System Administrator. The website refers to them as links in the various menus as will be shown later. Files uploaded to the system have different formats, such as: 1. Portal Document Format (PDF), this is the most widely used format in this website since it's been read the same by different operating systems. 2. MS-Word Documents (DOC). International Journal of Computer Science and Security (IJCS), Volume (4), Issue: (3) 339
- 84. Ala'a M. Al-Shaikh 3. MS-Excel Spreadsheets (XLS). 4. Images (JPG, BMP, GIF, TIFF). 3.4 Database Design Fig. 6 shows the Entity-Relationship Diagram (ERD) of the system. FIGURE 6: System's ERD. 3.5 System Features The system utilizes Microsoft .NET 2.0 framework which provides it with the necessary components to build system components and objects, plus providing the system with the required data access components. This system was implemented using ASP.NET as the webpage design tool in combination with VB.NET as the technology that provides the necessary coding behind the ASP.NET pages. The application connects to a Microsoft SQL Server 2005 database, which plays the role of the RDBMS associated with the application. Users of the system, whether they are registrars or UEGE employees, can run the application through their Internet browser, such as Microsoft Internet Explorer (IE) version 6.0 or later. To do this, the application is hosted on a Windows 2000 Server machine with Internet Information Services (IIS) 5.0 or later installed. 3.6 Implementation International Journal of Computer Science and Security (IJCS), Volume (4), Issue: (3) 340
- 85. Ala'a M. Al-Shaikh The system was developed and implemented successfully resulting in the following set of web pages; noting that what's listed below is a brief of the entire solution, in the same time they provide full functionality of the overall system. 3.6.1 Login Screen: Fig. 7 shows the login screen. As shown in the figure, the user must enter a valid User Name and a Password; once they are matched the user can enter the system. FIGURE 7: The Login Screen. 3.6.2 The Main Menu: Fig. 8 shows the menu items that enable the user to makes choices for using which subsystem of the overall system. FIGURE 8: System's Main Menu. 3.6.3 Online Registration Subsystem: Fig. 9 shows the webpage that lets a registrar choose the classification of the student desired to enter the system. International Journal of Computer Science and Security (IJCS), Volume (4), Issue: (3) 341
- 86. Ala'a M. Al-Shaikh FIGURE 9: Student-Classification-Selection Screen. Fig. 10 shows one of the registration pages, using this page a registrar can enroll a student of Classification-R (Regular Student) to the system. FIGURE 10: Online Registration Screen. After registration completes, the Registration Receipt show in Fig. 11 is how and printed out to be passed to the student. International Journal of Computer Science and Security (IJCS), Volume (4), Issue: (3) 342
- 87. Ala'a M. Al-Shaikh FIGURE 11: Registration Receipt. 3.6.4 Reporting Subsystem: Different types of reports are implemented in the system. They are briefly shown below. FIGURE 12: College Registration Report. The page shown in Fig. 12 displays to the college registrar a list of the students enrolled into the exam in his/her college. At the top of the page there is a combo box that enables the user to iterate through different specialties to filter his/her selection. Also, at the top-left of the page there are a International Journal of Computer Science and Security (IJCS), Volume (4), Issue: (3) 343
- 88. Ala'a M. Al-Shaikh number of six check boxes that enable the user to filter student selection by paper requesting to apply for. Fig. 13 displays Exam Moderate's Report. It's also contains the specialty combo box, and the six- paper check boxes. Plus, it also includes a combo box with a list of colleges working in the exam moderate of the college currently logged in. FIGURE 13: Moderate Registration Report. The report shown in Fig. 13 is only shown if user of the system is identified as a moderate coordinator. 3.6.5 System Repository: The System Repository lists the files required. Fig. 14 shows a listing of Course-to-Paper Mapping. FIGURE 14: Course-to-Paper Mapping from the Systems' Repository. International Journal of Computer Science and Security (IJCS), Volume (4), Issue: (3) 344
- 89. Ala'a M. Al-Shaikh 4. DISCUSSION By using the system, most problems used to be faced by the UEGE's administration and college registrars were now eliminated. This is done by the means of the Online Registration Subsystem, which allows students to enter to the system immediately once they fill the required application form. Now, there's no need to the coordinator to make long calls to get the number of students currently enrolled into the exam. Plus, by monitoring the instantaneous insert/update/delete operations done by the system, UEGE's administration can detect any type of errors that may enter the database immediately once they occur. Also, there's no need now for other activities to wait the end of the registration duration, since the Reporting Subsystem give the administration the necessary let them predict approximate student numbers, specializations, and colleges they came from. Finally, using paper and fax correspondence have been deducted by 100%. Thanks for the Repository Subsystem which allows System Administrator to upload the necessary files immediately to the system and announce their upload to the users by the news bar associated with this application. 5. CONCLUSION A web-based application was designed, developed, and implemented as a web portal that enables different parties working with Associate-Degree General Examination to benefit from. As a proposed future work on this system, the following points should be taken into consideration: 1. Short Messaging Service (SMS): this is a very important service the system must include. Briefly, student cell-phone numbers are currently stored into the system's database. This predetermined feature allows us to build on, to come out with a subsystem that enables the system to send news to students, such as their Seat Numbers, exam appointments, new regulations and legislations, and probably their results. 2. Online Student Registration: to make it much easier for the college registrars, students might have been given an access to the website wherever they are; they are requesting to be enrolled into the exam, the request status stays pending until verified and audited by the registrar. 3. Upgrading the system to support AJAX (Asynchronous JavaScript and XML): this reduces the load time of each page, and thus makes interacting with the system much easier and faster. 4. Customized Reports: as a further future work, colleges might be granted some administrative privileges on the system to allow them to manage the reports they need, so that the system never controls the way and format in which reports are displayed, but each college or moderate can customize a set of reports as they are seen appropriate to their usage. 5. Bulletin Board: instead of using a the news bar at the main page of the website, a bulletin board might be built as a bidirectional communication method between system users and UEGE. REFERENCES th 1. WIKIPEDIA, The Free Encyclopedia, cited on 7 July 2009, http://en.wikipedia.org/wiki/web_portal. 2. Indiana University, Information Technology Services, Knowledgebase, What is a web portal? Cited on 18th May 2009, http://kb.iu.edu/data/ajbd.html. th 3. WIKIPEDIA, The Free Encyclopedia, Multitier Architecture, cited on 29 April 2009, http://en.wikipedia.org/wiki/multitier_architecture. th 4. SOMMERVILLE I., Software Engineering, 7 Edition, 2004, ISBN: 0-321-21026-3, Pearson Education Limited, pp. 68. th 5. KENDALL & KENDALL, Systems Analysis and Design, International Edition, 5 Edition, 2002, ISBN: 0-13-042365-3, Pearson Education, Inc., pp. 245. 6.SPARX SYSTEMS, UML Tutorial, cited on 25th May 2009, http://www.sparxsystems.com/uml- tutorial.html. th 7. IBM, UML's Sequence Diagram, cited on 25 May 2009, http://www.ibm.com/developerworks/rational/library/3101.html. International Journal of Computer Science and Security (IJCS), Volume (4), Issue: (3) 345
- 90. Renu Mishra, Inderpreet Kaur & Sanjeev sharma New trust based security method for mobile ad-hoc networks Renu Mishra [email protected] Sr.Lecturer/ GCET/CSE Gr Noida, 201306, India Inderpreet Kaur [email protected] Sr.Lecturer/ GCET/CSE Gr Noida, 201306, India Sanjeev sharma [email protected] School of IT RGTU Bhopal Bhopal,422001, India Abstract Secure routing is the milestone in mobile ad hoc networks .Ad hoc networks are widely used in military and other scientific areas with nodes which can move arbitrarily and connect to any nodes at will, it is impossible for Ad hoc network to own a fixed infrastructure. It also has a certain number of characteristics which make the security difficult. Routing is always the most significant part for any networks. We design a trust based packet forwarding scheme for detecting and isolating the malicious nodes using the routing layer information. This paper gives an overview about trust in MANETs and current research in routing on the basis of trust. It uses trust values to favor packet forwarding by maintaining a trust counter for each node. A node will be punished or rewarded by decreasing or increasing the trust counter. If the trust counter value falls below a trust threshold, the corresponding intermediate node is marked as malicious. . Keywords: MANETs, MAC-Layer, Security Protocol, Trust . 1. INTRODUCTION Trust management is a multifunctional control mechanism, in which the most important task is to establish trust between nodes who are neighbors and making a routing path. In general, trust management is interchangeably used with reputation management. However, there are important differences between trust and reputation. Trust is active while reputation is passive. We propose a Trust based forwarding scheme in MANETs without using any centralized infrastructure. This scheme presents a solution to node selfishness without requiring any pre-deployed infrastructure. It is independent of any underlying routing protocol. It uses trust values to favor packet forwarding by maintaining a trust counter for each node. A node is punished or rewarded by decreasing or increasing the trust counter. Each intermediate node marks the packets by adding its unique hash value and then forwards the packet towards the destination node. The destination node verifies the hash value and check the trust counter value. If the hash value is verified, the trust counter is incremented, other wise it is decremented. If the trust counters value falls below a predefined International Journal of Computer Science and Security (IJCS), Volume (4), Issue: (3) 346
- 91. Renu Mishra, Inderpreet Kaur & Sanjeev sharma trust threshold, the corresponding the intermediate node is marked as malicious. In this paper, we study about trust mechanism in the ad hoc networks and propose a trust evaluation based security solution. The rest of the paper is organized as follows. Section two discusses the routing protocol in the ad hoc networks. Section three presents the Trust mechanism. In section four, a trust evaluation based solution for the ad hoc networks is proposed. In the next section the conclusions and directions of future work are given in the last section. 2. ROUTING PROTOCOLS IN MANETs In the ad hoc networks, routing protocol should be robust against topology update and any kinds of attacks. Unlike fixed networks, routing information in an ad hoc network could become a target for adversaries to bring down the network. Existing routing protocols can be classified into mainly two types- proactive routing protocols and reactive routing protocols [7]. Proactive routing protocols such as Destination-Sequenced Distance- Vector Routing (DSDV) [5] maintain routing information all the time and always update the routes by broadcasting update messages. Due to the information exchange overhead, especially in volatile environment, proactive routing protocols are not suitable for ad hoc networks [7]. However, reactive routing is started only if there is a demand to reach another node. Currently, there are two widely used reactive protocols- Ad- hoc On-Demand Distance Vector Routing (AODV) and Dynamic Source Routing (DSR) which will be discussed later. But they all suffer from the high route acquisition latencies [7]. That is, messages have to wait until a route to destination has been discovered. Normally, reactive routing protocols include two processes- route discovery and route maintenance. In this paper, we propose to design a Trust-based Security protocol (TMSP) based on a MAC- layer, approach which attains confidentiality and authentication of packets in routing layer and link layer of MANETs, having the following objectives: Attack-tolerant to facilitate the network to resist attacks and device compromises besides assisting the network to heal itself by detecting, recognizing, and eliminating the sources of attacks. Lightweight in order to considerably extend the network lifetime, that necessitates the application of ciphers that are computationally efficient like the symmetric-key algorithms and cryptographic hash functions. Cooperative for accomplishing high-level security with the aid of mutual collaboration/cooperation amidst nodes along with other protocols. Flexible enough to trade security for energy consumption. Compatible with the security methodologies and services in existence. Scalable to the rapidly growing network size. FIGURE 1: Security at different levels International Journal of Computer Science and Security (IJCS), Volume (4), Issue: (3) 347
- 92. Renu Mishra, Inderpreet Kaur & Sanjeev sharma 2.1 Dynamic Source Routing DSR is a source rooting in which the source node starts and take charge of computing the routes [9]. At the time when a node S wants to send messages to node T, it firstly broadcasts a route request (RREQ) which contains the destination and source nodes’ identities. Each intermediate node that receives RREQ will add its identity and rebroadcast it until RREQ reaches a node n who knows a route to T or the node T. Then a reply (RREP) will be generated and sent back along the reverse path until S receives RREP. When S sends data packets, it adds the path to the packets’ headers and starts a stateless forwarding [9]. During route maintenance, S detects the link failures along the path. If it happens, it repairs the broken links. Otherwise, when the source route is completely broken, S will restart a new discovery. 2.2 Ad-hoc On-demand Distance-Vector It is similar to DSR when RREQ is broadcast over the network. When either a node knowing a route to T or T itself receives RREQ, it will send back RREP. The nodes receiving RREP add forward path entries of the destination T in their route tables. According to [9], there are many differences between DSR and AODV. Firstly, destination T in DSR will reply to all RREQ received while T in AODV just responds to the first received RREQ. Secondly, every node along the source path in DSR will learn routes to any node on the path. But in AODV, intermediate nodes just know how to get the destination. 3. TRUST MECHANISMs There is a common assumption in the routing protocols that all nodes are trustworthy and cooperative[4]. However, the fact is different. Malicious nodes can make use of this to corrupt the network. A lot of attacks such as man-in-the-middle, black hole, DOS may be deployed to destroy the network. As we discussed above, the nodes in MANETs are not as powerful as desk PCs and there is no fixed infrastructure. It is difficult to establish PKI. Even if PKI is in use, it is also needed to make sure the nodes are cooperative. Furthermore, sometimes other factors such as reliability and bandwidth are included in the route discovery besides the shortest path. Trust is introduced to solve the problems. However, there is no clear consensus on the definition of trust. Commonly, it is interpreted as reputation, trusting opinion and probability [4]. Simply, we can consider it as the probability that an entity performs an action as demanded. 3.1 Trust Properties According to [2, 6], there are four major properties of Trust: • Context Dependence: The trust relationships are only meaningful in the specific contexts [6]. • Function of Uncertainty: Trust is an evaluation of probability of if an entity will perform the action. • Quantitative Values: Trust can be represented by numeric either continuous or discrete values. • Asymmetric Relationship: Trust is the opinion of one entity for another entity. That is, if A trusts B, it is unnecessary to hold that B trusts A. 3.2 Trust classification and computation Trust is extracted from social relationship. When we have some interactions with somebody although not so much, a general opinion will be formed. However, if somebody is completely new for us and we have to do business with him, what should we do? Perhaps, there are some friends of ours knowing him. Then we collect their opinions. From the information gathered, we get our own choice. It is the same in MANETs. The trust in MANETs can be classified into two - First-hand trust and recommendation. Some- times, when there is not enough first-hand evidence, recommendation should be taken into consideration, too. The combination of the two will be the final trust. Of course, there are several methods to concatenate the two types of trust. One of them will be discussed in the following sections. International Journal of Computer Science and Security (IJCS), Volume (4), Issue: (3) 348
- 93. Renu Mishra, Inderpreet Kaur & Sanjeev sharma 3.3 Trust representation There are some different representations of trust. Basically, they can be divided into two categories-continuous and discrete numbers. It is also probable that different ranges can be adopted. There are two examples. • In continuous, trust values are represented in discrete levels ”V.High”, ”High”, ”Mid” and ”Low” which are in a decreasing order of trust. • In discrete, the trust value is a continuous real number in [-1, +1] where -1 denotes completely no trust, 0 complete uncertainty, +1 complete trust respectively. 4. PROPOSED SCHEME (TRUSTED ROUTING): In our proposed protocol, by dynamically calculating the nodes trust counter values, the source node can be able to select the more trusted routes rather than selecting the shorter routes. The routing process can be summarized into the following steps: 1. Discovery of routes: it is just like the route discovery in DSR. Suppose A starts this process to communicate with D. At the end, A collects all the available routes to D; 2. Validation of routes: Node A check the trust values of the intermediate nodes along the path. Assuming node B’s trust value is missing in A’s trust table or its trust values is below a certain threshold, put B into a set X; 3. During the transmission, node A updates its trust table based on the observations. When some malicious behavior is found, A will discard this path and find another candidate path or restart a new discovery. 4. Compute trust values for every node in X based on the trust graph. 5. Among all paths, A chooses the one with the max ( in=1pi) where n is the number of nodes along with path. Our protocol marks and isolates the malicious nodes from participating in the network. So the potential damage caused by the malicious nodes are reduced. We make changes to the AODV routing protocol. An additional data structure called Neighbors’ Trust Counter Table (NTT) is maintained by each network node. Let {Tc1, Tc2…} be the initial trust counters of the nodes {n1, n2…} along the route R1 from a source S to the destination D. Since the node does not have any information about the reliability of its neighbors in the beginning, nodes can neither be fully trusted nor be fully distrusted. When a source S wants to establish a route to the destination D, it sends route request (RREQ) packets. Each node keeps track of the number of packets it has forwarded through a route using a forward counter (FC). Each time, when node nk receives a packet from a node ni, then nk increases the forward counter of node ni FCni = FCni + 1, i=1, 2…… (1) Then the NTT of node nk is modified with the values of FCni . Similarly each node determines its NTT and finally the packets reach the destination D. When the destination D receives the accumulated RREQ message, it measures the number of packets received Prec. Then it constructs a MAC on Prec with the key shared by the sender and the destination. The RREP contains the source and destination ids, The MAC of Prec, the accumulated route from the RREQ, which are digitally signed by the destination. The RREP is sent towards the source on the reverse route R1.Each intermediate node along the reverse route from D to S checks the RREP packet to compute success ratio as, SRi = FCni / Prec (2) Where Prec is the number of packets received at D in time interval t1. The FCni values of ni can be got from the corresponding NTT of the node. The success ratio value SRi is then added with the RREP packet. The intermediate node then verifies the digital signature of the destination node stored in the RREP packet, is valid. If the verification fails, then the RREP packet is dropped. Otherwise, it is signed by the intermediate node and forwarded to the next node in the reverse route. When the source S receives the RREP packet, if first verifies that the first id of the route stored by the RREP is its neighbor. If it is true, then it verifies all the digital signatures of the intermediate International Journal of Computer Science and Security (IJCS), Volume (4), Issue: (3) 349
- 94. Renu Mishra, Inderpreet Kaur & Sanjeev sharma nodes, in the RREP packet. If all these verifications are successful, then the trust counter values of the nodes are incremented as Tci = Tci + δ1 (3) If the verification is failed, then Tci = Tci - δ1 (4) Where, δ1 is the step value which can be assigned a small fractional value during the simulation experiments. After this verification stage, the source S check the success ratio values SRi of the nodes ni. For any node nk, if SRk < SRmin, where SRmin is the minimum threshold value, its trust counter value is further decremented as Tci = Tci – δ2 (5) Which involve regulation of transmission by a centralized decision maker? A distributed access protocol makes sense for an ad-hoc network of peer workstations. A centralized access protocol is natural for configurations in which a number of wireless stations are interconnected with each other and some sort of base station that attaches to a backbone wired LAN. For all the other nodes with SRk > SRmin, the trust counter values are further incremented as Tci = Tci + δ2 (6) Where, δ2 is another step value with δ2 < δ1. For a node nk, if Tck < Tcthr, where Tcthr is the trust threshold value, then that node is considered and marked as malicious. If the source does not get the RREP packet for a time period of t seconds, it will be considered as a route breakage or failure. Then the route discovery process is initiated by the source again. The same procedure is repeated for the other routes R2, R3 tc and either a route without a malicious node or with least number of malicious nodes, is selected as the reliable route. Which involve regulation of transmission by a centralized decision maker. A distributed access protocol makes sense for an ad-hoc network of peer workstations. A centralized access protocol is natural for configurations in which a number of wireless stations are interconnected with each other and some sort of base station that attaches to a backbone wired LAN. The DCF sub layer makes use of a simple CSMA (carrier sense multiple access) algorithm. The DCF does not include any collision detection function (i.e. CSMA/CD). The dynamic range of the signals on the medium is very large, so that a transmitting station cannot effectively distinguish incoming weak signals from noise and the effects of its own transmission. To ensure smooth and fair functioning of the algorithm, DCF includes a set of delays that amounts a priority scheme. Figure 2: MAC frame format FC- frame Control, SC- sequence Control, Oct. - Octets D/I-duration/connection control, FCS-frame checks sequence. Frame control indicates the type of frame and provides control information. Duration/connection ID indicates the time the channel will be allocated for successful transmission of a MAC frame. Address field indicates the transmitter and receiver address, SSID and source & destination address. Sequence control is used for fragmentation and reassembly. International Journal of Computer Science and Security (IJCS), Volume (4), Issue: (3) 350
- 95. Renu Mishra, Inderpreet Kaur & Sanjeev sharma 5. CONCLUSION In this paper, we have proposed a trust based security protocol which attains confidentiality and authentication of packets in both routing and link layers of MANETs. It uses trust values to favor packet forwarding by maintaining a trust counter for each node. A node is punished or rewarded by decreasing or increasing the trust counter. If the trust counter value falls below a trust threshold, the corresponding intermediate node is marked as malicious Although trust is widely researched nowadays, there is not a consensus and systematic theory based on trust. The proposed solution tries to simulate human being's social contact procedure on decision-making and introduces it into the ad hoc networks. The perfect security solution is hard to reach. But the average security level (for a node) can be achieved as expectation based on accumulated knowledge and as well as the trust relationship built and adjusted. With this way, it could greatly reduce security threats. 6. REFERENCES FOR JOURNALS: [1] Rajneesh Kumar Gujral, anil kumar kapil, “A Trust Conscious Secure Route Data Communication in MANETS”, International Journal of Security (IJS) Volume: 3 Issue: 1,Pages: 9 – 15, 2009 FOR CONFERENCES: [1] Charles E. Perkins, Pravin Bhagwat ”Highly dynamic Destination- Sequenced Distance-Vector routing(DSDV) for mobile computers”, pages 234-244, In proceeding of the SIGCOMM ’94 Conference on Communications Architectures [2] Farooq Anjum,Dhanant Subhadrabandhu and Saswati Sarkar “Signature based Intrusion Detection for Wireless Ad-Hoc Networks: A Comparative study of various routing protocols” in proceedings of IEEE 58th Conference on Vehicular Technology, 2003. [3] Rajiv k. Nekkanti, Chung-wei Lee, ”Trust Based Adaptive On Demand Ad Hoc Routing Protocol”, ACMSE ’04, April2-3,2004, ACM 2004, pp88-93 [4] Mike Just, Evangelos Kranakis, ”Resisting Malicious Packet Dropping in Wireless Ad Hoc Networks”, IN proceeding of ADHOC-NOW 2003,pp151-163 [5] L.Abusalah, A.Khokhar,”TARP:Trust-Aware Routing Protocol”, IWCMC’06, July 3-6, 2006, ACM 2006, pp135-140 [6] Jigar Doshi, Prahlad Kilambi, ”SAFAR:An Adaptive Bandwidth-Efficient Routing Protocol for Mobile Ad Hoc Networks”, Proceeding of ADHOC-NOW 2003, springer 2003, pp12-24 [7] Yan L. Sun, Wei Yu, ”Information Theoretic Framework of Trust Modeling and Evaluation for Ad Hoc Networks”, 2006 IEEE, pp305-317 [8] Anand Patwardhan, Jim Parker, Anupam Joshi, Michaela Iorga and Tom Karygiannis “Secure Routing and Intrusion Detection in Ad Hoc Networks” Third IEEE International Conference on Pervasive Computing and Communications, March 2005. [9] Li Zhao and José G. Delgado-Frias “MARS: Misbehavior Detection in Ad Hoc Networks”, in proceedings of IEEE Conference on Global Telecommunications Conference,November 2007. [10] Tarag Fahad and Robert Askwith “A Node Misbehaviour Detection Mechanism for Mobile Ad-hoc Networks”, in proceedings of the 7th Annual PostGraduate Symposium on The Convergence of Telecommunications, Networking and Broadcasting, June 2006. [11] Chin-Yang Henry Tseng, “Distributed Intrusion Detection Models for Mobile Ad Hoc Networks” University of California at Davis Davis, CA, USA, 2006. [12] Bhalaji, Sivaramkrishnan, Sinchan Banerjee, Sundar, and Shanmugam, "Trust Enhanced Dynamic Source Routing Protocol for Adhoc Networks", in proceedings of World Academy Of Science, Engineering And Technology, Vol. 36, pp.1373-1378, December 2008 International Journal of Computer Science and Security (IJCS), Volume (4), Issue: (3) 351
- 96. M.B.Chandak, Dr.R.V.Dharaskar & Dr.V.M.Thakre Text to Speech Synthesis with Prosody feature: Implementation of Emotion in Speech Output using Forward Parsing M.B.Chandak [email protected] Department of Computer Science and Engineering Shri Ramdeoababa Kamla Nehru Engineering College, Nagpur, INDIA Dr.R.V.Dharaskar [email protected] Department of Computer Science and Engineering G.H.Raisoni College of Engineering, Nagpur, INDIA Dr.V.M.Thakre [email protected] Department of Computer Science and Engineering AMRVATI UNIVERSITY, Amravti, INDIA Abstract One of the key components of Text to Speech Synthesizer is prosody generator. There are basically two types of Text to Speech Synthesizer, (i) single tone synthesizer and (ii) multi tone synthesizer. The basic difference between two approaches is the prosody feature. If the output of the synthesizer is required in normal form just like human conversation, then it should be added with prosody feature. The prosody feature allows the synthesizer to vary the pitch of the voice so as to generate the output in the same form as if it is actually spoken or generated by people in conversation. The paper describes various aspects of the design and implementation of speech synthesizer, which is capable of generating variable pitch output for the text. The concept of forward parsing is used to find out the emotion in the text and generate the output accordingly. Keywords: Text to speech synthesizer, Forward Parsing, Emotion Generator, Prosody feature. 1. INTRODUCTION Prosody is one of the key components of Speech Synthesizers, which allows implementing complex weave of physical, phonetic effects that is being employed to express attitude, assumptions, and attention as a parallel channel in our daily speech communication. In general any communication is collection of two phases: Denotation, which represents written content or spoken content and Connotation, which represent emotional and attentional effects intended by the speaker or inferred by a listener. Prosody plays important role in guiding listener for speaker attitude towards the message, towards the listener and towards the complete communication event. [2,3,4] From listener point of view, prosody consists of systematic perception and recovery of speaker intentions based on: [3,4] International Journal of Computer Science and Security, Volume (4): Issue (3) 352
- 97. M.B.Chandak, Dr.R.V.Dharaskar & Dr.V.M.Thakre a) Pauses: To indicate phrases and separate the two words b) Pitch: Rate of vocal fold cycle as function of time c) Rate: Phoneme duration and time d) Loudness: Relative amplitude or volume. 2. ARCHITECTURE FOR PROSODY GENERATION The Figure 1, shows the basic architecture of prosodic generator and various elements of prosodic generation in TTS, from pragmatic abstraction to phonetic realization. The input of the prosody module in Figure 1; is parsed text with a phoneme string, and the output specifies the duration of each phoneme and the pitch contour. Before providing input to the prosody generator, the input is parsed and is converted into phonemes depending upon the key stokes involved in the characters present in the input. The standard phonetic vocabulary of English language is used in conversion of text to phoneme. The duration and pitch of each phoneme depends upon the content and context of the text [6,7]. For example in the context, the mood of conversation is happy, then pitch of the words is changed accordingly to allow listener to understand “happy” mood of the content. Similarly, if after some time period the mood and emotion in the text are changed, then words pronounced in voice format should be accordingly modified in pitch sense to generate the desired effects. Prosody has an important supporting role in guiding a listener’s recovery of the basic messages (denotation). Figure 1: Architecture of Prosody Generator. The various modules of Prosody Generator are described in detail as follows: 1) Speaking Style: Prosody depends not only on the linguistic content of a sentence. Different people generate different prosody for the same sentence. Even the same person generates a different prosody depending on his or her mood. The speaking style of the voice in Figure 1, can impart an overall tone to a communication. Examples of such global settings include a low register, voice quality (falsetto, creaky, breathy, etc), narrowed pitch range indicating boredom, depression, or controlled anger, as well as more local effects, such as notable excursion of pitch, higher or lower than surrounding syllables, for a syllable in a word chosen for special emphasis. The various parameter which influence the speaking Style are [8,9]: a. Character: Character, as a determining element in prosody, refers primarily to long- term, stable, extra-linguistic properties of a speaker, such as membership in a group and individual personality. It also includes socio-syncratic features such as a speaker’s region and economic status, to the degree that these influence characteristic speech patterns. In addition, idiosyncratic features such as gender, age, speech defects, etc. affect speech, and physical status may also be a background determiner of prosodic character. Finally, character may sometimes International Journal of Computer Science and Security, Volume (4): Issue (3) 353
- 98. M.B.Chandak, Dr.R.V.Dharaskar & Dr.V.M.Thakre include temporary conditions such as fatigue, inebriation, talking with mouth full, etc. Since many of these elements have implications for both the prosodic and voice quality of speech output, they can be very challenging to model jointly in a TTS system. The current state of the art is insufficient to convincingly render most combinations of the character features listed above.[5,7] b. Emotion: Temporary emotional conditions such as amusement, anger, contempt, grief, sympathy, suspicion, etc. have an effect on prosody. Just as a film director explains the emotional context of a scene to her actors to motivate their most convincing performance, so TTS systems need to provide information on the simulated speaker’s state of mind [11,12]. These are relatively unstable properties, somewhat independent of character as defined above. That is, one could imagine a speaker with any combination of social/dialect/gender/age characteristics being in any of a number of emotional states that have been found to have prosodic correlates, such as anger, grief, happiness, etc. Emotion in speech is actually an important area for future research. A large number of high-level factors go into determining emotional effects in speech. Among these are point of view (can the listener interpret what the speaker is really spontaneous vs. symbolic (e.g., acted emotion vs. real feeling); culture-specific vs. universal; basic emotions and compositional emotions that combine basic feelings and effects; and strength or intensity of emotion. We can draw a few preliminary conclusions from existing research on emotion in speech. Some basic emotions that have been studied in speech include: a) Anger, though well studied in the literature, may be too broad a category for coherent analysis. One could imagine a threatening kind of anger with a tightly controlled F0, low in the range and near monotone; while a more overtly expressive type of tantrum could be correlated with a wide, raised pitch range [7]. b) Joy is generally correlated with increase in pitch and pitch range, with increase in speech rate. Smiling generally raises F0 and formant frequencies and can be well identified by untrained listeners. c) Sadness generally has normal or lower than normal pitch realized in a narrow range, with a slow rate and tempo. It may also be characterized by slurred pronunciation and irregular rhythm. d) Fear is characterized by high pitch in a wide range, variable rate, precise pronunciation, and irregular voicing (perhaps due to disturbed respiratory pattern). 2) SYMBOLIC PROSODY It deals with two major factors: a) Breaking the sentence into prosodic phrases, possibly separated by pauses, and b) Assigning labels, such as emphasis, to different syllables or words within each prosodic phrase [2,3]. Words are normally spoken continuously, unless there are specific linguistic reasons to signal a discontinuity. The term juncture refers to prosodic phrasing—that is, where do words cohere, and where do prosodic breaks (pauses and/or special pitch movements) occur. The primary phonetic means of signaling juncture are: i. Silence insertion. ii. Characteristic pitch movements in the phrase-final syllable. iii. Lengthening of a few phones in the phrase-final syllable. iv. Irregular voice quality such as vocal fry The block diagram of the pitch generator decomposed in Symbolic and phonetic prosody is as shown in the Figure 2. International Journal of Computer Science and Security, Volume (4): Issue (3) 354
- 99. M.B.Chandak, Dr.R.V.Dharaskar & Dr.V.M.Thakre Figure 2: Pitch generator decomposed into Symbolic and phonetic prosody. The various components are described in detailed in the following discussion. 1. Pause: The main aim to insert pause in running text is to structure the information which is generated in the form of voice output. In typical systems, the reliable location which indicates the insertion of pause is pronunciation symbols [5]. In predicting pauses it is necessary to consider their occurrence and their duration, the simple presence or absence of a silence (of greater than 30 ms) is the most significant decision, and its exact duration is secondary, based partially on the current rate setting and other extraneous factors. The goal of a TTS system should be to avoid placing pauses anywhere that might lead to ambiguity, misinterpretation, or complete breakdown of understanding. Fortunately, most decent writing (apart from email) incorporates punctuation according to exactly this metric: no need to punctuate after every word, just where it aids interpretation 2. Prosodic Phrases: Based on punctuation symbols present in the text, commercial TTS systems are using the simple rules to vary the pitch of text depending on the prosodic phrases, for example if in the text comma symbol appears the next word will be in the slightly higher pitch than the current pitch [11]. The tone of particular utterance is set by using standard indices called as ToBI (Tone and Break Indices). These are standard for transcribing symbolic intonation of American English utterances, and can be adapted to other languages as well. The Break Indices part of ToBI specifies an inventory of numbers expressing the strength of a prosodic juncture. The Break Indices are marked for any utterance on their own discrete break index tier (or layer of information), with the BI notations aligned in time with a representation of the speech phonetics and pitch track. On the break index tier, the prosodic association of words in an utterance is shown by labeling the end of each word International Journal of Computer Science and Security, Volume (4): Issue (3) 355
- 100. M.B.Chandak, Dr.R.V.Dharaskar & Dr.V.M.Thakre for the subjective strength of its association with the next word, on a scale from 0 (strongest perceived conjoining) to 4 (most disjoint), defined as follows: [5] 3. PROSODIC TRANSCRIPTION SYSTEM This system is used to introduce the prosodic parameters to the tones used to generate the voice output. The system is so designed that it is capable of handling both qualitative and quantitative aspect of tones by generating necessary “curve” structure. The curve represents the final pitch used to tone the particular word. The tone is determined by calculating “TILT”. Following parameters are used to calculate “TILT” [11,12] starting f0 value (Hz) duration amplitude of rise (Arise, in Hz) amplitude of fall (Afall, in Hz) starting point, time aligned with the signal and with the vowel onset The tone shape, mathematically represented by its tilt, is a value computed directly from the f0 curve by the following formula: The label schemes for the syllable to calculate the TILT is as shown in the table. These labels identify the specific syllable and alter the tone based on the presence of the syllable. Sil Silence / Pause C Connection A Major Pitch accent Fb Falling boundary Rb Rising boundary Aft After falling boundary Arb Accent + Rising boundary M Minor accent Mfb Minor accent + Falling boundary Mrb Minor accent + Rising boundary L Level accent Lrb Level accent + Rising boundary Lfb Level accent + Falling boundary The likely syllable for “TILT” analysis in the contour can be automatically detected based on high energy and relatively extreme F0 values or movements. 4. DURATION ASSIGNMENT There are various factors which influence the phoneme durations. The common factors are a. Semantic and Pragmatic Conditions b. Speech rate relative to speaker intent, mood and emotion c. The use of duration or rhythm to possibly signal document structure above the level of phrase or sentence [5] d. The lack of a consistent and coherent practical definition of the phone such that boundaries can be clearly located for measurement One of the commonly used methods for Duration Assignment is called as Rule based method. This method uses table lookup for minimum and inherent duration for every phone type. The duration is rate dependent, so all phones can be globally scaled in their minimum duration for faster or slower rates. The inherent duration is raw material and using the specified rules, it may be stretched or contracted by pre-specified percentage attached to each rule type as specified and then it is finally added back to the minimum duration to yield a millisecond time for a given phone. International Journal of Computer Science and Security, Volume (4): Issue (3) 356
- 101. M.B.Chandak, Dr.R.V.Dharaskar & Dr.V.M.Thakre The duration of phone is expressed as Where dmin is the minimum duration of the phoneme, d is average duration of the phoneme and correction “r” is given by: For the case of N rules applied, where each rule has correction ri. At the very end, a rule may apply that lengthens vowels when they are preceded by voiceless plosives. The list of rules used for calculating duration as follows: Lengthening of final vowel and following consonant in prepausal syllables Shortening of all syllabic segments in non-prepausal positions Shortening of syllabic segments if not in a word final syllable Consonant in non word initial positions are shortened Un-stressed and secondary stressed phones are shortened Emphasized vowels are lengthened Vowels may be shortened or lengthened according to phonetic features of their context. Consonants may be shortened in cluster 5. PITCH GENERATION Since generating pitch contours is an incredibly complicated problem, pitch generation is often divided into two levels, with the first level computing the so-called symbolic prosody described in Section 2 and the second level generating pitch contours from this symbolic prosody. This division is somewhat arbitrary since, as we shall see below, a number of important prosodic phenomena do not fall cleanly on one side or the other but seem to involve aspects of both. Often it is useful to add several other attributes of the pitch contour prior to its generation, which is discussed in coming section. 5.1 Pitch Range: Pitch range refers to the high and low limits within which all the accent and boundary tones must be realized: a floor and ceiling, so to speak, which are typically specified in Hz. This may be considered in terms of stable, speaker-specific limits as well as in terms of an utterance or passage. 5.2: Gradient Prominence: Gradient prominence refers to the relative strength of a given accent position with respect to its neighbors and the current pitch-range setting. The simplest approach, where every accented syllable is realized as a High tone, at uniform strength, within an invariant range, can sound unnatural. 5.3: Declination Related to both pitch range and gradient prominence is the long-term downward trend of accent heights across a typical reading-style, semantically neutral, declarative sentence. This is called declination. 5.4: Phonetic F0: Micro prosody Micro prosody refers to those aspects of the pitch contour that are unambiguously phonetic and that often involve some interaction with the speech carrier phones. 6. BLOCK DIAGRAM OF FORWARD PARSING METHOD 6.1: Methodology: Parsing is a method of scanning the text, in order to determine various points such as content of text, context of text, frequency of particular word in the text etc. While finding out the emotions present in the text, it is necessary to determine context of text. The context of the text determines the current emotions present in the text and also used to find variation in the emotion. Most of the International Journal of Computer Science and Security, Volume (4): Issue (3) 357
- 102. M.B.Chandak, Dr.R.V.Dharaskar & Dr.V.M.Thakre commercial available TTS are based on regular parsing in which the emotion present in the text is generated at the same time when the text is converted and represented in the voice form to the user. This approach followed in current text to speech synthesizers, generates delay, and reduces naturalness of the speech. [12] The basic requirement of the system is emotion present within the text should be known before hand so that it can be used to alter the pitch of the words present in the text. This will remove the delay component as well as the voice generated will be similar to natural voice. For example if the text is consist of three paragraphs, then, when the first paragraph is presented to user in voice format, scanning of next two paragraphs is performed, and emotion present in the paragraphs is derived. This emotion is then used as pitch alteration component and will act as intensifier. The intensifier may be high, low or neutral. The value of intensifier then can be used to alter the pitch of the text present. To handle first paragraph, the pre-processing phase is performed on first paragraph, this pre-processing will scan the first paragraph and generates the emotion present within the first paragraph. 6.2: Architecture for implementing Forward Parsing The block diagram for implementing forward parsing is as shown in the figure. Figure 3: Architecture for Forward Parsing As shown in the figure 3, a Database is maintained, which contains the keywords and category of emotion to which it belongs. Following types of emotions are handled using the architecture. Anger, Joy, Surprise, Disgust, Contempt, Pride, Depression, Funny, Sorry, Boredom, Suffering, Shame The text is scanned and keywords present in the text are compared with the contents of database. The comparison will finalize the value of emotion. Once the type of emotion is fixed the information is supplied to the composer, which then composes the wave file based on value of emotion. The value of emotion is changed based on intensity of emotion in the text. For example if the text is I am happy: Then the intensity of emotion happy is normal and will be represented by <+> I am very happy: Then the intensity is increase and will be represented by <++> This methodology will help in varying the pitch of the keyword “happy”. 6.3: Prosodic Markup Language To incorporate the emotion component in the text and allow the synthesizer to determine the intensity of the particular word in the text following tags are designed and the text is modified For prosodic processing, text may be marked with tags that have scope, in the general fashion of XML. Some examples of the form and function of a few common TTS tags for prosodic International Journal of Computer Science and Security, Volume (4): Issue (3) 358
- 103. M.B.Chandak, Dr.R.V.Dharaskar & Dr.V.M.Thakre processing are discussed below. Other tags can be added by intermediate subcomponents to indicate variables such as accents and tones [10]. a. Pause or Break: These commands can accept absolute duration of silence in millisecond or relative duration of silence like large, medium or small. For example, a “,” (comma) in text may allow to pause for some duration and then continue the next part of text. b. Rate: This parameter controls the speed of output. The usual measurement is words per minute, which can be a bit vague, since words are of very different durations. However, this metric is familiar to many TTS users and works reasonably well in practice. c. Baseline Pitch: This parameter specifies the desired average pitch: a level around which, or up from which, pitch is to fluctuate. d. Pitch Range: It specifies within what bounds around the baseline pitch level line the pitch of output voice is to fluctuate. e. Pitch: This parameter commands can override the system’s default prosody, giving an application or document author greater control. Generally, TTS engines require some freedom to express their typical pitch patterns within the broad limits specified by a Pitch markup. f. Emphasis: This parameter emphasizes or deemphasizes one or more words, signaling their relative importance in an utterance. Its scope could be indicated by XML style tag. Control over emphasis brings up a number of interesting considerations. For one thing, it may be desirable to have degrees of emphasis [11]. The notion of gradient prominence— the apparent fact that there are no categorical constraints on levels of relative emphasis or accentuation—has been a perpetual thorn in the side for prosodic researchers. This means that in principle any positive real number could be used as an argument to this tag. In practice, most TTS engines would artificially constrain the range of emphasis to a smaller set of integers, or perhaps use semantic labels, such as strong, moderate, weak, none for degree of emphasis [15]. 7. RESULTS AND DISCUSSION In this paper, we have presented a high-quality English text-to-speech system. The system can transfer English text into natural speech based on part-of-speech analysis, prosodic modeling and non-uniform units. These technologies significantly improve the naturalness and quality of the TTS system. The system is also modularized for easily incorporating to many applications with speech output. The TTS designed is tested with 10 different set of documents, the output generated is compared with standard TTS commercially available. Following results are noted after performing the test. a. The TTS designed is more precisely determining the emotions in the text scanned and converted into voice format. b. The TTS designed is capable of shifting the emotions from one state to another with smooth transition, which can be noted while listening to the output generated. c. The matrix of emotions is generated for both TTS designed and standard commercially available TTS and it is found that the emotion recognized by TTS designed are on the higher side. d. Experimental results demonstrated that the intended emotions were perceived from the synthesized speech, especially “anger”, “surprise”, “disgust”, ‘sorrow”, “boredom”, “depression”, and “joy”. Future work includes incorporating voice quality in addition to prosody, compensating the duration of phonemes, and applying the proposed framework to other context factors.[11,12] 8. REFERENCEES [1] Bender, O., S. Hasan, D. Vilar, R. Zens, and H. Ney. 2005. Comparison of generation strategies for interactive machine translation. In Proceedings of the 10th Annual Conference of the European Association for Machine Translation (EAMT05), pages 33–40, Budapest International Journal of Computer Science and Security, Volume (4): Issue (3) 359
- 104. M.B.Chandak, Dr.R.V.Dharaskar & Dr.V.M.Thakre [2] Casacuberta, F. and E. Vidal. 2007. Learning finite-state models for machine translation. Machine Learning, 66(1):69–91. [3] Tom´as, J. and F. Casacuberta. 2006. Statistical phrase-based models for interactive computer-assisted translation. In Proceedings of the 44th Annual Meeting of the Association for Computational Linguistics and 21th International Conference on Computational Linguistics (COLING/ACL 06), pages 835–841, Sydney. [4] I. Titov and R. McDonald. 2008. A Joint Model of Text and Aspect Ratings for Sentiment Summarization. ACL-2008 [5] Allen, J., M.S. Hunnicutt, and D.H. Klatt, From Text to Speech: the MITalk System, 2007, Cambridge, UK, University Press. [6] J. Wiebe, and T. Wilson. 2002. Learning to Disambiguate Potentially Subjective Expressions. CoNLL-2002. [7] F. Casacuberta et al. Some approaches to statistical and finite-state speech-to-speech translation. Computer Speech and Language,18:25–47, 2004. [8] D. Jurafsky and J. H. Martin. Speech and Language Processing: An Introduction to Natural Language Processing, Computational Linguistics, and Speech Recognition. Prentice Hall PTR, Upper Saddle River, NJ, USA, 2000 [9] Fangzhong Su and Katja Markert. 2008. From word to sense: a case study of subjectivity recognition. In Proceedings of the 22nd International Conference on Computational Linguistics, Manchester [10] Andrea Esuli and Fabrizio Sebastiani. 2007. PageRanking wordnet synsets: An application to opinion mining.In Proceedings of the 45th Annual Meeting of the Association of Computational Linguistics, pages 424–431, Prague, Czech Republic, June [11] Hong Yu and Vasileios Hatzivassiloglou. 2003. Towards answering opinion questions: Separating facts from opinions and identifying the polarity of opinion sentences. In Conference on Empirical Methods in Natural Language Processing , pages 129–136, Sapporo,Japan. [12] B. Pang and L. Lee. 2004. A sentimental education: Sentiment analysis using subjectivity summarization based on minimum cuts. In (ACL-04), pages 271–278, Barcelona, ES. Association for Computational Linguistics [13] Laxmi-India, Gr.Noiida, March 2010. Development of Expert Search Engine for Web Environment. In International Journal for Computer Science and Security, pages 130-135, Vol 4. Issue 1, CSC Journals, Malaysia. [14] J. Yuan, J. Brenier, and D. Jurafsky, “Pitch accent prediction: Effects of genre and speaker,” in Proc. Interspeech 2005, Lisbon, Portugal, 2005. [15] V. Strom, R. Clark, and S. King, “Expressive prosody for unit-selection speech synthesis,” in Proc. Interspeech, Pittsburgh, 2006. International Journal of Computer Science and Security, Volume (4): Issue (3) 360
- 105. Olusegun Folorunso,Rebecca O. Vincent ,Adebayo Felix Adekoya & Adewale Opeoluwa Ogunde Diffusion of Innovation in Social Networking Sites among University Students Olusegun Folorunso [email protected] Department of Computer Science, University of Agriculture Abeokuta, Ogun State, Nigeria. Rebecca O. Vincent [email protected] Department of Computer Science, University of Agriculture Abeokuta, Ogun State, Nigeria. Adebayo Felix Adekoya [email protected] Department of Computer Science, University of Agriculture Abeokuta, Ogun State, Nigeria. Adewale Opeoluwa Ogunde [email protected] Department of Mathematical Sciences, Redeemer’s University (RUN), Redemption City, Mowe, Ogun State, Nigeria. Abstract Diffusion of Innovations (DOI) is a theory of how, why, and at what rate new ideas and technology spread through cultures. This study tested the attributes of DOI empirically, using Social networking sites (SNS) as the target innovation. The study was conducted among students of the University of Agriculture, Abeokuta in Nigeria. The population comprised of people already connected to one social networking site or the other. Data collection instrument was a structured questionnaire administered to 120 respondents of which 102 were returned giving 85% return rate. Principal Factor Analysis and Multiple Regression were the analytical techniques used. Demographic characteristics of the respondents revealed that most of them were students and youths. From the factor analysis performed, it was revealed the constructs: relative advantage, complexity, and observability of SNS do not positively affect the attitude towards using the technology while the compatibility and trialability of SNS does positively affect the attitude towards using the technology. The study concluded that the attitude of university students towards SNS does positively affect the intention to use the technology. Keywords: Diffusion of Innovation, Social networking sites, Adoption, Intention. International Journal of Computer Science and Security (IJCSS), Volume (4): Issue (3) 361
- 106. Olusegun Folorunso,Rebecca O. Vincent ,Adebayo Felix Adekoya & Adewale Opeoluwa Ogunde 1.0 INTRODUCTION Social networking sites (SNS) such as MySpace, Facebook, Cyworld, Bebo BlackPlanet, Dodgeball, and YouTube have attracted millions of users, many of whom have integrated these sites into their daily practices. A social network service focuses on building online communities of people who share interests and/or activities (Dwyer et al , 2007). The websites allow users to build on-line profiles, share information, pictures, blog entries, music clips, etc. After joining a social networking site, users are prompted to identify others in the system with which they have a relationship. The label for these relationships differs depending on the site-popular terms include "Friends," "Contacts," and "Fans." Most SNS require bi-directional confirmation for Friendship. Diffusion is defined as the process by which an innovation is adopted and gains acceptance by members of a certain community. A number of factors interact to influence the diffusion of an innovation (Lee, 2004). The four major factors that influences the diffusion process are the innovation itself, how information about the innovation is communicated, time, and the nature of the social system into which the innovation is being introduced (Rogers, 1995). The Diffusion of Innovation Theory (DOI) is used in this study to examine the factors influencing adoption of social networking sites innovation. The theory proposed five beliefs or constructs that influence the adoption of any innovation (Davis et al, 1989). These are relative advantage, complexity, compatibility, trialability, and observability. The essence of the use of these constructs is to empirically test part of DOI’s attributes with a view to exploring factors that brought about the adoption of the innovation of social networking sites (Penning and Harianto, 2007). Therefore in this paper, the constructs that could affect the adoption of these networking sites were studied. The theory of diffusion of innovation will therefore be extented to social networking among University students to determine the extent of use and acceptance with a view to knowing what could be done to prevent or allow the inhibition surrounding its use. Thus, it could be reasoned that the benefits of these sites would accrue to adopters when barriers to their diffusion and adoption are identified. The DOI theory was used in an attempt to model the adoption of social networking sites, so that the progression of its use could be anticipated and fully catered for. Hence, the study analyses the adoption of social networking sites among the University Students and their intention of using it with selected constructs such as relative advantage, complexity, compatibility, trialability, and observability. 2.0 RELATED WORKS The social networking sites associated to a particular region differs, hence the reason for joining these sites differs from one person to another. Although, social networking sites have been in existence for quite a while, its adoption in Africa has recently increased. Social networking sites are built for users to interact for different purposes like business, general chatting, meeting with friends and colleagues, etc. It is also helpful in politics, dating, with the interest of getting numerous advantages with the people they meet. Recently, the use of network sites has increased overtime in Africa with the improvement in technology and the use of mobile phone to surf the web and statistic have shown that 90% of people on the internet at one point in time or the other are visiting social network sites (Boyd and Ellison, 2007). In Africa, social networking sites is becoming widely spread than it has ever been before and it tends to be majorly accepted by the youths. Yet the widespread adoption by users of these sites is not clear, as it appears that people’s perception of this technology is diverse, which in turn affects their decision to actually trust these sites or not. Moral panic is a major problem to trusting the innovation (Adler and Kwon, 2002; Bargh and Mckenne, 2004). These one-directional ties are sometimes labelled as "Fans" or "Followers," but many sites call them Friends as well. The term "Friends" can be misleading, because the connection does not necessarily mean friendship in the International Journal of Computer Science and Security (IJCSS), Volume (4): Issue (3) 362
- 107. Olusegun Folorunso,Rebecca O. Vincent ,Adebayo Felix Adekoya & Adewale Opeoluwa Ogunde everyday vernacular sense, and the reasons people connect are varied (Boyd, 2004). Unsafe disclosure of information to both known and unfamiliar population, reputation of individuals, cyberbullying, addiction, risky behavior and contacting dangerous communities are issues affecting trust of SNS, though, it is adopted. The primary reason for its adoption may be unknown. There is obviously, a need to investigate the issue of adoption of social networking sites in this context, because the diffusion of the innovation of these sites can be specifically perceived by the users through their attitudes and actions. Many researchers have studied the Innovation diffusion theory, but none has applied it to Social networking sites. Among them are Lee (2004), who applied Everett Rogers’ innovation-diffusion model to analyze nurses’ perceptions toward using a computerized care plan system. Twelve nurses from three respiratory intensive care units in Taiwan voluntarily participated in a one-on- one, in-depth interview. Data were analyzed by constant comparative analysis. The content that emerged was compared with the model’s five innovation characteristics (relative advantage, compatibility, complexity, trialability, and observability), as perceived by new users. Results indicated that Rogers’ model can accurately describe nurses’ behavior during the process of adopting workplace innovations (Shao, 2007). Also, related issues that emerged deserve further attention to help nurses make the best use of technology. (Lee, 2004). The application of health information technology to improve healthcare efficiency and quality is an increasingly critical task for all healthcare organizations due to rapid improvements in IT and growing concerns with regard to patient’s safety. Oladokun and Igbinedium, (2009) presented a work on the adoption of Automatic Teller Machines (ATM) in Nigeria: An Application of the Theory of Diffusion of Innovation. The study tested the attributes of the theory of diffusion of innovation empirically, using Automatic Teller Machines (ATMs) as the target innovation. The study was situated in Jos, Plateau state, Nigeria. The population comprised banks customers in Jos who used ATMs. The sampling frame technique was applied, and 14 banks that had deployed ATMs were selected. Cluster sampling was employed to select respondents for the study. Data collection instrument was a structured questionnaire administered to 600 respondents of which 428 were returned giving 71.3% return rate. Principal Factor Analysis, and Multiple Regression were the analytical techniques used. The demographic characteristics of the respondents revealed that most of them were students and youths. From the factor analysis, it was revealed that the respondents believed in their safety in using ATM; that ATMs were quite easy to use and fit in with their way of life; that what they observed about ATMs convinced them to use it and that ATM was tried out before they use it. Zhenghao et al, 2009 worked on the 3G Mobile Phone Usage in China: Viewpoint from Innovation Diffusion Theory and Technology Acceptance Model. The paper analyzed the reasons behind Innovation Diffusion Theory (IDT) and Technology Acceptance Model (TAM) perspectives. Some suggestions were also given to 3G business operators and researchers. Others who researched on SNS include Boyd and Ellison (2007), who described features of SNS and propose a comprehensive definition for it. They presented a perspective on the history of social network sites, discussing key changes and developments. Ellison et al (2007) also examined the relationship between the use of Facebook, a popular online social networking site, and the formation and maintenance of social capital. In addition to assessing bonding and bridging social capital, they explored a dimension of social capital that assesses one's ability to stay connected with members of a previously inhabited community, which was called - maintained social capital. Regression analyses was conducted on results from a survey of undergraduate students (N=286), which suggested a strong association between use of Facebook and the three types of social capitals, with the strongest relationship being the bridging social capital. In addition, Facebook usage was found to interact with measures of psychological well-being, suggesting that it might provide greater benefits for users experiencing low self- esteem and low life satisfaction. Their results demonstrated a robust connection between Facebook usage and indicators of social capital, especially of the bridging type that Internet use alone did not predict social capital accumulation, but intensive use of Facebook did. International Journal of Computer Science and Security (IJCSS), Volume (4): Issue (3) 363
- 108. Olusegun Folorunso,Rebecca O. Vincent ,Adebayo Felix Adekoya & Adewale Opeoluwa Ogunde Dwyer et al, 2007 analysed an online survey of two popular social networking sites, Facebook and MySpace, compared perceptions of trust and privacy concerns, along with willingness to share information and develop new relationships. Members of both sites reported similar levels of privacy concern. Facebook members expressed significantly greater trust in both Facebook and its members, and were more willing to share identifying information. Even so, MySpace members reported significantly more experience using the site to meet new people. These results suggested that in online interaction, trust is not as necessary as the building of new relationships, as it is in face to face encounters. They also showed that in an online site, the existence of trust and the willingness to share information do not automatically translate into new social interaction. This study demonstrated online relationships can develop in sites where perceived trust and privacy safeguards are weak. 3.0 RESEARCH MODEL Figure 1 shows the research model. Relative advantage indicates the usefulness of an innovation; compatibility is the degree to which an innovation is perceived as consistent with existing values, past experiences, and the needs of the potential adopter; complexity is the degree to which an innovation is perceived as relatively difficult to understand and use; trialability is trying out or testing an innovation so that it makes meaning to the adopter; and observability is the degree to which the results of an innovation are visible to others. Relative Advantage H1 Complexity H2 H6 Compatibility Attitude Intention to use H3 Trialability H4 Observability H5 FIGURE 1: Research model The research model adopted in this study depicts what should occur given the constructs that was proposed by Rogers (1995) concerning the adoption of a technology. These constructs ought to affect the intention to use a particular innovation which in this case is Social Networking sites. Thus, the model indicates that the five constructs: relative advantage, complexity, compatibility, trialability and observability of using social network sites would affect the intention of the adopter to use these sites. The hypotheses proposed for this study are as follows: Ho1: The relative advantage of using social networking sites does not positively affect users’ attitude towards using the technology. International Journal of Computer Science and Security (IJCSS), Volume (4): Issue (3) 364
- 109. Olusegun Folorunso,Rebecca O. Vincent ,Adebayo Felix Adekoya & Adewale Opeoluwa Ogunde Ho2: The complexity of the use of social networking sites does not positively affect users’ attitude towards using the technology. Ho3: The compatibility of social networking sites with the adopter’s values does not positively affect users’ attitude towards using the technology. Ho4: The trialability of social networking sites does not positively affect users’ attitude toward using the technology. Ho5: The observability of social networking sites does not positively affect users’ attitude towards using the technology. Ho6: The attitude towards social networking sites does not positively affect users’ intention to use the technology. 3.1 Sample and Procedure The six attributes measured users’ perception regarding the advantage, trust and security of SNS to the University students and most especially the rate of adoption of the innovation. Relative advantage, complexity, compatibility, trialability, observability and trust were measured to access individual perceptions and adoption of effectiveness of the innovation. The survey subjects were mainly students in Nigerian Universities. A close-ended questionnaire was designed to collect relevant data on the relative advantage of using social networking sites, whether any complications had been encountered from the use of these sites, and on the suitability of using these sites with the belief system, moral and ethical values of the respondents. Information on how the experiences of the respondents with the use of social networking sites have affected their intentions regarding the continuous use the SNS technology. One hundred and twenty (120) questionnaires were administered to students in the University of Agriculture, Abeokuta in Nigeria, out of which a hundred and two were returned and eighteen were not returned. The percentage of the useable copies of the questionnaire was 85 percent. The profile of the respondent is shown in Table 1. Demographic Information of the Sample (n=102) Variables Frequency Percent (%) Gender Male 58 56.9 Female 44 43.1 Age Under 18 0 19-29 102 100 Period of use of Social network sites Less than a month 2 2.0 1-6months 16 15.7 6months to a year 28 27.5 1-2years 34 36.3 2-3years 12 11.8 Over 3years 7 8.67 How many friends in total do you have in all of your networking sites? 1-20 7 6.9 21-60 18 17.6 61-100 38 37.3 100+ 39 38.2 Do you believe visiting these sites is a waste of time? Yes 5 4.9 Maybe 29 28.4 No 68 66.7 TABLE 1: Demographic Information of the Sample (n=102) International Journal of Computer Science and Security (IJCSS), Volume (4): Issue (3) 365
- 110. Olusegun Folorunso,Rebecca O. Vincent ,Adebayo Felix Adekoya & Adewale Opeoluwa Ogunde As shown in Table 1, there were more males than females at 56.9% to 43.1%. All of the respondents were between the ages of 19-29 years. 3.2 Data Analysis and Results The data collected were analysed using Cronbach’s alpha which was to determine the internal consistency and reliability of the individual and multiple scales. Cronbach’s alpha was used in this study because every item in the questionnaire measured an underlying construct. Cluster sampling was adopted; this involved the division of the population into clusters or groups and drawing samples from the clusters. A cluster in this study was represented by the number of users who are parts of one social networking site or the other. The validity of the measures was verified by observing the correlations between the items on the various scales. All pre-existing constructs used in the diffusion theory met the criteria of validity and reliability except trust which is a newly introduced construct. Construct Cronbach’s No of items that make up Alpha the constructs Relative advantage 0.415 4 Complexity 0.359 3 Compatibility 0.754 3 Observabilty 0.320 3 Triability 0.562 3 TABLE 2: Reliability Test Table 2 showed the Cronbach’s alpha that was computed for the items that made up each construct used in this study. The alpha values for the 5 constructs (from 0.32 and 0.75) indicated that the items that formed them do not have reasonable internal consistency reliability. The items which were deleted had alpha values that were either lesser than 0.3 or higher than 0.75. Items lower than 0.3 might affect the consistency of the results of further analysis. Items with alpha values over 0.73 were probably repetitious or added up to be more than what was required for the construct. The scores used for the constructs in this study were standardized using SPSS package for the regression analysis. Tables 3 and 4 presents the result from the multiple regression carried out using the five constructs: Relative Advantages, Complexity, Compatibility, Observability, Trialability as the independent variables and Attitude as the dependent variable. This is done to determine the best linear combination of the constructs for predicting Attitude. International Journal of Computer Science and Security (IJCSS), Volume (4): Issue (3) 366
- 111. Olusegun Folorunso,Rebecca O. Vincent ,Adebayo Felix Adekoya & Adewale Opeoluwa Ogunde Model Sum of Df Mean F Sig. Squares Square Regression 2.917 5 .583 2.338 Residual 23.955 96 .250 0.48 Total 26.873 101 TABLE 3: ANOVA for the Constructs Unstandardized Standardized Collinearity Coefficients Coefficients Statistics Model B Std. Error Beta t Sig. Tolerance VIF 1 (Constant) 2.276 .533 4.269 .000 Relative Advantage -.028 .052 -.054 -.548 .585 .958 1.043 Trialability -.112 .050 -.217 -2.235 .028 .987 1.013 Compatibility .207 .092 .221 2.242 .027 .956 1.046 Observability .112 .080 .142 1.407 .163 .908 1.102 Complexity -.111 .080 -.140 -1.396 .166 .918 1.090 TABLE 4: Coefficient of the Constructs Table 4 presents the ANOVA report on the general significance of the model. As p is less than 0.05, the model is significant. Thus the combination of the variables significantly predicts the dependent variable. Table 5 shows the beta coefficients for each variable. The t and p values present the significance of each variable and their impact on the dependent variable (attitude). From table 4 only trialability and compatibility had significant impact on respondent’s attitude, with compatibility having the highest impact on attitude. The multiple regression equation for this analysis is given as Attitude = 2.276 – 0.28 (Relative Advantage) -0.112 (Trialability) +0.207 (Compatibility) + 0.112 (Observability) – 0.111 (Complexity) …(1) Tables 5, 6 and 7 present the result from the multiple regression carried out using Attitude as the independent variable and Intention as the dependent variable. This was done to determine the best linear combination of Attitude for the prediction of Intention International Journal of Computer Science and Security (IJCSS), Volume (4): Issue (3) 367
- 112. Olusegun Folorunso,Rebecca O. Vincent ,Adebayo Felix Adekoya & Adewale Opeoluwa Ogunde Model R R Square Adjusted Std. Error of R Square the Estimate a 1 .050 .003 -.007 .720 Predictors: (Constant), Attitude Dependent variable: Intent TABLE 5: Model Summary for attitude and intent Sum of Mean Model Squares Df Square F Sig. 1 Regression .132 1 .132 .254 .615a Residual 51.829 100 .518 Total 51.961 101 Predictors: (Constant), Attitude Dependent Variable: Intent TABLE 6: ANOVA for attitude and intent Unstandardized Coefficients Standardized Coefficients Model B Std. Error Beta T Sig. 1 (Constant) 1.248 .149 8.389 .000 Attitude .048 .094 .050 .504 .615 Dependent Variable: Intent TABLE 7: Coefficients for attitude and intent From table 6, it can be seen that R square value is very low; hence the variance in the model cannot be predicted from the independent variable, attitude. Table 7 gives the ANOVA test on the general significance of the model, as p is greater than 0.05, the model is not significant. Thus, attitude of the respondents cannot significantly predict the dependent variable, Intent. Table 7 International Journal of Computer Science and Security (IJCSS), Volume (4): Issue (3) 368
- 113. Olusegun Folorunso,Rebecca O. Vincent ,Adebayo Felix Adekoya & Adewale Opeoluwa Ogunde shows the coefficients of attitude, and from the table it can be seen that attitude has a very low impact on Intention, the small t value and corresponding large p-value shows this. The regression equation for this analysis consequently is: Intention = 1.248 + 0.048(Attitude). Test of Hypotheses Table 8 shows the result of the hypothesis tested against p values that were obtained from the above results. Variable Beta P Relative Advantage -0.54 P<0.05 Complexity -2.17 P<0.05 Compatibility 2.21 P<0.05 Observability 1.42 P<0.05 Triability -1.40 P<0.05 TABLE 8: Result of beta and p he decisions in respect of the hypotheses are Ho1: The relative advantage of using social networking sites does not positively affect users’ attitude towards using the technology. Accepted Ho2: The complexity of the use of social networking sites does not positively affect users’ attitude towards using the technology. Accepted Ho3: The compatibility of social networking sites with the adopter’s values does not positively affect users’ attitude towards using the technology. Rejected Ho4: The trialability of social networking sites does not positively affect users’ attitude toward using the technology. Rejected Ho5: The observability of social networking sites does not positively affect users’ attitude towards using the technology. Accepted Ho6: The attitude towards social networking sites does not positively affect users’ intention to use the technology. Rejected This is depicted by figure 2 below. International Journal of Computer Science and Security (IJCSS), Volume (4): Issue (3) 369
- 114. Olusegun Folorunso,Rebecca O. Vincent ,Adebayo Felix Adekoya & Adewale Opeoluwa Ogunde Relative Advantage H1 (-.054) H2 (-0.217) Complexity H3 (0.221) Attitude H6(0.0498) Intention to use Compatibility H4 (0.142) Trialability Observability H5 (-.140) Figure 2: Findings of the DOI constructs 4,0 DISCUSSION OF FINDINGS Relative Advantage (β = -0.54, p < 0.05) does not have significant positive effect on the attitude towards using social networking sites. From the responses, the advantages of using these sites do not make them prefer social network sites use to the previous one used. Some of these advantages include speed, efficiency, availability, ease of use, faith in the security of their personal information. The contribution of the Complexity construct (β = 2.21, p < 0.05) was not also significant to the model and hence not supported in this study. The complexity of a technology affects how well that technology diffuses in a social network system because if the technology is easy to use, more people are likely to adopt its use. Findings from this study suggested that social networking sites were not quite easy to use and are not more likely to be more widely adopted. The Compatibility construct (β = -1.40, p < 0.05) was found to positively contribute to the DOI model. This suggested that the compatibility of usage social networking sites to the lifestyle of the respondents was important. The use social networking sites now belong firmly to the modern way of doing things. The Observability construct (β = 1.42, p < 0.05) also have impact on the attitude towards the use of these sites. It also showed that people paid more attention to it than might have previously been the case. The Observability construct was not simply about watching others using the technology, but (as the results from the factor analysis revealed) involved perception and discernment, usually brought on by the influence of others. Of the five constructs, Trialability (β =- 0.217, p < 0.05) had the highest impact on the attitude towards using social networking sites, it was positively significant. The results implied that the respondents have attempted to try SNSs before adopting its use. This finding suggested that people just decide to adopt and use social networking sites after testing it. This could be because of their already perceived notions as to the advantages of using these sites. Since the construct is very significant in this study, it meant that potential adopters of these sites may well benefit from trial demonstrations as an introduction to using the technology. This would help eliminate uncertainty about social networking sites, improve confidence in its use and make its diffusion more widespread. International Journal of Computer Science and Security (IJCSS), Volume (4): Issue (3) 370
- 115. Olusegun Folorunso,Rebecca O. Vincent ,Adebayo Felix Adekoya & Adewale Opeoluwa Ogunde The Attitude (β = 0.050, p < 0.05) towards SNSs positively and significantly affected the Intention to use the technology. The low impact of Attitude on Intention to use social network sites expressed the importance of how Attitude could affect the Intention to use social networking sites. A positive attitude meant that a potential adopter or a past user of social sites would have the Intention to use it in future and vice versa. The contribution of Attitude to Intention in the DOI model has been in line with the findings of other studies such as those of Davis et al (1989). The findings showed that attitudinal dispositions do not have significant influence use of social network sites. All the five attitudinal constructs have strong influences on adoption and intention to use social networking sites. Complexity also does not have significant relationship with intention to use it. Analysis for compatibility revealed that the use of social networking sites was compatible with the lifestyle of the respondents. The study also revealed that the use of social networking sites is widespread and a current practice today because of its usefulness but because of its compatibility with users’ previous values. The implications of observability construct showed that the observations made by the respondents effectively convinced them not to use SNS. Influence was apparently a factor for using social networks, probably because the students quickly get influenced by their colleagues. Another construct that influenced attitude and trust of SNS supported in this study is trialability. Potential social networking sites adopters will be more inclined to use it if they can try it out first. These findings have shown what the Diffusion of Innovation model in the diffusion of Social networking sites. It is therefore noteworthy for builders of these sites to examine the attributes of the model to see how they could improve on the use of these sites. 6.0 Conclusions This study analysed the issues surrounding the adoption of social networking sites (SNS) using diffusion of innovation theory (DOI) to test its adoption among University students. Five major constructs: Relative Advantage, Complexity, Compatibility, Observability and Trialability were used to test the impact on the attitude and trust regarding SNS and to determine how attitude would impact on the intention to use it. From the results, it could be said that the relative advantage of using SNS; how hard it was to use; how compatible it were with the lifestyle of the users; how much has been registered about SNS by the users; and whether social networking sites could be tested before consistent use, were issues that influence users’ attitude towards intention it use. The Attitude of a user would later affect his/her intention to use the site. Since trialability and compatibility had the greatest impact on attitude, it follows that the social networking sites follow the student’s lifestyle and would assist in consummating greater diffusion of social networking sites in among students and opportunity for adopters to experiment with the system before making any long-term commitment. Future studies could consider the inclusion of specifics on innovation diffusion with respect to geographical location and the cultural considerations of another area. The diffusion of social networking sites in Nigeria could also be studied from the perspective of non-users, to determine why they persist in non-usage of this technology. References P. Adler, S. Kwon. “Social capital: Prospects for a new concept”. Academy of Management Review, 27 (1), 17-40, 2002 J. Bargh, K. McKenna. “The Internet and social life”. Annual Review of Psychology, 55 (1), 573- 590, 2004 D. Boyd. ”Friendster and publicly articulated social networks”. In Proceedings of ACM Conference on Human Factors in Computing Systems New York: ACM Press, 2004 International Journal of Computer Science and Security (IJCSS), Volume (4): Issue (3) 371
- 116. Olusegun Folorunso,Rebecca O. Vincent ,Adebayo Felix Adekoya & Adewale Opeoluwa Ogunde D.M. Boyd and N. B. Ellison. ”Social network sites: Definition, history, and scholarship”. Journal of Computer-Mediated Communication. 13(1), article 11, 2007. F. D. Davis, R. P. Bagozzi and Warshaw, P. R. “User acceptance of computer technology: A comparison of two theoretical models”. Management Science, 35(8), 982-1003, 1989 C. Dwyer, S. R. Hiltz, and Passerini, K. “Trust and privacy concern within social networking sites: A comparison of Facebook and MySpace”. In Proceedings of AMCIS 2007, Keystone, Colarado, USA, 2007. Retrieved September 21, 2007 from http://csis.pace.edu/~dwyer/research/DwyerAMCIS2007.pdf T. Lee. ”Nurses adoption of technology: Application of Rogers innovation-diffusion model”, Applied Nursing Research, 17(4), Pages 231-238, 2004 W. M. Olatokun, L. J. Igbinedion.. “The Adoption of Automatic Teller Machines in Nigeria: An Application of the Theory of Diffusion of Innovation”, Issues in informing Science and Information Technology, Vol. (6)374-392, 2009 J. M. Penning, F. Harianto. “The diffusion of technological innovation in the commercial banking industry”. Strategic Management Journal, 13(1), 29-46, 2007 th E. M. Rogers. “Diffusion of innovations” , 4 Edition, The Free Press: New York. 1995 Z. Zhenghao, M. T. Liu, and M. P. Chuan. "3G Mobile Phone Usage in China: Viewpoint from Innovation Diffusion Theory and Technology Acceptance Model". In Proceedings of the 2009 International Conference on Networking and Digital Society (ICND), Guiyang, China, 2009 International Journal of Computer Science and Security (IJCSS), Volume (4): Issue (3) 372
- 117. CALL FOR PAPERS Journal: International Journal of Computer Science and Security (IJCSS) Volume: 4 Issue: 4 ISSN: 1985-1553 URL: http://www.cscjournals.org/csc/description.php?JCode=IJCSS About IJCSS The International Journal of Computer Science and Security (IJCSS) is a refereed online journal which is a forum for publication of current research in computer science and computer security technologies. It considers any material dealing primarily with the technological aspects of computer science and computer security. The journal is targeted to be read by academics, scholars, advanced students, practitioners, and those seeking an update on current experience and future prospects in relation to all aspects computer science in general but specific to computer security themes. Subjects covered include: access control, computer security, cryptography, communications and data security, databases, electronic commerce, multimedia, bioinformatics, signal processing and image processing etc. To build its International reputation, we are disseminating the publication information through Google Books, Google Scholar, Directory of Open Access Journals (DOAJ), Open J Gate, ScientificCommons, Docstoc and many more. Our International Editors are working on establishing ISI listing and a good impact factor for IJCSS. IJCSS List of Topics The realm of International Journal of Computer Science and Security (IJCSS) extends, but not limited, to the following: • Authentication and • Communications and data security authorization models • Computer Engineering • Bioinformatics • Computer Networks • Computer graphics • Cryptography • Computer security • Databases • Data mining • Image processing • Electronic commerce • Operating systems • Object Orientation • Programming languages • Parallel and distributed processing • Signal processing • Robotics • Theory • Software engineering
- 118. Important Dates Volume: 4 Issue: 4 Paper Submission: July 31, 2010 Author Notification: September 01, 2010 Issue Publication: September/October 2010
- 119. CALL FOR EDITORS/REVIEWERS CSC Journals is in process of appointing Editorial Board Members for International Journal of Computer Science and Security (IJCSS). CSC Journals would like to invite interested candidates to join IJCSS network of professionals/researchers for the positions of Editor-in-Chief, Associate Editor-in-Chief, Editorial Board Members and Reviewers. The invitation encourages interested professionals to contribute into CSC research network by joining as a part of editorial board members and reviewers for scientific peer-reviewed journals. All journals use an online, electronic submission process. The Editor is responsible for the timely and substantive output of the journal, including the solicitation of manuscripts, supervision of the peer review process and the final selection of articles for publication. Responsibilities also include implementing the journal’s editorial policies, maintaining high professional standards for published content, ensuring the integrity of the journal, guiding manuscripts through the review process, overseeing revisions, and planning special issues along with the editorial team. A complete list of journals can be found at http://www.cscjournals.org/csc/byjournal.php. Interested candidates may apply for the following positions through http://www.cscjournals.org/csc/login.php. Please remember that it is through the effort of volunteers such as yourself that CSC Journals continues to grow and flourish. Your help with reviewing the issues written by prospective authors would be very much appreciated. Feel free to contact us at [email protected] if you have any queries.
- 120. Contact Information Computer Science Journals Sdn BhD M-3-19, Plaza Damas Sri Hartamas 50480, Kuala Lumpur MALAYSIA Phone: +603 6207 1607 +603 2782 6991 Fax: +603 6207 1697 BRANCH OFFICE 1 Suite 5.04 Level 5, 365 Little Collins Street, MELBOURNE 3000, Victoria, AUSTRALIA Fax: +613 8677 1132 BRANCH OFFICE 2 Office no. 8, Saad Arcad, DHA Main Bulevard Lahore, PAKISTAN EMAIL SUPPORT Head CSC Press: [email protected] CSC Press: [email protected] Info: [email protected]