SlideShare a Scribd company logo
INTRODUCTION TO COMPUTER
GRAPHICS
BY
PRIYODARSHINI DHAR
CSE-20101041
What is computer graphics?
Computer graphics refers to the creation, storage
and manipulation of pictures and drawings using
digital computers
Used in diverse fields to represent data .
Scientific researches, engineering applications,
medicine, business, industry, government, art,
entertainment, advertising, education and other
fields make use of computer graphics.
It enhances the communication between computers
and users.
Application of Computer Graphics
Designing
• Engineering and architectural systems use
graphics for designing consumer products and many
other applications . CAD(computer aided design) is
used frequently in designing buildings, cities, aircraft,
spacecraft, defence mechanism and so on.
• Graphics make computer applications much more
interactive, active and dynamic . It opens unlimited
experimenting options for the designer .
 Image processing
 Animation
 Morphing
 Simulation
 E-learning
 Graphic design
2D and 3D image processing
and visualization
Example of graphic
design of a car
3D picture Animation
Film Industry
•Used largely in film industries and
multimedia application.
•Leaders of artistry and quality
Game Industry
• The newest driving force in CG
•Focus on interactivity
•Cost effective solutions
•Avoiding commutating and other tricks
•Games drive the baseline
Medical Imaging and Scientific
Visualization
•Tools for teaching and diagnosis
•New data representations and modalities
•Drive issues of precision and correctness
•Focus on presentation and interpretation
of data
•Construction of models from acquired
data
Basic terms related to display devices:
•Pixel: A pixel is defined as the smallest size object or colour spot
that can be displayed and addressed on a monitor. Pixels are
normally arranged in a regular 2-dimensional grid, and are often
represented using dots or squares.
•Resolution: They are two types
1) Image Resolution: It refers to pixel spacing. In
normal PC monitor it ranges between 25 to 80 pixels per inch.
2) Screen Resolution: It is the number of
distinct pixels in each dimension that can be displayed.
•Dot: The internal surface of the coated monitor screen is
arranged into millions of tint cells(red, green, blue) called Dots.
•Dot pitch: It is the distance between any two dots of the same
colour. It is the measure of screen resolution. Smaller the dot
pitch, higher will be the resolution, sharpness and detailed.
Note: If the image resolution is more compared to the
inherent resolution, then the displayed image quality gets
reduced.
•Aspect ratio: It is the ratio of the number of X pixels to the Y
pixels. The standard aspect ratio for PCs is 4:3 and 5:4.
Note: 5:4 aspect ratio distorts the image a bit.
Resolution Number of
Pixels
Aspect Ratio
320*200 64000 8:5
640*480 307200 4:3
800*600 480000 4:3
1024*768 786432 4:3
1280*1024 1310720 5:4
1600*1200 1920000 4:3
Table 1: Common resolution, respective number of pixels and standard aspect
ratios.
Bit Planes, Colour Depth and Colour Palette
 The appearance and colour of a pixel of an image is
result of interaction of three primary colour.
 When the intensity of all the 3 electron beam is high it
results in a white pixel.
 When the intensity of all the 3 electron beam is low it
results in a black pixel.
 When the intensity of all the 3 electron beam is in any
other combination it results in a intermediate coloured pixel.
NOTE:
•Colour Depth: The number of memory bits required to store
colour information(intensity value for all three primary colour
component) about a pixel is called colour depth or bit depth.
Corresponding to the intensity value 0 or 1,pixel can be black or
white.
•Bit plane or bitmap: The block of memory which stores bi-
level intensity values for each pixel of a full screen pure black and
white image is called a bit map or bit plane.
NOTE:
Colour or grey levels can be achieved using additional bit planes. Hence n-
bits per pixel means colour depth=n and it is a collection of n bit planes allowing 2^n
colours at every pixel.
Figure: For colour depth=n, n number of bit planes are used, each
bit plane contribute to the gray shade of pixel.
Note:
The more the number of bits used per pixel, the finer the colour detail of
the image. However more memory is used for storage.
Colour Depth Number of
Displayed colour
Bytes of Storage
Per Pixel
Common Name
for Colour Depth
4-Bit 16 0.5 Standard VGA
8-Bit 256 1.0 256-Colour Mode
16-Bit 65536 2.0 High Colour
24-Bit 1,67,77,216 3.0 True Colour
Table: Common colour depths used in PCs
For True Colour three bytes of information is used- Red,
Green and Blue .
A byte can hold 256 different values and so 256 voltage
settings are possible for each electron.
Hence each primary colour has 256 intensities.
16 million colour possibilities.
True colour is necessary for doing high quality photo-
editing, graphical design etc.
Primary Colours
True colour:
Figure: For Bit depth = 24 (true colour display) , 8 bit planes used for
storing each primary colour component ;of the colour value of a pixel
For High Colour two bytes of information are used to store
the intensity values for all three colours.
This is done by dividing 16 bits into 5 bits for blue 5 bits for
red and 6 bits for green.
Hence it has reduced colour precision and loss of visible
picture quality.
It is sometimes preferred as it uses 33% less memory than in
true colour.
256-Colour Mode:
In 265-colour mode the PC uses only 8 bits.
It may use 2 bits for blue, 3 bits for green and red.
There is chances that most of the colours of a picture are
not present.
In such cases we use a palette or look-up table.
High Colour:
Palette or Look-up table:
A palette or look-up table is a separate memory block
created containing 256 different colours.
The intensity values stored therein are not constrained
within the range of 0-3 for blue and 0-7 for red and green.
The intensity value finally results in having intensity 0-
256 each.
It is an excellent compromise at the cost of moderate
increase in memory.
It can be reloaded any time with different colour
combination.
Frame Buffer :
The frame buffer is the video memory that is used to hold
or map the image displayed on the screen.
The amount of memory required to hold the image
depend primarily on the resolution of the screen image and the
colour depth.
The formula to calculate how much video memory is
required at a given resolution and bit depth is given below.
Memory in MB = (X-resolution*Y-resolution*Bit per
pixel)/(8*1024*1024)
Display Devices:
The most prominent part of a computer is the display
system that is responsible for graphic display. Some of the
common types are given below:
1) Raster Scan Display
2) Random Scan Display
3) Direct View storage tube.
4) Flat Panel Displays
5) Three Dimensional Viewing Devices
6) Stereoscopic and Virtual Reality System
Fig : CRT used in TVs
Raster Scan Display and Random Scan Display:
Basically there are two types of CRT’s- Raster Scan type and
Random Scan type.
The main difference between the two is the technique with
which the image is generated on the phosphor coated CRT screen.
In Raster scan type the electron beam sweeps the entire
screen from left to right, top to bottom, in the same fashion as we
write on a notebook, word by word.
In Random Scan type the electronic beam is directed
straightway to the particular point(s) on the screen where the
image has to be produced. This technique is also called vector
drawing or stroke writing or calligraphic display.
Figure: Drawing a triangle on a Raster Scan Display
Figure :Drawing a triangle using Random Scan Display
Though the vector drawn images lack in depth and real-
like colour precision, the random display can work at higher
resolution than raster displays.
The images are sharper and have smooth edges unlike the
jagged lines and edges in raster type.
Direct View Storage Tube :
It is rarely used now-a-days as part of display system.
In DVST there is no refresh buffer; the images are created by
drawing vectors or line segment with relatively slow moving
electron beam.
It is one of the display devices in which an electron
flood gun and writing gun is present.
The flood gun floods electrons to a wire grid on which
already the writing gun has written some image.
The electrons from the flood gun will be repelled back
by the negatively charged wire grid which has been charged so
by the writing electron beam.
The part of the wire grid which has not been charged
-ve will allow the electrons to pass through and the electrons
will collide on the screen and produce the image.
Advantages-
1)Refreshing CRT is not required.
2)Complex picture can be displayed in high resolution without
flicker
3)It has flat screen
In existence since 1964’s,Flat
panel displays are much
thinner and flatter than
traditional TVs
Flat Panel Display:
It refers to a class of video devices
that have a:-
reduced volume, smaller,thinner,
reduced weight and
reduced power requirements
compared to a standard CRT
Examples are LCD, Plasma display panel, LED
panel and thin CRT.
Current usage:
•Small and big TV monitors
•Pocket video games
•Laptop computers
•Advertisement boards in
elevators and showrooms.
•Portable monitors.
Thin/Slim CRT:
To produce a thin CRT, the normal CRT is reduced by
bending it in the middle.
The deflection apparatus is modified so that electron
beams can be bend through 90 degrees to focus on the screen
and at the same time can be steered up and down and across the
screen.
Fig:
Thin CRT from Candescent Technologies
LCD(LIQUID CRISTAL DISPLAY)
LCD consists of a layer of liquid crystal, sandwiched
between two polarized plates.
The polarizers are aligned perpendicular to each other, so
that light incident on the first polarizer will be blocked by the
second.
The LCD displays are addressed in a matrix fashion.
Rows and Columns are defined by a thin layer of vertical
transparent conductors.
The intersection of the two conductors defines a
pixel position.
Figure: There are two thin films of polarizer
glued on both sides of the glass. The purpose
of the polarizer is to allow the right amount of
backlight to pass through it in order to have a
proper display.
The liquid crystal material is made up of long
rod shaped crystalline molecules containing cynobiphenyl units.
The individual polar molecules in a nematic LC layer
are normally arranged in a spiral fashion.
Light from an internal source enters the first
polarizer(say horizontal) and is polarized accordingly. As the light
passes through the LC layer it is twisted 90 degrees.
NOTE : The light entering through the front polarizer is not allowed to pass
through the rear polarizer due to mismatch of polarization direction.
The result is ZERO reflection of light and hence the LCD appears black.
In a color LCD there are layers of 3 liquid crystal
panels one on top of other. Each one is filled with a color- Red,
Green or Blue liquid crystal.
Fig: Layer of LCD panel
Advantage of 3 layers:
It helps create as many as screen pixels as intersections.
It has high resolution panels.
Each pixel comprises 3 color cells or sub pixel elements.
Comparison between LCD and CRT:
The image painting operation in LCD panel is different
from CRT.
Both are of Raster scan type.
FIG: LCD and CRT
Plasma Panel :
Here a layer of gas usually neon is sandwiched between
two glass plates.
Thin vertical strips of conductor run across one plate,
while horizontal conductors run up and down the other plate.
By applying high voltage to a pair of horizontal and vertical
conductors, a pair of horizontal and vertical conductors, a small
section of gas at the intersection of the conductors breaks down
into glowing plasma of electrons and ions.
In the array of gas bulbs, each one can be set to an ‘on’
state or ‘off ‘state by adjusting the voltage of the pair of
conductor.
Advantage:
1) Excellent brightness.
2)High contrast
3)Huge scalability
Limitation:
1) Very costly.
Fig: Layers of Plasma
Panel
READYMADE IMAGE
SCANNER:
A graphic device which directly copies images from a
paper or photograph and converts it into the digital format for
display, storage and graphic manipulation is called a scanner.
Types of scanner:
1. Drum scanner : They are the high-end scanners.
2. Sheetfed scanner: They are ordinary type scanner.
3. Flatbed scanner: It strikes a balance between the above two
in quality as well as price.
4. Handheld scanner / bar code readers: They are used for
scanning documents in strips of about 4 inches wide by holding
the scanner in one hand and sliding it over the documents.
Fig: Drum Scanner Fig: Sheetfed scanner
Fig : Flatbed Scanner
Fig: Barcode Reader

More Related Content

What's hot (20)

PPTX
Raster scan and random scan
KABILESH RAMAR
 
PPT
Graphics software
Mohd Arif
 
PPTX
Output primitives in Computer Graphics
Kamal Acharya
 
PPTX
Frame buffer
Aparna Joshi
 
PPT
Multimedia tools (sound)
dhruv patel
 
PPT
Computer graphics
Mohsin Azam
 
PPTX
Scaling and shearing
Mani Kanth
 
PPTX
Attributes of output primitive(line attributes)
shalinikarunakaran1
 
PPTX
Multimedia Building Blocks by Daniyal Khan
Daniyal Khan
 
PPTX
Video display devices
shalinikarunakaran1
 
PPT
Display techniques
Mohd Arif
 
PPTX
Overview of the graphics system
Kamal Acharya
 
PPTX
Random scan displays and raster scan displays
Somya Bagai
 
PPTX
what is Font in multimedia
maliksiddique1
 
PPTX
Overview of Graphics System
PrathimaBaliga
 
PPT
Raster scan system
Mohd Arif
 
PPTX
Circle generation algorithm
Ankit Garg
 
PPTX
Matrix representation- CG.pptx
RubaNagarajan
 
PPTX
Character Attribute in computer graphics
HariTharshiniBscIT1
 
PPTX
Multimedia: Digital representation of multimedia
Arti Parab Academics
 
Raster scan and random scan
KABILESH RAMAR
 
Graphics software
Mohd Arif
 
Output primitives in Computer Graphics
Kamal Acharya
 
Frame buffer
Aparna Joshi
 
Multimedia tools (sound)
dhruv patel
 
Computer graphics
Mohsin Azam
 
Scaling and shearing
Mani Kanth
 
Attributes of output primitive(line attributes)
shalinikarunakaran1
 
Multimedia Building Blocks by Daniyal Khan
Daniyal Khan
 
Video display devices
shalinikarunakaran1
 
Display techniques
Mohd Arif
 
Overview of the graphics system
Kamal Acharya
 
Random scan displays and raster scan displays
Somya Bagai
 
what is Font in multimedia
maliksiddique1
 
Overview of Graphics System
PrathimaBaliga
 
Raster scan system
Mohd Arif
 
Circle generation algorithm
Ankit Garg
 
Matrix representation- CG.pptx
RubaNagarajan
 
Character Attribute in computer graphics
HariTharshiniBscIT1
 
Multimedia: Digital representation of multimedia
Arti Parab Academics
 

Similar to Introduction to computer graphics (20)

PPTX
new ai techniques.pptx
SanandMishra
 
PPTX
Unit 2 open gl .pptx
miteshchaudhari4466
 
PPT
Introduction to computer graphics and multimedia
Shweta Shah
 
PPT
Chapter 10: Display Systems
askme
 
PPT
Introduction to computer graphics part 1
Ankit Garg
 
PPT
Unit 1
Ankit Garg
 
PPTX
CG_Unit1_SShah.pptx
Shweta Shah
 
PPT
Introduction to computer graphics part 2
Ankit Garg
 
PDF
111 03 hardware 2 output
Christian Gabriel
 
PPT
Overview of graphics systems.ppt
MalleshBettadapura1
 
PPT
unit-1-basics-of-computer-graphics.ppt 7th sem
PankajPakhare1
 
PPTX
Graphics Primitives and CG Display Devices
DIPIKA83
 
DOCX
Monitor
Amzad Khan
 
PPTX
CG.pptx
AdityaBisht34
 
PPTX
Characteristics of Display Adapter
ssuser255bf1
 
PDF
1.1.2.pdf
ssuser255bf1
 
PPTX
Chapter 1 fundamentals of digital imaging
ZCELPROPS
 
PDF
CG2_HWcomputergraphicshardwareeeeeee.pdf
VikramBhathal
 
PPTX
Computer Graphics - Introduction and CRT Devices
Hisham Al Kurdi, EAVA, DMC-D-4K, HCCA-P, HCAA-D
 
PPT
Model 1 multimedia graphics and animation introduction (1)
Rahul Borate
 
new ai techniques.pptx
SanandMishra
 
Unit 2 open gl .pptx
miteshchaudhari4466
 
Introduction to computer graphics and multimedia
Shweta Shah
 
Chapter 10: Display Systems
askme
 
Introduction to computer graphics part 1
Ankit Garg
 
Unit 1
Ankit Garg
 
CG_Unit1_SShah.pptx
Shweta Shah
 
Introduction to computer graphics part 2
Ankit Garg
 
111 03 hardware 2 output
Christian Gabriel
 
Overview of graphics systems.ppt
MalleshBettadapura1
 
unit-1-basics-of-computer-graphics.ppt 7th sem
PankajPakhare1
 
Graphics Primitives and CG Display Devices
DIPIKA83
 
Monitor
Amzad Khan
 
CG.pptx
AdityaBisht34
 
Characteristics of Display Adapter
ssuser255bf1
 
1.1.2.pdf
ssuser255bf1
 
Chapter 1 fundamentals of digital imaging
ZCELPROPS
 
CG2_HWcomputergraphicshardwareeeeeee.pdf
VikramBhathal
 
Computer Graphics - Introduction and CRT Devices
Hisham Al Kurdi, EAVA, DMC-D-4K, HCCA-P, HCAA-D
 
Model 1 multimedia graphics and animation introduction (1)
Rahul Borate
 
Ad

Recently uploaded (20)

PDF
Achieving Consistent and Reliable AI Code Generation - Medusa AI
medusaaico
 
PDF
DevBcn - Building 10x Organizations Using Modern Productivity Metrics
Justin Reock
 
PPTX
Webinar: Introduction to LF Energy EVerest
DanBrown980551
 
PPTX
UiPath Academic Alliance Educator Panels: Session 2 - Business Analyst Content
DianaGray10
 
PDF
Agentic AI lifecycle for Enterprise Hyper-Automation
Debmalya Biswas
 
PDF
Python basic programing language for automation
DanialHabibi2
 
PPTX
"Autonomy of LLM Agents: Current State and Future Prospects", Oles` Petriv
Fwdays
 
PDF
Timothy Rottach - Ramp up on AI Use Cases, from Vector Search to AI Agents wi...
AWS Chicago
 
PPTX
COMPARISON OF RASTER ANALYSIS TOOLS OF QGIS AND ARCGIS
Sharanya Sarkar
 
PDF
Using FME to Develop Self-Service CAD Applications for a Major UK Police Force
Safe Software
 
PDF
Complete JavaScript Notes: From Basics to Advanced Concepts.pdf
haydendavispro
 
PDF
SWEBOK Guide and Software Services Engineering Education
Hironori Washizaki
 
PDF
[Newgen] NewgenONE Marvin Brochure 1.pdf
darshakparmar
 
PDF
Bitcoin for Millennials podcast with Bram, Power Laws of Bitcoin
Stephen Perrenod
 
PDF
NewMind AI - Journal 100 Insights After The 100th Issue
NewMind AI
 
PDF
The Builder’s Playbook - 2025 State of AI Report.pdf
jeroen339954
 
PDF
July Patch Tuesday
Ivanti
 
PDF
Building Real-Time Digital Twins with IBM Maximo & ArcGIS Indoors
Safe Software
 
PDF
HCIP-Data Center Facility Deployment V2.0 Training Material (Without Remarks ...
mcastillo49
 
PDF
Presentation - Vibe Coding The Future of Tech
yanuarsinggih1
 
Achieving Consistent and Reliable AI Code Generation - Medusa AI
medusaaico
 
DevBcn - Building 10x Organizations Using Modern Productivity Metrics
Justin Reock
 
Webinar: Introduction to LF Energy EVerest
DanBrown980551
 
UiPath Academic Alliance Educator Panels: Session 2 - Business Analyst Content
DianaGray10
 
Agentic AI lifecycle for Enterprise Hyper-Automation
Debmalya Biswas
 
Python basic programing language for automation
DanialHabibi2
 
"Autonomy of LLM Agents: Current State and Future Prospects", Oles` Petriv
Fwdays
 
Timothy Rottach - Ramp up on AI Use Cases, from Vector Search to AI Agents wi...
AWS Chicago
 
COMPARISON OF RASTER ANALYSIS TOOLS OF QGIS AND ARCGIS
Sharanya Sarkar
 
Using FME to Develop Self-Service CAD Applications for a Major UK Police Force
Safe Software
 
Complete JavaScript Notes: From Basics to Advanced Concepts.pdf
haydendavispro
 
SWEBOK Guide and Software Services Engineering Education
Hironori Washizaki
 
[Newgen] NewgenONE Marvin Brochure 1.pdf
darshakparmar
 
Bitcoin for Millennials podcast with Bram, Power Laws of Bitcoin
Stephen Perrenod
 
NewMind AI - Journal 100 Insights After The 100th Issue
NewMind AI
 
The Builder’s Playbook - 2025 State of AI Report.pdf
jeroen339954
 
July Patch Tuesday
Ivanti
 
Building Real-Time Digital Twins with IBM Maximo & ArcGIS Indoors
Safe Software
 
HCIP-Data Center Facility Deployment V2.0 Training Material (Without Remarks ...
mcastillo49
 
Presentation - Vibe Coding The Future of Tech
yanuarsinggih1
 
Ad

Introduction to computer graphics

  • 2. What is computer graphics? Computer graphics refers to the creation, storage and manipulation of pictures and drawings using digital computers Used in diverse fields to represent data . Scientific researches, engineering applications, medicine, business, industry, government, art, entertainment, advertising, education and other fields make use of computer graphics. It enhances the communication between computers and users.
  • 3. Application of Computer Graphics Designing • Engineering and architectural systems use graphics for designing consumer products and many other applications . CAD(computer aided design) is used frequently in designing buildings, cities, aircraft, spacecraft, defence mechanism and so on. • Graphics make computer applications much more interactive, active and dynamic . It opens unlimited experimenting options for the designer .
  • 4.  Image processing  Animation  Morphing  Simulation  E-learning  Graphic design 2D and 3D image processing and visualization Example of graphic design of a car 3D picture Animation
  • 5. Film Industry •Used largely in film industries and multimedia application. •Leaders of artistry and quality
  • 6. Game Industry • The newest driving force in CG •Focus on interactivity •Cost effective solutions •Avoiding commutating and other tricks •Games drive the baseline Medical Imaging and Scientific Visualization •Tools for teaching and diagnosis •New data representations and modalities •Drive issues of precision and correctness •Focus on presentation and interpretation of data •Construction of models from acquired data
  • 7. Basic terms related to display devices: •Pixel: A pixel is defined as the smallest size object or colour spot that can be displayed and addressed on a monitor. Pixels are normally arranged in a regular 2-dimensional grid, and are often represented using dots or squares. •Resolution: They are two types 1) Image Resolution: It refers to pixel spacing. In normal PC monitor it ranges between 25 to 80 pixels per inch. 2) Screen Resolution: It is the number of distinct pixels in each dimension that can be displayed. •Dot: The internal surface of the coated monitor screen is arranged into millions of tint cells(red, green, blue) called Dots.
  • 8. •Dot pitch: It is the distance between any two dots of the same colour. It is the measure of screen resolution. Smaller the dot pitch, higher will be the resolution, sharpness and detailed. Note: If the image resolution is more compared to the inherent resolution, then the displayed image quality gets reduced. •Aspect ratio: It is the ratio of the number of X pixels to the Y pixels. The standard aspect ratio for PCs is 4:3 and 5:4. Note: 5:4 aspect ratio distorts the image a bit.
  • 9. Resolution Number of Pixels Aspect Ratio 320*200 64000 8:5 640*480 307200 4:3 800*600 480000 4:3 1024*768 786432 4:3 1280*1024 1310720 5:4 1600*1200 1920000 4:3 Table 1: Common resolution, respective number of pixels and standard aspect ratios.
  • 10. Bit Planes, Colour Depth and Colour Palette  The appearance and colour of a pixel of an image is result of interaction of three primary colour.  When the intensity of all the 3 electron beam is high it results in a white pixel.  When the intensity of all the 3 electron beam is low it results in a black pixel.  When the intensity of all the 3 electron beam is in any other combination it results in a intermediate coloured pixel. NOTE:
  • 11. •Colour Depth: The number of memory bits required to store colour information(intensity value for all three primary colour component) about a pixel is called colour depth or bit depth. Corresponding to the intensity value 0 or 1,pixel can be black or white. •Bit plane or bitmap: The block of memory which stores bi- level intensity values for each pixel of a full screen pure black and white image is called a bit map or bit plane. NOTE: Colour or grey levels can be achieved using additional bit planes. Hence n- bits per pixel means colour depth=n and it is a collection of n bit planes allowing 2^n colours at every pixel.
  • 12. Figure: For colour depth=n, n number of bit planes are used, each bit plane contribute to the gray shade of pixel.
  • 13. Note: The more the number of bits used per pixel, the finer the colour detail of the image. However more memory is used for storage. Colour Depth Number of Displayed colour Bytes of Storage Per Pixel Common Name for Colour Depth 4-Bit 16 0.5 Standard VGA 8-Bit 256 1.0 256-Colour Mode 16-Bit 65536 2.0 High Colour 24-Bit 1,67,77,216 3.0 True Colour Table: Common colour depths used in PCs
  • 14. For True Colour three bytes of information is used- Red, Green and Blue . A byte can hold 256 different values and so 256 voltage settings are possible for each electron. Hence each primary colour has 256 intensities. 16 million colour possibilities. True colour is necessary for doing high quality photo- editing, graphical design etc. Primary Colours True colour:
  • 15. Figure: For Bit depth = 24 (true colour display) , 8 bit planes used for storing each primary colour component ;of the colour value of a pixel
  • 16. For High Colour two bytes of information are used to store the intensity values for all three colours. This is done by dividing 16 bits into 5 bits for blue 5 bits for red and 6 bits for green. Hence it has reduced colour precision and loss of visible picture quality. It is sometimes preferred as it uses 33% less memory than in true colour. 256-Colour Mode: In 265-colour mode the PC uses only 8 bits. It may use 2 bits for blue, 3 bits for green and red. There is chances that most of the colours of a picture are not present. In such cases we use a palette or look-up table. High Colour:
  • 17. Palette or Look-up table: A palette or look-up table is a separate memory block created containing 256 different colours. The intensity values stored therein are not constrained within the range of 0-3 for blue and 0-7 for red and green. The intensity value finally results in having intensity 0- 256 each. It is an excellent compromise at the cost of moderate increase in memory. It can be reloaded any time with different colour combination.
  • 18. Frame Buffer : The frame buffer is the video memory that is used to hold or map the image displayed on the screen. The amount of memory required to hold the image depend primarily on the resolution of the screen image and the colour depth. The formula to calculate how much video memory is required at a given resolution and bit depth is given below. Memory in MB = (X-resolution*Y-resolution*Bit per pixel)/(8*1024*1024)
  • 19. Display Devices: The most prominent part of a computer is the display system that is responsible for graphic display. Some of the common types are given below: 1) Raster Scan Display 2) Random Scan Display 3) Direct View storage tube. 4) Flat Panel Displays 5) Three Dimensional Viewing Devices 6) Stereoscopic and Virtual Reality System Fig : CRT used in TVs
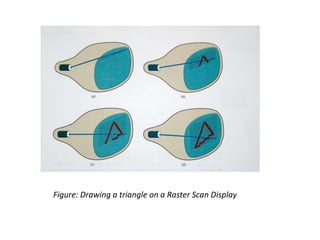
  • 20. Raster Scan Display and Random Scan Display: Basically there are two types of CRT’s- Raster Scan type and Random Scan type. The main difference between the two is the technique with which the image is generated on the phosphor coated CRT screen. In Raster scan type the electron beam sweeps the entire screen from left to right, top to bottom, in the same fashion as we write on a notebook, word by word. In Random Scan type the electronic beam is directed straightway to the particular point(s) on the screen where the image has to be produced. This technique is also called vector drawing or stroke writing or calligraphic display.
  • 21. Figure: Drawing a triangle on a Raster Scan Display
  • 22. Figure :Drawing a triangle using Random Scan Display
  • 23. Though the vector drawn images lack in depth and real- like colour precision, the random display can work at higher resolution than raster displays. The images are sharper and have smooth edges unlike the jagged lines and edges in raster type. Direct View Storage Tube : It is rarely used now-a-days as part of display system. In DVST there is no refresh buffer; the images are created by drawing vectors or line segment with relatively slow moving electron beam.
  • 24. It is one of the display devices in which an electron flood gun and writing gun is present. The flood gun floods electrons to a wire grid on which already the writing gun has written some image. The electrons from the flood gun will be repelled back by the negatively charged wire grid which has been charged so by the writing electron beam. The part of the wire grid which has not been charged -ve will allow the electrons to pass through and the electrons will collide on the screen and produce the image. Advantages- 1)Refreshing CRT is not required. 2)Complex picture can be displayed in high resolution without flicker 3)It has flat screen
  • 25. In existence since 1964’s,Flat panel displays are much thinner and flatter than traditional TVs Flat Panel Display: It refers to a class of video devices that have a:- reduced volume, smaller,thinner, reduced weight and reduced power requirements compared to a standard CRT Examples are LCD, Plasma display panel, LED panel and thin CRT. Current usage: •Small and big TV monitors •Pocket video games •Laptop computers •Advertisement boards in elevators and showrooms. •Portable monitors.
  • 26. Thin/Slim CRT: To produce a thin CRT, the normal CRT is reduced by bending it in the middle. The deflection apparatus is modified so that electron beams can be bend through 90 degrees to focus on the screen and at the same time can be steered up and down and across the screen. Fig: Thin CRT from Candescent Technologies
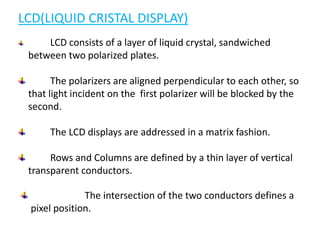
  • 27. LCD(LIQUID CRISTAL DISPLAY) LCD consists of a layer of liquid crystal, sandwiched between two polarized plates. The polarizers are aligned perpendicular to each other, so that light incident on the first polarizer will be blocked by the second. The LCD displays are addressed in a matrix fashion. Rows and Columns are defined by a thin layer of vertical transparent conductors. The intersection of the two conductors defines a pixel position.
  • 28. Figure: There are two thin films of polarizer glued on both sides of the glass. The purpose of the polarizer is to allow the right amount of backlight to pass through it in order to have a proper display.
  • 29. The liquid crystal material is made up of long rod shaped crystalline molecules containing cynobiphenyl units. The individual polar molecules in a nematic LC layer are normally arranged in a spiral fashion. Light from an internal source enters the first polarizer(say horizontal) and is polarized accordingly. As the light passes through the LC layer it is twisted 90 degrees. NOTE : The light entering through the front polarizer is not allowed to pass through the rear polarizer due to mismatch of polarization direction. The result is ZERO reflection of light and hence the LCD appears black. In a color LCD there are layers of 3 liquid crystal panels one on top of other. Each one is filled with a color- Red, Green or Blue liquid crystal.
  • 30. Fig: Layer of LCD panel
  • 31. Advantage of 3 layers: It helps create as many as screen pixels as intersections. It has high resolution panels. Each pixel comprises 3 color cells or sub pixel elements. Comparison between LCD and CRT: The image painting operation in LCD panel is different from CRT. Both are of Raster scan type. FIG: LCD and CRT
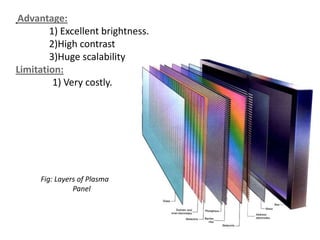
  • 32. Plasma Panel : Here a layer of gas usually neon is sandwiched between two glass plates. Thin vertical strips of conductor run across one plate, while horizontal conductors run up and down the other plate. By applying high voltage to a pair of horizontal and vertical conductors, a pair of horizontal and vertical conductors, a small section of gas at the intersection of the conductors breaks down into glowing plasma of electrons and ions. In the array of gas bulbs, each one can be set to an ‘on’ state or ‘off ‘state by adjusting the voltage of the pair of conductor.
  • 33. Advantage: 1) Excellent brightness. 2)High contrast 3)Huge scalability Limitation: 1) Very costly. Fig: Layers of Plasma Panel
  • 34. READYMADE IMAGE SCANNER: A graphic device which directly copies images from a paper or photograph and converts it into the digital format for display, storage and graphic manipulation is called a scanner. Types of scanner: 1. Drum scanner : They are the high-end scanners. 2. Sheetfed scanner: They are ordinary type scanner. 3. Flatbed scanner: It strikes a balance between the above two in quality as well as price. 4. Handheld scanner / bar code readers: They are used for scanning documents in strips of about 4 inches wide by holding the scanner in one hand and sliding it over the documents.
  • 35. Fig: Drum Scanner Fig: Sheetfed scanner Fig : Flatbed Scanner Fig: Barcode Reader