SlideShare a Scribd company logo
Statistics for Microarray Data
Background

         μ, σ2


• Few observations made by a black box

• What is the distribution behind the black box?

• E.g., with what probability will it output a number
  bigger than 5?
Approach

• Easy to determine with many observations

• With few observations..

• Assume a canonical distribution based on prior
  knowledge

• Determine parameters of this distribution using
  the observations, e.g., mean, variance
Estimating the mean
Estimating the variance σ2

                         Chi-Square if
                          the original
                         distribution
                         was Normal
Microarray Data
• Many genes, 25000

• 2 conditions (or more), many replicates within
  each condition

• Which genes are differentially expressed
  between the two conditions?
More Specifically
• For a particular gene
  – Each condition is a black box
  – Say 3 observations from each black box


• Do both black boxes have the same
  distribution?
  – Assume same canonical distribution
  – Do both have the same parameters?
Which Canonical Distribution
• Use data with many replicates

• 418.0294, 295.8019, 272.1220, 315.2978, 294.2242,
  379.8320, 392.1817, 450.4758, 335.8242, 265.2478,
  196.6982, 289.6532, 274.4035, 246.6807, 254.8710,
  165.9416, 281.9463, 246.6434, 259.0019, 242.1968


• Distribution??
What is a QQ Plot
Distribution of log raw intensities
 across genes on a single array
The QQ plot of log scale intensities
(i.e., actual vs simulated from normal)
QQ Plot against a Normal Distribution
• 10 + 10 replicates in
  two groups

• Single group QQ plot

• Combined 2 groups QQ
  plot

• Combined log-scale QQ
  plot
                          Shapiro-
                          Wilk Test
Which Canonical Distribution


• Assume log normal distribution
Benford’s Law
• Frequency distribution of first significant digit


    Pr(d<=x<d+1 )= log10(1+d)-log10(d), log10(x) is uniformly distributed in [0,1]
Differential Expression

          μ1,σ12             μ2,σ22


Group 1                                        Group 2


                    Is μ1= μ2?
                     σ1 = σ2 ?        Is variance a
                                       function of
                                          mean?
SD
increases
 linearly
with Mean


  SD vs Mean across 3 replicates plotted for all genes
SD is flat
   now,
except for
 very low
  values


                                          Another
                                         reason to
                                          work on
                                          the log
                                           scale


SD vs Mean across 3 replicates computed for all
       genes after log-transformation
Differential Expression

          μ1,σ12             μ2,σ22


Group 1                                   Group 2


                    Is μ1= μ2?
                     σ1 = σ2 ?        Sort-of YES
The T-Statistic
The T-Statistic
The T-Statistic
The T-Statistic
                   Flattened
                  Normal or T-
                  Distribution
A Problem
The curve
                                          fit here
                                         may be a
                                           better
                                         estimate


Lots of false
positives can                            Not much
 be avoided                              difference
    here                                    here


SD vs Mean across 3 replicates computed for all
       genes after log-transformattion
Thank You

More Related Content

PPT
Multiplying fractions
NeilfieOrit2
 
PPT
Fractions division
Terry Golden
 
PPT
Fractions multiplicatin
Terry Golden
 
PPTX
Central tendency
heyyou02
 
PPT
Long division
lima49
 
PPTX
Multiplication on decimals
NeilfieOrit2
 
PPT
Dividing Fraction
mrsbrown109
 
Multiplying fractions
NeilfieOrit2
 
Fractions division
Terry Golden
 
Fractions multiplicatin
Terry Golden
 
Central tendency
heyyou02
 
Long division
lima49
 
Multiplication on decimals
NeilfieOrit2
 
Dividing Fraction
mrsbrown109
 

Viewers also liked (14)

PDF
Introduction of suffix tree
Liou Shu Hung
 
PPT
Packet forwarding in wan.46
myrajendra
 
PPT
Trie tree
Shakil Ahmed
 
PPTX
Suffix Tree and Suffix Array
Harshit Agarwal
 
PPTX
Data structure tries
Md. Naim khan
 
PPT
Lec18
Nikhil Chilwant
 
PPT
Fundamentals
myrajendra
 
PPTX
Tries - Tree Based Structures for Strings
Amrinder Arora
 
KEY
Basic Packet Forwarding in NS2
Teerawat Issariyakul
 
PPTX
Application of tries
Tech_MX
 
PPTX
Digital Search Tree
East West University
 
PPTX
Multi ways trees
SHEETAL WAGHMARE
 
PPT
Cis82 e2-1-packet forwarding
Harjanto Handi Kusumo
 
Introduction of suffix tree
Liou Shu Hung
 
Packet forwarding in wan.46
myrajendra
 
Trie tree
Shakil Ahmed
 
Suffix Tree and Suffix Array
Harshit Agarwal
 
Data structure tries
Md. Naim khan
 
Fundamentals
myrajendra
 
Tries - Tree Based Structures for Strings
Amrinder Arora
 
Basic Packet Forwarding in NS2
Teerawat Issariyakul
 
Application of tries
Tech_MX
 
Digital Search Tree
East West University
 
Multi ways trees
SHEETAL WAGHMARE
 
Cis82 e2-1-packet forwarding
Harjanto Handi Kusumo
 
Ad

Similar to Introduction to statistics ii (20)

PPTX
Introduction to statistics
Strand Life Sciences Pvt Ltd
 
PPT
T Test For Two Independent Samples
shoffma5
 
PPT
Explorando a Cognição Neural: Mente, Cérebro e Comportamento
tidihi5139
 
PPT
Microarray Analysis
James McInerney
 
PPTX
GGWS_M3_L5_Estimation_of_heritability_from_GWAS_summary_statistics.pptx
BHAGWAT NAWADE
 
PPTX
How to analyse bulk transcriptomic data using Deseq2
AdamCribbs1
 
PPSX
Lesson 3
Ning Ding
 
PPT
unit 4 nearest neighbor.ppt
PRANAVKUMAR699137
 
PPT
Statisticsforbiologists colstons
andymartin
 
PPTX
Two dependent samples (matched pairs)
Long Beach City College
 
PPT
Chapter one on sampling distributions.ppt
FekaduAman
 
PPT
chapter three Sampling_distributions_1.ppt
aschalew shiferaw
 
PPT
Standard Scores
shoffma5
 
PDF
Genetic Algorithms
Karthik Sankar
 
PPT
Microarray Statistics
A Roy
 
PDF
Chapter7 clustering types concepts algorithms.pdf
PRABHUCECC
 
PDF
Soft Computing- Dr. H.s. Hota 28.08.14.pdf
forsatyam9451
 
PPTX
Learning multifractal structure in large networks (Purdue ML Seminar)
Austin Benson
 
PPT
The T-test
ZyrenMisaki
 
Introduction to statistics
Strand Life Sciences Pvt Ltd
 
T Test For Two Independent Samples
shoffma5
 
Explorando a Cognição Neural: Mente, Cérebro e Comportamento
tidihi5139
 
Microarray Analysis
James McInerney
 
GGWS_M3_L5_Estimation_of_heritability_from_GWAS_summary_statistics.pptx
BHAGWAT NAWADE
 
How to analyse bulk transcriptomic data using Deseq2
AdamCribbs1
 
Lesson 3
Ning Ding
 
unit 4 nearest neighbor.ppt
PRANAVKUMAR699137
 
Statisticsforbiologists colstons
andymartin
 
Two dependent samples (matched pairs)
Long Beach City College
 
Chapter one on sampling distributions.ppt
FekaduAman
 
chapter three Sampling_distributions_1.ppt
aschalew shiferaw
 
Standard Scores
shoffma5
 
Genetic Algorithms
Karthik Sankar
 
Microarray Statistics
A Roy
 
Chapter7 clustering types concepts algorithms.pdf
PRABHUCECC
 
Soft Computing- Dr. H.s. Hota 28.08.14.pdf
forsatyam9451
 
Learning multifractal structure in large networks (Purdue ML Seminar)
Austin Benson
 
The T-test
ZyrenMisaki
 
Ad

More from Strand Life Sciences Pvt Ltd (11)

PDF
Strand genomics features in CIO review
Strand Life Sciences Pvt Ltd
 
PPTX
Rules of a Quantum World
Strand Life Sciences Pvt Ltd
 
PPTX
Least common ancestors in constant time
Strand Life Sciences Pvt Ltd
 
PPTX
Introduction to statistics iii
Strand Life Sciences Pvt Ltd
 
PPTX
Dynamic programming for simd
Strand Life Sciences Pvt Ltd
 
PPTX
Complex numbers polynomial multiplication
Strand Life Sciences Pvt Ltd
 
PPTX
Converting High Dimensional Problems to Low Dimensional Ones
Strand Life Sciences Pvt Ltd
 
PPTX
Searching using Quantum Rules
Strand Life Sciences Pvt Ltd
 
PPTX
Randomized algorithms
Strand Life Sciences Pvt Ltd
 
PPTX
Suffix arrays
Strand Life Sciences Pvt Ltd
 
PPTX
Alignment of raw reads in Avadis NGS
Strand Life Sciences Pvt Ltd
 
Strand genomics features in CIO review
Strand Life Sciences Pvt Ltd
 
Rules of a Quantum World
Strand Life Sciences Pvt Ltd
 
Least common ancestors in constant time
Strand Life Sciences Pvt Ltd
 
Introduction to statistics iii
Strand Life Sciences Pvt Ltd
 
Dynamic programming for simd
Strand Life Sciences Pvt Ltd
 
Complex numbers polynomial multiplication
Strand Life Sciences Pvt Ltd
 
Converting High Dimensional Problems to Low Dimensional Ones
Strand Life Sciences Pvt Ltd
 
Searching using Quantum Rules
Strand Life Sciences Pvt Ltd
 
Randomized algorithms
Strand Life Sciences Pvt Ltd
 
Alignment of raw reads in Avadis NGS
Strand Life Sciences Pvt Ltd
 

Recently uploaded (20)

PDF
Economic Impact of Data Centres to the Malaysian Economy
flintglobalapac
 
PDF
Google I/O Extended 2025 Baku - all ppts
HusseinMalikMammadli
 
PDF
CIFDAQ's Market Wrap : Bears Back in Control?
CIFDAQ
 
PDF
Unlocking the Future- AI Agents Meet Oracle Database 23ai - AIOUG Yatra 2025.pdf
Sandesh Rao
 
PDF
Structs to JSON: How Go Powers REST APIs
Emily Achieng
 
PDF
Security features in Dell, HP, and Lenovo PC systems: A research-based compar...
Principled Technologies
 
PDF
AI Unleashed - Shaping the Future -Starting Today - AIOUG Yatra 2025 - For Co...
Sandesh Rao
 
PDF
Oracle AI Vector Search- Getting Started and what's new in 2025- AIOUG Yatra ...
Sandesh Rao
 
PDF
A Strategic Analysis of the MVNO Wave in Emerging Markets.pdf
IPLOOK Networks
 
PDF
How Open Source Changed My Career by abdelrahman ismail
a0m0rajab1
 
PDF
Automating ArcGIS Content Discovery with FME: A Real World Use Case
Safe Software
 
PPTX
AI in Daily Life: How Artificial Intelligence Helps Us Every Day
vanshrpatil7
 
PPTX
Simple and concise overview about Quantum computing..pptx
mughal641
 
PDF
Doc9.....................................
SofiaCollazos
 
PPTX
OA presentation.pptx OA presentation.pptx
pateldhruv002338
 
PDF
Using Anchore and DefectDojo to Stand Up Your DevSecOps Function
Anchore
 
PDF
NewMind AI Weekly Chronicles - July'25 - Week IV
NewMind AI
 
PDF
SparkLabs Primer on Artificial Intelligence 2025
SparkLabs Group
 
PPTX
What-is-the-World-Wide-Web -- Introduction
tonifi9488
 
PDF
OFFOFFBOX™ – A New Era for African Film | Startup Presentation
ambaicciwalkerbrian
 
Economic Impact of Data Centres to the Malaysian Economy
flintglobalapac
 
Google I/O Extended 2025 Baku - all ppts
HusseinMalikMammadli
 
CIFDAQ's Market Wrap : Bears Back in Control?
CIFDAQ
 
Unlocking the Future- AI Agents Meet Oracle Database 23ai - AIOUG Yatra 2025.pdf
Sandesh Rao
 
Structs to JSON: How Go Powers REST APIs
Emily Achieng
 
Security features in Dell, HP, and Lenovo PC systems: A research-based compar...
Principled Technologies
 
AI Unleashed - Shaping the Future -Starting Today - AIOUG Yatra 2025 - For Co...
Sandesh Rao
 
Oracle AI Vector Search- Getting Started and what's new in 2025- AIOUG Yatra ...
Sandesh Rao
 
A Strategic Analysis of the MVNO Wave in Emerging Markets.pdf
IPLOOK Networks
 
How Open Source Changed My Career by abdelrahman ismail
a0m0rajab1
 
Automating ArcGIS Content Discovery with FME: A Real World Use Case
Safe Software
 
AI in Daily Life: How Artificial Intelligence Helps Us Every Day
vanshrpatil7
 
Simple and concise overview about Quantum computing..pptx
mughal641
 
Doc9.....................................
SofiaCollazos
 
OA presentation.pptx OA presentation.pptx
pateldhruv002338
 
Using Anchore and DefectDojo to Stand Up Your DevSecOps Function
Anchore
 
NewMind AI Weekly Chronicles - July'25 - Week IV
NewMind AI
 
SparkLabs Primer on Artificial Intelligence 2025
SparkLabs Group
 
What-is-the-World-Wide-Web -- Introduction
tonifi9488
 
OFFOFFBOX™ – A New Era for African Film | Startup Presentation
ambaicciwalkerbrian
 

Introduction to statistics ii

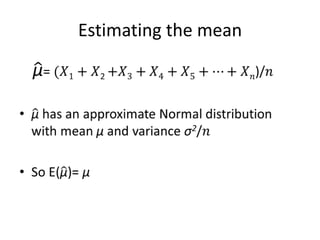
  • 2. Background μ, σ2 • Few observations made by a black box • What is the distribution behind the black box? • E.g., with what probability will it output a number bigger than 5?
  • 3. Approach • Easy to determine with many observations • With few observations.. • Assume a canonical distribution based on prior knowledge • Determine parameters of this distribution using the observations, e.g., mean, variance
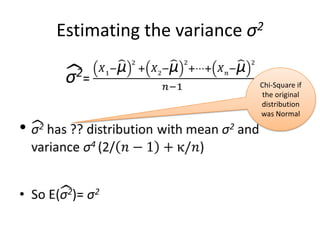
  • 5. Estimating the variance σ2 Chi-Square if the original distribution was Normal
  • 6. Microarray Data • Many genes, 25000 • 2 conditions (or more), many replicates within each condition • Which genes are differentially expressed between the two conditions?
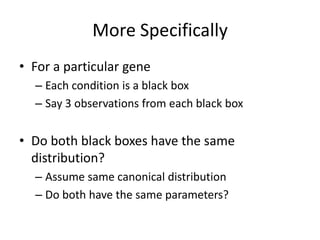
  • 7. More Specifically • For a particular gene – Each condition is a black box – Say 3 observations from each black box • Do both black boxes have the same distribution? – Assume same canonical distribution – Do both have the same parameters?
  • 8. Which Canonical Distribution • Use data with many replicates • 418.0294, 295.8019, 272.1220, 315.2978, 294.2242, 379.8320, 392.1817, 450.4758, 335.8242, 265.2478, 196.6982, 289.6532, 274.4035, 246.6807, 254.8710, 165.9416, 281.9463, 246.6434, 259.0019, 242.1968 • Distribution??
  • 9. What is a QQ Plot
  • 10. Distribution of log raw intensities across genes on a single array
  • 11. The QQ plot of log scale intensities (i.e., actual vs simulated from normal)
  • 12. QQ Plot against a Normal Distribution • 10 + 10 replicates in two groups • Single group QQ plot • Combined 2 groups QQ plot • Combined log-scale QQ plot Shapiro- Wilk Test
  • 13. Which Canonical Distribution • Assume log normal distribution
  • 14. Benford’s Law • Frequency distribution of first significant digit Pr(d<=x<d+1 )= log10(1+d)-log10(d), log10(x) is uniformly distributed in [0,1]
  • 15. Differential Expression μ1,σ12 μ2,σ22 Group 1 Group 2 Is μ1= μ2? σ1 = σ2 ? Is variance a function of mean?
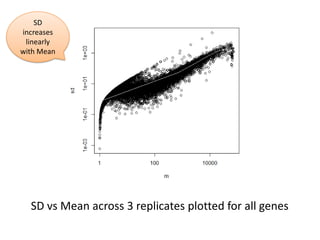
  • 16. SD increases linearly with Mean SD vs Mean across 3 replicates plotted for all genes
  • 17. SD is flat now, except for very low values Another reason to work on the log scale SD vs Mean across 3 replicates computed for all genes after log-transformation
  • 18. Differential Expression μ1,σ12 μ2,σ22 Group 1 Group 2 Is μ1= μ2? σ1 = σ2 ? Sort-of YES
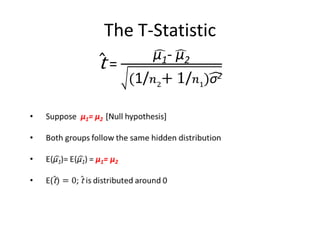
  • 22. The T-Statistic Flattened Normal or T- Distribution
  • 24. The curve fit here may be a better estimate Lots of false positives can Not much be avoided difference here here SD vs Mean across 3 replicates computed for all genes after log-transformattion