SlideShare a Scribd company logo
What Dev and Ops
should know about
Java on Linux?
Alexey Ragozin
alexey.ragozin@gmail.com
Java Memory
Java Heap
Young Gen
Old Gen
Perm Gen
Non-Heap
JVM Memory
Thread Stacks
NIO Direct Buffers
Metaspace
Compressed Class Space
Code Cache
Native JVM Memory
Non-JVM Memory (native libraries)
Java 7
Java 8
Java 8
-Xms/-Xmx
-Xmn
-XX:PermSize
-XX:MaxDirectMemorySize
-XX:ReservedCodeCacheSize
-XX:MaxMetaspaceSize
-XX:CompressedClassSpaceSize
JavaProcessMemory
-XX:ThreadStackSize per thread
Linux memory
Memory is managed in pages (4k) onx86/AMD64
(Huge page support is mostly defunct in Linux)
Pages from process point of view
- Virtual address reservation
- Committed memory page
- File mapped memory page
Linux memory
Pages from OS point of view
PrivateShared
Anonymous File backed
Shared
memory
Private
process
memory
Executables / Libraries
Memory mapped files
Memory
mapped files
Cache / Buffers
https://techtalk.intersec.com/2013/07/memory-part-1-memory-types/
Understanding memory metrics
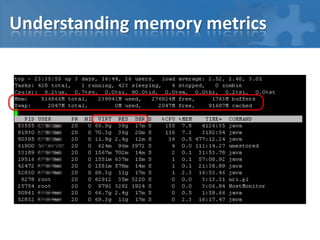
OS Memory
 Memory Used/Free – misleading metric
 Swap used – should be zero
 Buffers/Cached – essentially this is free memory*
Process
 VIRT – address space reservation - not a memory!
 RES – resident size - key memory footprint
 SHR – shared size
Understanding memory metrics
 Buffers – pages used for file system metadata
 Cached – pages mapped to file data
Non-dirty pages used for buffers/cache can
immediately to fulfill memory allocation request.
Dirty pages – writable file mapped pages which has
modifications not synchronized to disk.
Linux Process Memory Summary
Virtual
Commited
Resident
Zeroed pages
Swapped pages
Java Memory Facts
Swapping intolerance
 GC does heap wide scans
 SWT pauses prolonged by swapping
are affecting whole application threads
Java never give up memory to OS
 Strictly speaking serial GC and G1 does
 Practically you should assume it does not
JVM Process footprint > JVM Heap size
JVM Out of Memory
JVM heap is full and at –Xmx limit
 Full GC, then OOM error if not enough memory reclaimed
 OOM error is not recoverable, useful to shutdown gracefully
 -XX:OnOutOfMemoryError="kill -9 %p“
JVM heap is full but below –Xmx limit
 Heap is extended by requesting more memory from OS
 If OS rejects memory requests JVM would crash (no OOM error)
NIOdirectbufferscapacityiscappedbyJVM
 -XX:MaxDirectMemorySize=16g
 Cap is enfored by JVM
 OOM error in case is limit has been reached - recoverable
If request for memory from JVM rejected by OS
 JVM would crash
Low memory conditions
Low memory condition on server
 Swapping / Paging
 Dramatic application performance degradation
 Application freezes
 JVM crashes
Always plan server memory capacity
You should always have physical memory reserve.
Linux paravirtualization
In Docker container
 Guest resources are capped via Linux cgroups
https://en.wikipedia.org/wiki/Cgroups
 Kernel memory pools can be limited
resident / swap / memory mapped
 Limits are global for container
 Resources restrictions violations remediated by kill -9
Plan your container size carefully
ulimits
> ulimit -a
core file size (blocks, -c) 1
data seg size (kbytes, -d) unlimited
scheduling priority (-e) 0
file size (blocks, -f) unlimited
pending signals (-i) 4134823
max locked memory (kbytes, -l) 64
max memory size (kbytes, -m) 449880520
open files (-n) 1024
pipe size (512 bytes, -p) 8
POSIX message queues (bytes, -q) 819200
real-time priority (-r) 0
stack size (kbytes, -s) 8192
cpu time (seconds, -t) unlimited
max user processes (-u) 4134823
virtual memory (kbytes, -v) 425094640
file locks (-x) unlimited
May prevent you
form starting
large JVM
Core dump disabled
Setting up JVM
 -Xms = -Xmx – reserve memory on start
 GC logging options (-XX:+PrintGCDetails, etc)
http://blog.ragozin.info/2016/10/hotspot-jvm-garbage-collection-options.html
GC logging is synchronous avoid network / slow mounts
 Do JVM sizing exercise
 Choose right GC parallel threads (-XX:ParallelGCThredas)
Sometimes less is better
 Getting dump on crash
-XX:+HeapDumpOnOutOfMemoryError – may “crash” Linux
Java heap dump can be produced from Linux core dump
https://docs.oracle.com/javase/8/docs/technotes/guides/
troubleshoot/bugreports004.html#CHDHDCJD
Network tuning
Cross region data transfers (client or server)
 Tune options at socket level
 Tune Linux network caps (sysctl)
net.ipv4.tcp_rmem
net.ipv4.tcp_wmem
UDP based communications
net.core.wmem_max
net.core.rmem_max
Other OS related tuning
NUMA
 numactl --cpunodebind=xxx
 ignore JVM Numa* options
 KVM hypervisor does not support NUMA for guests
Assigning threads to cores
 taskset
Exploiting CPU isolation
 Kernel level configuration
 Threads should be taskset explicitly
Troubleshooting
Diagnostics
Troubleshooting / Diagnostics
 Native Linux tools
ps / top / vmstat / pmap / etc
 JDK tools
PID based
 JVM Attach based tools
 Perf counter based tools
JMX based tools (JVisualVM / JConsole)
JVM Flight Recorder – post analysis
 GC / JVM logs
Troubleshooting / Diagnostics
 Native Linux tools
ps / top / vmstat / pmap / etc
 JDK tools
PID based
 JVM Attach based tools
 Perf counter based tools
JMX based tools (JVisualVM / JConsole)
JVM Flight Recorder – post analysis
 GC / JVM logs
Affected by
JVM freezes
Thread CPU usage
ragoale@axcord02:~> ps -T -p 6857 -o pid,tid,%cpu,time,comm
PID TID %CPU TIME COMMAND
6857 6857 0.0 00:00:00 java
6857 6858 0.0 00:00:00 java
6857 6859 0.0 00:00:16 java
6857 6860 0.0 00:00:16 java
6857 6861 0.0 00:00:18 java
6857 6862 0.1 00:13:05 java
6857 6863 0.0 00:00:00 java
6857 6864 0.0 00:00:00 java
6857 6877 0.0 00:00:00 java
6857 6878 0.0 00:00:00 java
6857 6880 0.0 00:00:20 java
6857 6881 0.0 00:00:04 java
6857 6886 0.0 00:00:00 java
6857 6887 0.0 00:03:07 java
...
This thread mapping is “typical” and not accurate,
use jstack to get Java thread information for thread ID
VM Thread
GC Threads
Other application
and JVM threads
Thread CPU usage
jstack (JDK tool)
Full thread dump Java HotSpot(TM) 64-Bit Server VM (25.60-b23 mixed mode):
"Attach Listener" #65 daemon prio=9 os_prio=0 tid=0x0000000000cbc800 nid=0x1f0 waiting on condition [0x0000000000000000]
java.lang.Thread.State: RUNNABLE
"pool-1-thread-20" #64 prio=5 os_prio=0 tid=0x00000000009d5000 nid=0x1c04 waiting on condition [0x00007fa109e55000]
java.lang.Thread.State: WAITING (parking)
at sun.misc.Unsafe.park(Native Method)
- parking to wait for <0x00000000d3ab9e50> (a java.util.concurrent.locks.AbstractQueuedSynchronizer$ConditionObject)
at java.util.concurrent.locks.LockSupport.park(LockSupport.java:175)
at java.util.concurrent.locks.AbstractQueuedSynchronizer$ConditionObject.await(AbstractQueuedSynchronizer.java:2039)
at java.util.concurrent.ScheduledThreadPoolExecutor$DelayedWorkQueue.take(ScheduledThreadPoolExecutor.java:1088)
at java.util.concurrent.ScheduledThreadPoolExecutor$DelayedWorkQueue.take(ScheduledThreadPoolExecutor.java:809)
at java.util.concurrent.ThreadPoolExecutor.getTask(ThreadPoolExecutor.java:1067)
at java.util.concurrent.ThreadPoolExecutor.runWorker(ThreadPoolExecutor.java:1127)
at java.util.concurrent.ThreadPoolExecutor$Worker.run(ThreadPoolExecutor.java:617)
at java.lang.Thread.run(Thread.java:745)
"pool-1-thread-19" #63 prio=5 os_prio=0 tid=0x0000000000a1e800 nid=0x1bff waiting on condition [0x00007fa109f56000]
java.lang.Thread.State: WAITING (parking)
at sun.misc.Unsafe.park(Native Method)
- parking to wait for <0x00000000d3ab9e50> (a java.util.concurrent.locks.AbstractQueuedSynchronizer$ConditionObject)
at java.util.concurrent.locks.LockSupport.park(LockSupport.java:175)
at java.util.concurrent.locks.AbstractQueuedSynchronizer$ConditionObject.await(AbstractQueuedSynchronizer.java:2039)
at java.util.concurrent.ScheduledThreadPoolExecutor$DelayedWorkQueue.take(ScheduledThreadPoolExecutor.java:1088)
at java.util.concurrent.ScheduledThreadPoolExecutor$DelayedWorkQueue.take(ScheduledThreadPoolExecutor.java:809)
...
Linux thread ID in hex
jstack forces STW pause in target JVM!
Thread CPU usage
sjk ttop command - https://github.com/aragozin/jvm-tools
2016-07-27T07:47:20.674-0400 Process summary
process cpu=8.11%
application cpu=2.17% (user=1.52% sys=0.65%)
other: cpu=5.95%
GC cpu=0.00% (young=0.00%, old=0.00%)
heap allocation rate 1842kb/s
safe point rate: 1.1 (events/s) avg. safe point pause: 0.43ms
safe point sync time: 0.01% processing time: 0.04% (wallclock time)
[003120] user= 1.12% sys= 0.24% alloc= 983kb/s - RMI TCP Connection(1)-172.17.168.11
[000039] user= 0.30% sys= 0.26% alloc= 701kb/s - DB feed - UserPermission.DBWatcher
[000053] user= 0.00% sys= 0.05% alloc= 50kb/s - Statistics
[000038] user= 0.00% sys= 0.05% alloc= 4584b/s – Reactor-0
[000049] user= 0.00% sys= 0.03% alloc= 38kb/s - DB feed - UserInfo.DBWatcher
[000036] user= 0.00% sys= 0.03% alloc= 0b/s - Abandoned connection cleanup thread
[003122] user= 0.00% sys= 0.03% alloc= 4915b/s - JMX server connection timeout 3122
[000040] user= 0.10% sys=-0.09% alloc= 8321b/s - DB feed - Report.DBWatcher
[000050] user= 0.00% sys= 0.01% alloc= 24kb/s - DB feed - Rule.DBWatcher
[000051] user= 0.00% sys= 0.01% alloc= 9034b/s - DB feed - EmailAccount.DBWatcher
[000044] user= 0.00% sys= 0.01% alloc= 4840b/s - DB feed - Analytics.DBWatcher
[000041] user= 0.00% sys= 0.01% alloc= 9999b/s - DB feed - Contact.DBWatcher
[000054] user= 0.00% sys= 0.01% alloc= 3481b/s – Statistics
[000001] user= 0.00% sys= 0.00% alloc= 0b/s - main
[000002] user= 0.00% sys= 0.00% alloc= 0b/s - Reference Handler
[000003] user= 0.00% sys= 0.00% alloc= 0b/s - Finalizer
[000005] user= 0.00% sys= 0.00% alloc= 0b/s - Signal Dispatcher
[000008] user= 0.00% sys= 0.00% alloc= 0b/s - JFR request timer
[000010] user= 0.00% sys= 0.00% alloc= 0b/s - VM JFR Buffer Thread
Does not infer STW pauses on target process
Leaking OS resources
Linux OS has number cap on file handles
if exceeded …
 Cannot open new files
 Cannot connect / accept socket connections
Garbage collector closes handles automatically
 Files and sockets
 Eventually …
 Always close your files and sockets
Resources which cannot be explicitly disposed
 File memory mappings
 NIO direct buffers
Unfinalized objects can be inspected in heap dump
Other useful JDK tools
jinfo
 query / update XX JVM options (e.g. enable/adjust GC logging)
 query system properties (including dynamically updated)
jstat
 can be used for monitoring heap dynamics
jcmd
 universal tool for JVM Attach interface
 jcmd PID PerfCounter.print – dumps all JVM perfcounters,
useful for monitoring
THANK YOU
Alexey Ragozin
alexey.ragozin@gmail.com
http://blog.ragozin.info

More Related Content

What's hot (19)

PPT
Find bottleneck and tuning in Java Application
guest1f2740
 
PPTX
자바 성능 강의
Terry Cho
 
PPTX
Am I reading GC logs Correctly?
Tier1 App
 
PPTX
Ch10.애플리케이션 서버의 병목_발견_방법
Minchul Jung
 
PDF
淺談 Java GC 原理、調教和 新發展
Leon Chen
 
PPTX
Don't dump thread dumps
Tier1app
 
PPTX
Pick diamonds from garbage
Tier1 App
 
PDF
JVM and Garbage Collection Tuning
Kai Koenig
 
PDF
Oracle Latch and Mutex Contention Troubleshooting
Tanel Poder
 
KEY
PyCon US 2012 - Web Server Bottlenecks and Performance Tuning
Graham Dumpleton
 
PDF
Diagnosing Your Application on the JVM
Staffan Larsen
 
PDF
77739818 troubleshooting-web-logic-103
shashank_ibm
 
PDF
Embedded systems
Katy Anton
 
PDF
Integrated Cache on Netscaler
Mark Hillick
 
PDF
Tanel Poder - Troubleshooting Complex Oracle Performance Issues - Part 2
Tanel Poder
 
PDF
Erik Skytthe - Monitoring Mesos, Docker, Containers with Zabbix | ZabConf2016
Zabbix
 
PDF
Troubleshooting Complex Oracle Performance Problems with Tanel Poder
Tanel Poder
 
PDF
Advanced Oracle Troubleshooting
Hector Martinez
 
PDF
Cassandra - lesson learned
Andrzej Ludwikowski
 
Find bottleneck and tuning in Java Application
guest1f2740
 
자바 성능 강의
Terry Cho
 
Am I reading GC logs Correctly?
Tier1 App
 
Ch10.애플리케이션 서버의 병목_발견_방법
Minchul Jung
 
淺談 Java GC 原理、調教和 新發展
Leon Chen
 
Don't dump thread dumps
Tier1app
 
Pick diamonds from garbage
Tier1 App
 
JVM and Garbage Collection Tuning
Kai Koenig
 
Oracle Latch and Mutex Contention Troubleshooting
Tanel Poder
 
PyCon US 2012 - Web Server Bottlenecks and Performance Tuning
Graham Dumpleton
 
Diagnosing Your Application on the JVM
Staffan Larsen
 
77739818 troubleshooting-web-logic-103
shashank_ibm
 
Embedded systems
Katy Anton
 
Integrated Cache on Netscaler
Mark Hillick
 
Tanel Poder - Troubleshooting Complex Oracle Performance Issues - Part 2
Tanel Poder
 
Erik Skytthe - Monitoring Mesos, Docker, Containers with Zabbix | ZabConf2016
Zabbix
 
Troubleshooting Complex Oracle Performance Problems with Tanel Poder
Tanel Poder
 
Advanced Oracle Troubleshooting
Hector Martinez
 
Cassandra - lesson learned
Andrzej Ludwikowski
 

Similar to Java on Linux for devs and ops (20)

PPTX
Java и Linux — особенности эксплуатации / Алексей Рагозин (Дойче Банк)
Ontico
 
PDF
Java tuning on GNU/Linux for busy dev
Tomek Borek
 
ODP
Jvm tuning in a rush! - Lviv JUG
Tomek Borek
 
PPTX
7 jvm-arguments-Confoo
Tier1 app
 
PDF
Inside The Java Virtual Machine
elliando dias
 
PDF
Tomcatx troubleshooting-production
Vladimir Khokhryakov
 
PPT
Inside the JVM
Jim Jagielski
 
PDF
Mastering java in containers - MadridJUG
Jorge Morales
 
PDF
Java and cgroups eng
Ralf Ernst
 
PDF
[BGOUG] Java GC - Friend or Foe
SAP HANA Cloud Platform
 
PDF
JavaOne 2010: Top 10 Causes for Java Issues in Production and What to Do When...
srisatish ambati
 
PDF
Taming The JVM
Matthew McCullough
 
PDF
Javaday 2022 - Remèdes aux oomkill, warm-ups, et lenteurs pour des conteneur...
Jean-Philippe BEMPEL
 
PDF
State of Java Elasticity. Tuning Java Efficiency - GIDS.JAVA LIVE 2020
Jelastic Multi-Cloud PaaS
 
PPTX
Considerations when deploying Java on Kubernetes
superserch
 
PDF
Gclogs j1
Kirk Pepperdine
 
PPTX
JavaOne2016 - Microservices: Terabytes in Microseconds [CON4516]
Speedment, Inc.
 
PPTX
JavaOne2016 - Microservices: Terabytes in Microseconds [CON4516]
Malin Weiss
 
PPTX
Java performance
Sachin Shukla
 
PPT
How to Stop Worrying and Start Caching in Java
srisatish ambati
 
Java и Linux — особенности эксплуатации / Алексей Рагозин (Дойче Банк)
Ontico
 
Java tuning on GNU/Linux for busy dev
Tomek Borek
 
Jvm tuning in a rush! - Lviv JUG
Tomek Borek
 
7 jvm-arguments-Confoo
Tier1 app
 
Inside The Java Virtual Machine
elliando dias
 
Tomcatx troubleshooting-production
Vladimir Khokhryakov
 
Inside the JVM
Jim Jagielski
 
Mastering java in containers - MadridJUG
Jorge Morales
 
Java and cgroups eng
Ralf Ernst
 
[BGOUG] Java GC - Friend or Foe
SAP HANA Cloud Platform
 
JavaOne 2010: Top 10 Causes for Java Issues in Production and What to Do When...
srisatish ambati
 
Taming The JVM
Matthew McCullough
 
Javaday 2022 - Remèdes aux oomkill, warm-ups, et lenteurs pour des conteneur...
Jean-Philippe BEMPEL
 
State of Java Elasticity. Tuning Java Efficiency - GIDS.JAVA LIVE 2020
Jelastic Multi-Cloud PaaS
 
Considerations when deploying Java on Kubernetes
superserch
 
Gclogs j1
Kirk Pepperdine
 
JavaOne2016 - Microservices: Terabytes in Microseconds [CON4516]
Speedment, Inc.
 
JavaOne2016 - Microservices: Terabytes in Microseconds [CON4516]
Malin Weiss
 
Java performance
Sachin Shukla
 
How to Stop Worrying and Start Caching in Java
srisatish ambati
 
Ad

More from aragozin (20)

PDF
Распределённое нагрузочное тестирование на Java
aragozin
 
PPTX
Java black box profiling
aragozin
 
PDF
Блеск и нищета распределённых кэшей
aragozin
 
PDF
JIT compilation in modern platforms – challenges and solutions
aragozin
 
PDF
Casual mass parallel computing
aragozin
 
PPTX
Nanocloud cloud scale jvm
aragozin
 
PDF
Java GC tuning and monitoring (by Alexander Ashitkin)
aragozin
 
PDF
Garbage collection in JVM
aragozin
 
PDF
Filtering 100M objects in Coherence cache. What can go wrong?
aragozin
 
PDF
Cборка мусора в Java без пауз (HighLoad++ 2013)
aragozin
 
PDF
JIT-компиляция в виртуальной машине Java (HighLoad++ 2013)
aragozin
 
PDF
Performance Test Driven Development (CEE SERC 2013 Moscow)
aragozin
 
PDF
Performance Test Driven Development with Oracle Coherence
aragozin
 
PPTX
Борьба с GС паузами в JVM
aragozin
 
PPTX
Распределённый кэш или хранилище данных. Что выбрать?
aragozin
 
PPTX
Devirtualization of method calls
aragozin
 
PPTX
Tech talk network - friend or foe
aragozin
 
PDF
Database backed coherence cache
aragozin
 
PDF
ORM and distributed caching
aragozin
 
PDF
Секреты сборки мусора в Java [DUMP-IT 2012]
aragozin
 
Распределённое нагрузочное тестирование на Java
aragozin
 
Java black box profiling
aragozin
 
Блеск и нищета распределённых кэшей
aragozin
 
JIT compilation in modern platforms – challenges and solutions
aragozin
 
Casual mass parallel computing
aragozin
 
Nanocloud cloud scale jvm
aragozin
 
Java GC tuning and monitoring (by Alexander Ashitkin)
aragozin
 
Garbage collection in JVM
aragozin
 
Filtering 100M objects in Coherence cache. What can go wrong?
aragozin
 
Cборка мусора в Java без пауз (HighLoad++ 2013)
aragozin
 
JIT-компиляция в виртуальной машине Java (HighLoad++ 2013)
aragozin
 
Performance Test Driven Development (CEE SERC 2013 Moscow)
aragozin
 
Performance Test Driven Development with Oracle Coherence
aragozin
 
Борьба с GС паузами в JVM
aragozin
 
Распределённый кэш или хранилище данных. Что выбрать?
aragozin
 
Devirtualization of method calls
aragozin
 
Tech talk network - friend or foe
aragozin
 
Database backed coherence cache
aragozin
 
ORM and distributed caching
aragozin
 
Секреты сборки мусора в Java [DUMP-IT 2012]
aragozin
 
Ad

Recently uploaded (20)

PDF
TheFutureIsDynamic-BoxLang witch Luis Majano.pdf
Ortus Solutions, Corp
 
PDF
IDM Crack with Internet Download Manager 6.42 Build 43 with Patch Latest 2025
bashirkhan333g
 
PPTX
AEM User Group: India Chapter Kickoff Meeting
jennaf3
 
PDF
MiniTool Partition Wizard Free Crack + Full Free Download 2025
bashirkhan333g
 
PPTX
Transforming Mining & Engineering Operations with Odoo ERP | Streamline Proje...
SatishKumar2651
 
PPTX
In From the Cold: Open Source as Part of Mainstream Software Asset Management
Shane Coughlan
 
PDF
The 5 Reasons for IT Maintenance - Arna Softech
Arna Softech
 
PDF
Linux Certificate of Completion - LabEx Certificate
VICTOR MAESTRE RAMIREZ
 
PPTX
Tally_Basic_Operations_Presentation.pptx
AditiBansal54083
 
PDF
iTop VPN With Crack Lifetime Activation Key-CODE
utfefguu
 
PPTX
Hardware(Central Processing Unit ) CU and ALU
RizwanaKalsoom2
 
PPTX
Agentic Automation Journey Series Day 2 – Prompt Engineering for UiPath Agents
klpathrudu
 
PPTX
Foundations of Marketo Engage - Powering Campaigns with Marketo Personalization
bbedford2
 
PDF
Empower Your Tech Vision- Why Businesses Prefer to Hire Remote Developers fro...
logixshapers59
 
PDF
4K Video Downloader Plus Pro Crack for MacOS New Download 2025
bashirkhan333g
 
PPTX
Help for Correlations in IBM SPSS Statistics.pptx
Version 1 Analytics
 
PPTX
Homogeneity of Variance Test Options IBM SPSS Statistics Version 31.pptx
Version 1 Analytics
 
PDF
SciPy 2025 - Packaging a Scientific Python Project
Henry Schreiner
 
PDF
유니티에서 Burst Compiler+ThreadedJobs+SIMD 적용사례
Seongdae Kim
 
PDF
vMix Pro 28.0.0.42 Download vMix Registration key Bundle
kulindacore
 
TheFutureIsDynamic-BoxLang witch Luis Majano.pdf
Ortus Solutions, Corp
 
IDM Crack with Internet Download Manager 6.42 Build 43 with Patch Latest 2025
bashirkhan333g
 
AEM User Group: India Chapter Kickoff Meeting
jennaf3
 
MiniTool Partition Wizard Free Crack + Full Free Download 2025
bashirkhan333g
 
Transforming Mining & Engineering Operations with Odoo ERP | Streamline Proje...
SatishKumar2651
 
In From the Cold: Open Source as Part of Mainstream Software Asset Management
Shane Coughlan
 
The 5 Reasons for IT Maintenance - Arna Softech
Arna Softech
 
Linux Certificate of Completion - LabEx Certificate
VICTOR MAESTRE RAMIREZ
 
Tally_Basic_Operations_Presentation.pptx
AditiBansal54083
 
iTop VPN With Crack Lifetime Activation Key-CODE
utfefguu
 
Hardware(Central Processing Unit ) CU and ALU
RizwanaKalsoom2
 
Agentic Automation Journey Series Day 2 – Prompt Engineering for UiPath Agents
klpathrudu
 
Foundations of Marketo Engage - Powering Campaigns with Marketo Personalization
bbedford2
 
Empower Your Tech Vision- Why Businesses Prefer to Hire Remote Developers fro...
logixshapers59
 
4K Video Downloader Plus Pro Crack for MacOS New Download 2025
bashirkhan333g
 
Help for Correlations in IBM SPSS Statistics.pptx
Version 1 Analytics
 
Homogeneity of Variance Test Options IBM SPSS Statistics Version 31.pptx
Version 1 Analytics
 
SciPy 2025 - Packaging a Scientific Python Project
Henry Schreiner
 
유니티에서 Burst Compiler+ThreadedJobs+SIMD 적용사례
Seongdae Kim
 
vMix Pro 28.0.0.42 Download vMix Registration key Bundle
kulindacore
 

Java on Linux for devs and ops

  • 1. What Dev and Ops should know about Java on Linux? Alexey Ragozin [email protected]
  • 2. Java Memory Java Heap Young Gen Old Gen Perm Gen Non-Heap JVM Memory Thread Stacks NIO Direct Buffers Metaspace Compressed Class Space Code Cache Native JVM Memory Non-JVM Memory (native libraries) Java 7 Java 8 Java 8 -Xms/-Xmx -Xmn -XX:PermSize -XX:MaxDirectMemorySize -XX:ReservedCodeCacheSize -XX:MaxMetaspaceSize -XX:CompressedClassSpaceSize JavaProcessMemory -XX:ThreadStackSize per thread
  • 3. Linux memory Memory is managed in pages (4k) onx86/AMD64 (Huge page support is mostly defunct in Linux) Pages from process point of view - Virtual address reservation - Committed memory page - File mapped memory page
  • 4. Linux memory Pages from OS point of view PrivateShared Anonymous File backed Shared memory Private process memory Executables / Libraries Memory mapped files Memory mapped files Cache / Buffers https://techtalk.intersec.com/2013/07/memory-part-1-memory-types/
  • 6. Understanding memory metrics OS Memory  Memory Used/Free – misleading metric  Swap used – should be zero  Buffers/Cached – essentially this is free memory* Process  VIRT – address space reservation - not a memory!  RES – resident size - key memory footprint  SHR – shared size
  • 7. Understanding memory metrics  Buffers – pages used for file system metadata  Cached – pages mapped to file data Non-dirty pages used for buffers/cache can immediately to fulfill memory allocation request. Dirty pages – writable file mapped pages which has modifications not synchronized to disk.
  • 8. Linux Process Memory Summary Virtual Commited Resident Zeroed pages Swapped pages
  • 9. Java Memory Facts Swapping intolerance  GC does heap wide scans  SWT pauses prolonged by swapping are affecting whole application threads Java never give up memory to OS  Strictly speaking serial GC and G1 does  Practically you should assume it does not JVM Process footprint > JVM Heap size
  • 10. JVM Out of Memory JVM heap is full and at –Xmx limit  Full GC, then OOM error if not enough memory reclaimed  OOM error is not recoverable, useful to shutdown gracefully  -XX:OnOutOfMemoryError="kill -9 %p“ JVM heap is full but below –Xmx limit  Heap is extended by requesting more memory from OS  If OS rejects memory requests JVM would crash (no OOM error) NIOdirectbufferscapacityiscappedbyJVM  -XX:MaxDirectMemorySize=16g  Cap is enfored by JVM  OOM error in case is limit has been reached - recoverable If request for memory from JVM rejected by OS  JVM would crash
  • 11. Low memory conditions Low memory condition on server  Swapping / Paging  Dramatic application performance degradation  Application freezes  JVM crashes Always plan server memory capacity You should always have physical memory reserve.
  • 12. Linux paravirtualization In Docker container  Guest resources are capped via Linux cgroups https://en.wikipedia.org/wiki/Cgroups  Kernel memory pools can be limited resident / swap / memory mapped  Limits are global for container  Resources restrictions violations remediated by kill -9 Plan your container size carefully
  • 13. ulimits > ulimit -a core file size (blocks, -c) 1 data seg size (kbytes, -d) unlimited scheduling priority (-e) 0 file size (blocks, -f) unlimited pending signals (-i) 4134823 max locked memory (kbytes, -l) 64 max memory size (kbytes, -m) 449880520 open files (-n) 1024 pipe size (512 bytes, -p) 8 POSIX message queues (bytes, -q) 819200 real-time priority (-r) 0 stack size (kbytes, -s) 8192 cpu time (seconds, -t) unlimited max user processes (-u) 4134823 virtual memory (kbytes, -v) 425094640 file locks (-x) unlimited May prevent you form starting large JVM Core dump disabled
  • 14. Setting up JVM  -Xms = -Xmx – reserve memory on start  GC logging options (-XX:+PrintGCDetails, etc) http://blog.ragozin.info/2016/10/hotspot-jvm-garbage-collection-options.html GC logging is synchronous avoid network / slow mounts  Do JVM sizing exercise  Choose right GC parallel threads (-XX:ParallelGCThredas) Sometimes less is better  Getting dump on crash -XX:+HeapDumpOnOutOfMemoryError – may “crash” Linux Java heap dump can be produced from Linux core dump https://docs.oracle.com/javase/8/docs/technotes/guides/ troubleshoot/bugreports004.html#CHDHDCJD
  • 15. Network tuning Cross region data transfers (client or server)  Tune options at socket level  Tune Linux network caps (sysctl) net.ipv4.tcp_rmem net.ipv4.tcp_wmem UDP based communications net.core.wmem_max net.core.rmem_max
  • 16. Other OS related tuning NUMA  numactl --cpunodebind=xxx  ignore JVM Numa* options  KVM hypervisor does not support NUMA for guests Assigning threads to cores  taskset Exploiting CPU isolation  Kernel level configuration  Threads should be taskset explicitly
  • 18. Troubleshooting / Diagnostics  Native Linux tools ps / top / vmstat / pmap / etc  JDK tools PID based  JVM Attach based tools  Perf counter based tools JMX based tools (JVisualVM / JConsole) JVM Flight Recorder – post analysis  GC / JVM logs
  • 19. Troubleshooting / Diagnostics  Native Linux tools ps / top / vmstat / pmap / etc  JDK tools PID based  JVM Attach based tools  Perf counter based tools JMX based tools (JVisualVM / JConsole) JVM Flight Recorder – post analysis  GC / JVM logs Affected by JVM freezes
  • 20. Thread CPU usage ragoale@axcord02:~> ps -T -p 6857 -o pid,tid,%cpu,time,comm PID TID %CPU TIME COMMAND 6857 6857 0.0 00:00:00 java 6857 6858 0.0 00:00:00 java 6857 6859 0.0 00:00:16 java 6857 6860 0.0 00:00:16 java 6857 6861 0.0 00:00:18 java 6857 6862 0.1 00:13:05 java 6857 6863 0.0 00:00:00 java 6857 6864 0.0 00:00:00 java 6857 6877 0.0 00:00:00 java 6857 6878 0.0 00:00:00 java 6857 6880 0.0 00:00:20 java 6857 6881 0.0 00:00:04 java 6857 6886 0.0 00:00:00 java 6857 6887 0.0 00:03:07 java ... This thread mapping is “typical” and not accurate, use jstack to get Java thread information for thread ID VM Thread GC Threads Other application and JVM threads
  • 21. Thread CPU usage jstack (JDK tool) Full thread dump Java HotSpot(TM) 64-Bit Server VM (25.60-b23 mixed mode): "Attach Listener" #65 daemon prio=9 os_prio=0 tid=0x0000000000cbc800 nid=0x1f0 waiting on condition [0x0000000000000000] java.lang.Thread.State: RUNNABLE "pool-1-thread-20" #64 prio=5 os_prio=0 tid=0x00000000009d5000 nid=0x1c04 waiting on condition [0x00007fa109e55000] java.lang.Thread.State: WAITING (parking) at sun.misc.Unsafe.park(Native Method) - parking to wait for <0x00000000d3ab9e50> (a java.util.concurrent.locks.AbstractQueuedSynchronizer$ConditionObject) at java.util.concurrent.locks.LockSupport.park(LockSupport.java:175) at java.util.concurrent.locks.AbstractQueuedSynchronizer$ConditionObject.await(AbstractQueuedSynchronizer.java:2039) at java.util.concurrent.ScheduledThreadPoolExecutor$DelayedWorkQueue.take(ScheduledThreadPoolExecutor.java:1088) at java.util.concurrent.ScheduledThreadPoolExecutor$DelayedWorkQueue.take(ScheduledThreadPoolExecutor.java:809) at java.util.concurrent.ThreadPoolExecutor.getTask(ThreadPoolExecutor.java:1067) at java.util.concurrent.ThreadPoolExecutor.runWorker(ThreadPoolExecutor.java:1127) at java.util.concurrent.ThreadPoolExecutor$Worker.run(ThreadPoolExecutor.java:617) at java.lang.Thread.run(Thread.java:745) "pool-1-thread-19" #63 prio=5 os_prio=0 tid=0x0000000000a1e800 nid=0x1bff waiting on condition [0x00007fa109f56000] java.lang.Thread.State: WAITING (parking) at sun.misc.Unsafe.park(Native Method) - parking to wait for <0x00000000d3ab9e50> (a java.util.concurrent.locks.AbstractQueuedSynchronizer$ConditionObject) at java.util.concurrent.locks.LockSupport.park(LockSupport.java:175) at java.util.concurrent.locks.AbstractQueuedSynchronizer$ConditionObject.await(AbstractQueuedSynchronizer.java:2039) at java.util.concurrent.ScheduledThreadPoolExecutor$DelayedWorkQueue.take(ScheduledThreadPoolExecutor.java:1088) at java.util.concurrent.ScheduledThreadPoolExecutor$DelayedWorkQueue.take(ScheduledThreadPoolExecutor.java:809) ... Linux thread ID in hex jstack forces STW pause in target JVM!
  • 22. Thread CPU usage sjk ttop command - https://github.com/aragozin/jvm-tools 2016-07-27T07:47:20.674-0400 Process summary process cpu=8.11% application cpu=2.17% (user=1.52% sys=0.65%) other: cpu=5.95% GC cpu=0.00% (young=0.00%, old=0.00%) heap allocation rate 1842kb/s safe point rate: 1.1 (events/s) avg. safe point pause: 0.43ms safe point sync time: 0.01% processing time: 0.04% (wallclock time) [003120] user= 1.12% sys= 0.24% alloc= 983kb/s - RMI TCP Connection(1)-172.17.168.11 [000039] user= 0.30% sys= 0.26% alloc= 701kb/s - DB feed - UserPermission.DBWatcher [000053] user= 0.00% sys= 0.05% alloc= 50kb/s - Statistics [000038] user= 0.00% sys= 0.05% alloc= 4584b/s – Reactor-0 [000049] user= 0.00% sys= 0.03% alloc= 38kb/s - DB feed - UserInfo.DBWatcher [000036] user= 0.00% sys= 0.03% alloc= 0b/s - Abandoned connection cleanup thread [003122] user= 0.00% sys= 0.03% alloc= 4915b/s - JMX server connection timeout 3122 [000040] user= 0.10% sys=-0.09% alloc= 8321b/s - DB feed - Report.DBWatcher [000050] user= 0.00% sys= 0.01% alloc= 24kb/s - DB feed - Rule.DBWatcher [000051] user= 0.00% sys= 0.01% alloc= 9034b/s - DB feed - EmailAccount.DBWatcher [000044] user= 0.00% sys= 0.01% alloc= 4840b/s - DB feed - Analytics.DBWatcher [000041] user= 0.00% sys= 0.01% alloc= 9999b/s - DB feed - Contact.DBWatcher [000054] user= 0.00% sys= 0.01% alloc= 3481b/s – Statistics [000001] user= 0.00% sys= 0.00% alloc= 0b/s - main [000002] user= 0.00% sys= 0.00% alloc= 0b/s - Reference Handler [000003] user= 0.00% sys= 0.00% alloc= 0b/s - Finalizer [000005] user= 0.00% sys= 0.00% alloc= 0b/s - Signal Dispatcher [000008] user= 0.00% sys= 0.00% alloc= 0b/s - JFR request timer [000010] user= 0.00% sys= 0.00% alloc= 0b/s - VM JFR Buffer Thread Does not infer STW pauses on target process
  • 23. Leaking OS resources Linux OS has number cap on file handles if exceeded …  Cannot open new files  Cannot connect / accept socket connections Garbage collector closes handles automatically  Files and sockets  Eventually …  Always close your files and sockets Resources which cannot be explicitly disposed  File memory mappings  NIO direct buffers Unfinalized objects can be inspected in heap dump
  • 24. Other useful JDK tools jinfo  query / update XX JVM options (e.g. enable/adjust GC logging)  query system properties (including dynamically updated) jstat  can be used for monitoring heap dynamics jcmd  universal tool for JVM Attach interface  jcmd PID PerfCounter.print – dumps all JVM perfcounters, useful for monitoring