Introduction of Java GC Tuning and Java Java Mission Control
74 likes20,551 views

This document provides an introduction and overview of Java garbage collection (GC) tuning and the Java Mission Control tool. It begins with information about the speaker, Leon Chen, including his background and patents. It then outlines the Java and JVM roadmap and upcoming features. The bulk of the document discusses GC tuning concepts like heap sizing, generation sizing, footprint vs throughput vs latency. It provides examples and recommendations for GC logging, analysis tools like GCViewer and JWorks GC Web. The document is intended to outline Oracle's product direction and future plans for Java GC tuning and tools.


![The Problem: The ”Intermittent Cycle”
SLA
Breach
Server
restart
• [Sun 21:00]
• [Sun 24:00]
XXXX
Analyze
logs
• [Mon 09:30]
Turn on
detailed
logging
• [Tue 13:00]
Analyze
logs
• [Fri 09:00]
Turn off
detailed
logging
• [Fri 24:00]
Analyze Logs
and JFR
• [Mon 09:30]
98](https://image.slidesharecdn.com/javaoptimizationtwjug-131222104941-phpapp01/85/Introduction-of-Java-GC-Tuning-and-Java-Java-Mission-Control-90-320.jpg)


Introduction of Java GC Tuning and Java Java Mission Control
- 1. <Insert Picture Here> Introduction of Java GC Tuning and Java Java Mission Control Leon Chen (陳逸嘉) Principal Sales Consultant Oracle
- 2. The following is intended to outline our general product direction. It is intended for information purposes only, and may not be incorporated into any contract. It is not a commitment to deliver any material, code, or functionality, and should not be relied upon in making purchasing decisions. The development, release, and timing of any features or functionality described for Oracle’s products remains at the sole discretion of Oracle.
- 3. Leon Chen (陳逸嘉) • More than 14 years in Java/JEE, as programmer, architect, leader and consultant, in finance/telecom domain. • • • • • 工研院 得捷 新光人壽 Ericsson Oracle
- 4. • TW Patent 182927, 一種文章切割方法, 2003, 陳逸嘉, 林一中 • TW Patent 206819, 自動服務組合方法及系統, 2004, 陳逸嘉, 許 維德, 洪鵬翔 • US Patent 7,617,174, Method and system for automatic service composition, 2009, Leon Chen, Wei-Tek Hsu, PengHsiang Hung
- 5. Java Roadmap
- 6. JRockit Hotspot HotRockit (JDK7_update 40 almost; JDK 8, 2014 暫定)
- 7. Java SE Roadmap JDK 8 (Q1 2014) 7u40 7u21 • Java Client Security Enhancements • App Store Packaging tools • Java Flight Recorder • Java Mission Control 5.2 • Java Discovery Protocol • Native memory tracking • Local Security Policy 2013 • Lambda • JVM Convergence • JavaScript Interop • JavaFX 8 • 3D API • Java SE Embedded support • Enhanced HTML5 support JDK 9 • Modularity – Jigsaw • Interoperability • Cloud • Ease of Use • JavaFX JSR • Optimizations JDK 8u40 2014 2015 2016 NetBeans IDE 7.3 NetBeans IDE 8 JDK 8u20 NetBeans IDE 9 • New hints and refactoring • Scene Builder Support • JDK 8 support • Scene Builder 2.0 support • Deterministic G1 • Java Mission Control 6.0 • Improved JRE installer • App bundling enhancements • JDK 9 support • Scene Builder 3.0 support Scene Builder 2.0 Scene Builder 1.1 • Linux support • JavaFX 8 support • Enhanced Java IDE support Scene Builder 3.0 • JavaFX 9 support
- 9. 32-bit VS. 64-bit • 32-bit • For heap sizes up to 2.5G/3G or so • 64-bit • Windows/Linux: different JVM, Solaris: add -d64 • -XX:+UseCompressedOops (default JDK6_23+) • Compressed references: 32GB Max (26GB best) • -Xmx: 26G (compressed) / unlimited (regular) • 32-bit 64-bit migration • Higher heap size requirements (around 20%) • Slight throughput impact (without compressed refs) • 64-bit preferred for today’s servers • Only option starting with Fusion Middleware 12c
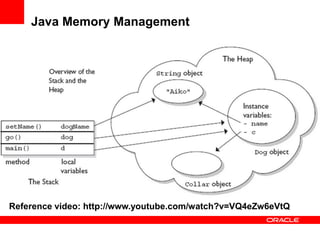
- 10. Java Memory Management Reference video: http://www.youtube.com/watch?v=VQ4eZw6eVtQ
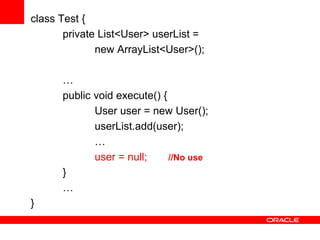
- 11. class Test { private List<User> userList = new ArrayList<User>(); … public void execute() { User user = new User(); userList.add(user); … user = null; //No use } … }
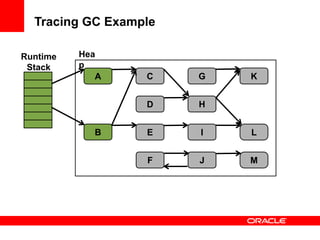
- 16. Tracing GC Example Runtime Stack Heap A G D H E I L F B C J M We identified all reachable objects. We can deduce that the rest are unreachable and, therefore, dead. K
- 17. Tracing GC Example Runtime Stack Heap A C K H B E I We identified all reachable objects. We can deduce that the rest are unreachable and, therefore, dead. L
- 20. 花太多時間做 GC → Performance變慢 Performance變慢→花太多時間做 GC 不一定!!!
- 21. JVM Performance Tuning Performance Tuning Process Oracle confidential; Pending legal review
- 22. GC Logging in Production • Don’t be afraid to enable GC logging in production – Very helpful when diagnosing production issues • Extremely low / non-existent overhead – Maybe some large files in your file system. – We are surprised that customers are still afraid to enable it
- 23. If Someone doesn’t enable GC logging in production I shoot them!
- 24. Most Important GC Logging Parameters • You need at least: – -XX:+PrintGCTimeStamps • Add -XX:+PrintGCDateStamps if you must know the time – -XX:+PrintGCDetails • Preferred over -verbosegc as it's more detailed • Also useful: – -Xloggc:<file> – Rotate GC Log, After Java 1.6_34 (or 1.7_2): -XX:+UseGCLogFileRotation -XX:NumberOfGCLogFiles=5 -XX:GCLogFileSize=10M
- 25. JVM Performance Tuning GCViewer – Offline analysis of GC logs https://github.com/chewiebug/GCViewer
- 26. JVM Performance Tuning GCViewer – Memory Leak Pattern
- 27. JWorks GC Web (Beta) http://jworks.idv.tw/GcWeb/
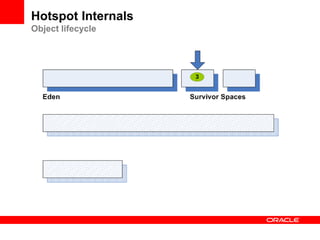
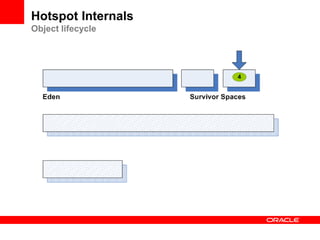
- 28. Java Heap Structure and GC
- 29. Hotspot JVM Heap Layout Total memory, for 32bits, max = 2^32 = 4GB. In windows is 2GB, so max JVM Heap is about 1.6GB ~ 1.8GB Native Young Old Young Generation – Eden where new objects get instantiated – 2 Survivor Spaces to hold live objects during minor GC Old Generation – For tenured objects Permanent Generation – JVM meta data
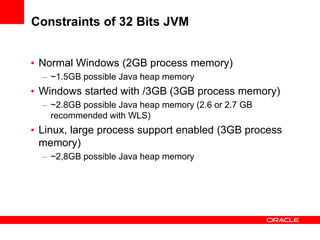
- 30. Constraints of 32 Bits JVM • Normal Windows (2GB process memory) – ~1.5GB possible Java heap memory • Windows started with /3GB (3GB process memory) – ~2.8GB possible Java heap memory (2.6 or 2.7 GB recommended with WLS) • Linux, large process support enabled (3GB process memory) – ~2,8GB possible Java heap memory
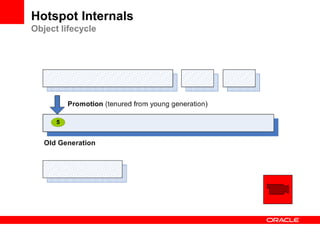
- 31. Hotspot Internals Generations & Object Lifecycle Eden S0 S1
- 42. Hotspot Tuning Sizing Heap • Young Generation size determines • Frequency of minor GC • Number of objects reclaimed in minor GC • Old Generation Size • Should hold application's steady-state live data size • Try to minimize frequency of major GC’s • JVM footprint should not exceed physical memory • Max of 80-90% RAM (leave room for OS) • Thumb Rule: Try to maximize objects reclaimed in young gen. Minimize Full GC frequency
- 43. Calculate Live Data Size (LDS) • Make sure you get full GCs during steady-state • Induce a couple if necessary • JConsole / VisualVM • Connect to the JVM, click on the “Perform GC” button • jmap • jmap -histo:live <pid> • Can even introduce a thread that does regular System.gc()'s • Just for this data gathering purpose, OK? Remove it before deployment. :-)
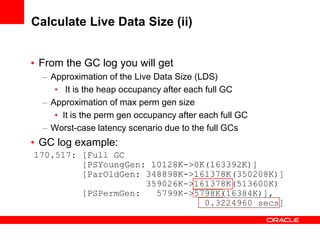
- 44. Calculate Live Data Size (ii) • From the GC log you will get – Approximation of the Live Data Size (LDS) • It is the heap occupancy after each full GC – Approximation of max perm gen size • It is the perm gen occupancy after each full GC – Worst-case latency scenario due to the full GCs • GC log example:
- 45. GC Triggered Heap Usage Size of ”long lived objects” Max Java Heap
- 46. Initial Heap Configuration • You can now make an informed decision on choosing a reasonable heap size – Rule of thumb • Set -Xms and -Xmx to 3x to 4x LDS • Set both -XX:PermSize and -XX:MaxPermSize to around 1.2x to 1.5x the max perm gen size • Set the generation sizes accordingly – Rule of thumb • Young gen should be around 1x to 1.5x LDS • Old gen should be around 2x to 3x LDS • e.g., young gen should be around 1/3-1/4 of the heap size • e.g., For LDS of 512m : -Xmn768m -Xms2g -Xmx2g
- 47. Hotspot JVM Heap Layout For LDS of 512m : -Xmn768m -Xms2g -Xmx2g -Xmn768m -Xms2g –Xmx2g Native
- 48. GC Fundamentals Garbage Distribution – Objects die young • Typical object (Young object) is most likely to die shortly after it was created – Example: Local objects • Objects that have been around for a while (Old objects) will likely stay around for a while – Example: Objects initialized at the time of application startup • Only a few references from old objects to young objects exist Oracle confidential; Pending legal review
- 49. GC Fundamentals Garbage Distribution - Generational Collection • Buckets ideally correspond to distribution curve • Collect each bucket with most efficient algorithm • Size buckets for best GC performance Oracle confidential; Pending legal review
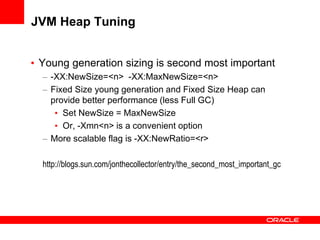
- 50. JVM Heap Tuning • Young generation sizing is second most important – -XX:NewSize=<n> -XX:MaxNewSize=<n> – Fixed Size young generation and Fixed Size Heap can provide better performance (less Full GC) • Set NewSize = MaxNewSize • Or, -Xmn<n> is a convenient option – More scalable flag is -XX:NewRatio=<r> http://blogs.sun.com/jonthecollector/entry/the_second_most_important_gc
- 51. Memory Leak • How do you know there is memory leak? • OOM (OutOfMemory) after a while (a few hours/a few days) • Memory used for long lived objects increases over time • Usually not a JVM problem, but a problem in application Long lived objects
- 52. JWorks GC Web (Beta) http://jworks.idv.tw/GcWeb/
- 53. Types of Object Reference • Strong references – Normal • SoftReference – Used for cache – GC’ed any time after there are no strong references to the referent, but is typically retained until memory is low. – Try to use -XX:SoftRefLRUPolicyMSPerMB=0 • WeakReference – Used for cache – GC’ed any time after there re no strong or soft references to the referent. • PhantomReference – Used for housekeeping (without using finalize, don’t use finalize)
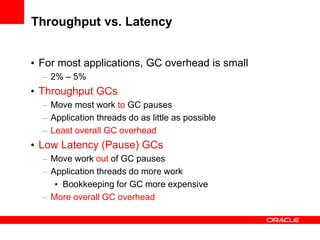
- 55. Throughput vs. Latency • For most applications, GC overhead is small – 2% – 5% • Throughput GCs – Move most work to GC pauses – Application threads do as little as possible – Least overall GC overhead • Low Latency (Pause) GCs – Move work out of GC pauses – Application threads do more work • Bookkeeping for GC more expensive – More overall GC overhead
- 56. Application Requirement • Different applications have different requirements – Higher Throughput: • Web application: pauses during garbage collection may be tolerable, or simply obscured by network latencies • Batch processing – Lower Latencies: • Interactive graphics application
- 57. HotSpot Garbage Collectors in Java SE 6 -XX:+UseParallelGC -XX:+UseSerialGC -XX:+UseParNewGC G1 -XX:+UseG1GC -XX:+UseConcMarkSweepGC -XX:+UseParallelOldGC http://blogs.sun.com/jonthecollector/entry/our_collectors
- 58. HotSpot Garbage Collectors in Java SE 6 -XX:+UseParallelGC -XX:+UseSerialGC -XX:+UseParNewGC G1 -XX:+UseG1GC -XX:+UseConcMarkSweepGC -XX:+UseParallelOldGC http://blogs.sun.com/jonthecollector/entry/our_collectors
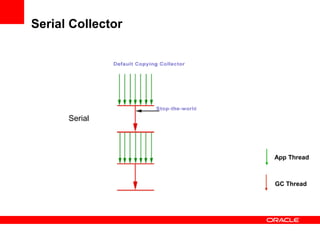
- 59. Selecting Garbage Collectors • Serial Collector (default for -client) (-XX:+UseSerialGC) – Works well in single processor configuration – Suitable for applications with small data sets – Co-locating multiple instances of WLS(JVM's)
- 60. Serial Collector Serial App Thread GC Thread
- 61. HotSpot Garbage Collectors in Java SE 6 -XX:+UseParallelGC -XX:+UseSerialGC -XX:+UseParNewGC G1 -XX:+UseG1GC -XX:+UseConcMarkSweepGC -XX:+UseParallelOldGC http://blogs.sun.com/jonthecollector/entry/our_collectors
- 62. Selecting Garbage Collectors • Parallel Scavenge Collector (Throughput, -XX:+UseParallelGC) – Perform minor collections in parallel to improve performance on multi-core and multi-threaded CPU's – Designed for applications with medium to large data sets – Control GC Threads using -XX:ParallelGCThreads=<n> • By default, <n> is set to total number of “CPU’s” – In JDK 5 Update 6, parallel compaction for old generation was added (-XX:+UseParallelOldGC) – Minimize garbage collection impact on throughput – Parallel compaction is now default in JDK 6 • -XX:+UseParallelOldGC
- 63. Serial vs Parallel Collector Serial App Thread GC Thread
- 64. HotSpot Garbage Collectors in Java SE 6 -XX:+UseParallelGC -XX:+UseSerialGC -XX:+UseParNewGC G1 -XX:+UseG1GC -XX:+UseConcMarkSweepGC -XX:+UseParallelOldGC http://blogs.sun.com/jonthecollector/entry/our_collectors
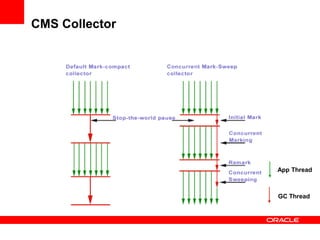
- 65. Selecting Garbage Collectors • Low Latencies (Pause) Collector (-XX:+UseConcMarkSweepGC) – Execute the application concurrently during Full GC – Constant response time on multi-CPU servers – To improve throughput, use the following for young gen • -XX:+UseParNewGC (and -XX:ParallelGCThreads=<n>)
- 66. CMS Collector App Thread GC Thread
- 67. CMS Collector with ParNewGC App Thread GC Thread
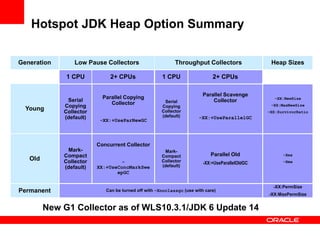
- 68. Hotspot JDK Heap Option Summary Generation Low Pause Collectors 1 CPU Young Serial Copying Collector (default) 2+ CPUs Parallel Copying Collector -XX:+UseParNewGC Throughput Collectors 1 CPU Serial Copying Collector (default) Heap Sizes 2+ CPUs Parallel Scavenge Collector -XX:NewSize -XX:MaxNewSize -XX:SurvivorRatio -XX:+UseParallelGC Concurrent Collector MarkCompact Collector (default) Old Permanent XX:+UseConcMarkSwe epGC MarkCompact Collector (default) Parallel Old -Xms -XX:+UseParallelOldGC -Xmx Can be turned off with –Xnoclassgc (use with care) New G1 Collector as of WLS10.3.1/JDK 6 Update 14 -XX:PermSize -XX:MaxPermSize
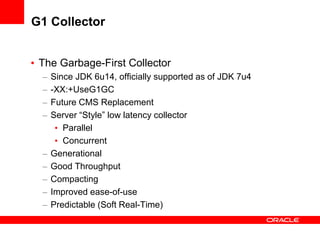
- 69. G1 Collector • The Garbage-First Collector – – – – – – – – – Since JDK 6u14, officially supported as of JDK 7u4 -XX:+UseG1GC Future CMS Replacement Server “Style” low latency collector • Parallel • Concurrent Generational Good Throughput Compacting Improved ease-of-use Predictable (Soft Real-Time)
- 70. G1 Collector • The Garbage-First Collector – – – – – – – – – Since JDK 6u14, officially supported as of JDK 7u4 -XX:+UseG1GC Future CMS Replacement Server “Style” low latency collector • Parallel • Concurrent Generational Good Throughput Compacting Improved ease-of-use Predictable (Soft Real-Time)
- 71. G1 Collector: Parallelism & Concurrency App Thread GC Thread
- 72. G1 – Garbage First Heap Layout Region Type S Eden S S Survivor Old Free
- 73. CMS vs G1 Collectors • Heap split into regions • Young generation (A set of regions) • Old generation (A set of regions)
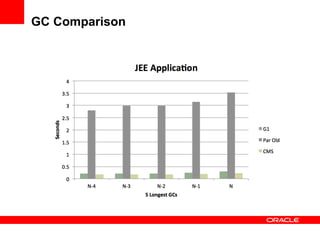
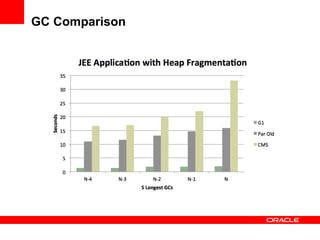
- 74. GC Comparison
- 75. GC Comparison
- 76. GC Comparison
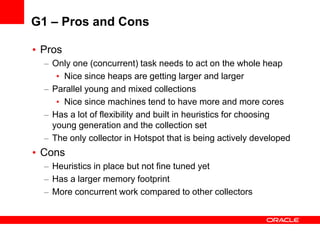
- 77. G1 – Pros and Cons • Pros – Only one (concurrent) task needs to act on the whole heap • Nice since heaps are getting larger and larger – Parallel young and mixed collections • Nice since machines tend to have more and more cores – Has a lot of flexibility and built in heuristics for choosing young generation and the collection set – The only collector in Hotspot that is being actively developed • Cons – Heuristics in place but not fine tuned yet – Has a larger memory footprint – More concurrent work compared to other collectors
- 78. G1 - Targeted Use Cases • Large heaps with limited GC latencies – Typically ~6GB or larger heaps • Applications that have – Varied object allocation rate – Undesired long GC or compaction pauses (greater than 0.5s) and want to lower down the pauses time • Tuning: – Garbage First Garbage Collector Tuning http://www.oracle.com/technetwork/articles/java/g1gc-1984535.html – Deep Dive into G1 Garbage Collector http://www.infoq.com/presentations/java-g1
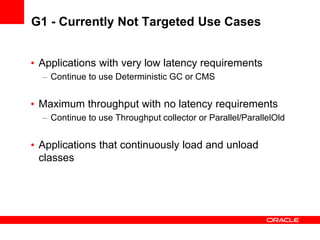
- 79. G1 - Currently Not Targeted Use Cases • Applications with very low latency requirements – Continue to use Deterministic GC or CMS • Maximum throughput with no latency requirements – Continue to use Throughput collector or Parallel/ParallelOld • Applications that continuously load and unload classes
- 80. References
- 81. • Step-by-Step: Garbage Collection Tuning in the Java HotSpot™ Virtual Machine – JavaOne 2010 • The Garbage Collection Mythbusters – JavaOne 2010 • GC Tuning for the HotSpot JVM – JavaOne 2009 • http://java.sun.com/javase/technologies/hotspot/gc/gc_tuning_6.html
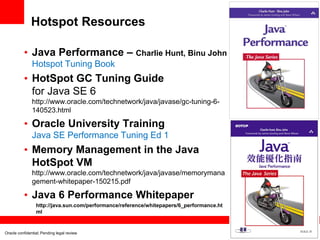
- 82. Hotspot Resources • Java Performance – Charlie Hunt, Binu John Hotspot Tuning Book • HotSpot GC Tuning Guide for Java SE 6 http://www.oracle.com/technetwork/java/javase/gc-tuning-6140523.html • Oracle University Training Java SE Performance Tuning Ed 1 • Memory Management in the Java HotSpot VM http://www.oracle.com/technetwork/java/javase/memorymana gement-whitepaper-150215.pdf • Java 6 Performance Whitepaper http://java.sun.com/performance/reference/whitepapers/6_performance.ht ml Oracle confidential; Pending legal review
- 84. Java SE Advanced New • Both HotSpot and JRockit VMs under a single license • JRockit VM brings to the table • Intuitive, user-friendly tooling for monitoring, diagnosing and tuning a Java environment. • Dynamic Memory Leak Detection • Enterprise JRE features i.e. ability to turn auto update off, and usage tracking. Java SE Advanced * Oracle’s JRE * JRockit JDKs * Java(JRockit) Mission Control * Monitoring and Management features (including APIs for EM integration)
- 85. Java (JRockit) Mission Control After JDK1.7.0_40 • Monitor health and performance in production • A suite of powerful tools for – Performance Tuning – Diagnostics – Support • Internal survey: 25% more efficient with JRMC 93
- 88. Java(JRockit) Mission Control Profiling - Detect Hot Methods 96
- 89. Oracle Java(JRockit) Flight Recorder
- 90. The Problem: The ”Intermittent Cycle” SLA Breach Server restart • [Sun 21:00] • [Sun 24:00] XXXX Analyze logs • [Mon 09:30] Turn on detailed logging • [Tue 13:00] Analyze logs • [Fri 09:00] Turn off detailed logging • [Fri 24:00] Analyze Logs and JFR • [Mon 09:30] 98
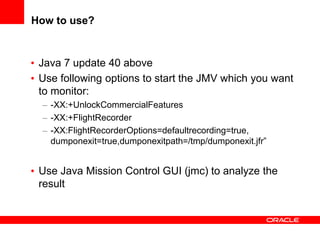
- 91. How to use? • Java 7 update 40 above • Use following options to start the JMV which you want to monitor: – -XX:+UnlockCommercialFeatures – -XX:+FlightRecorder – -XX:FlightRecorderOptions=defaultrecording=true, dumponexit=true,dumponexitpath=/tmp/dumponexit.jfr” • Use Java Mission Control GUI (jmc) to analyze the result
- 93. <Insert Picture Here> Thank you!