SlideShare a Scribd company logo
JQuery Flot
 by Arshavski Alexander
Charting libraries


A lot of choices -
http://my.opera.com/tagawa/blog/list-of-javascript-ch
JQuery Flot
Good list of
       features


http://socialcompare.com/en/comparison/javascript-g
Should work
  offline
Date-time axis
...
Flot works on:
Firefox 2.x+

Safari 3.0+

Opera 9.5+

Konqueror 4.x+

Internet Explorer 6+ (the excanvas
Javascript emulation helper is used for
IE < 9)
A lot of plugins
  and examples
Plugins -
http://code.google.com/p/flot/wiki/Plugins

Bubble charts -
https://github.com/ubermajestix/flot-plugins

Usage examples:
http://code.google.com/p/flot/wiki/FlotUsage
It’s not all pink and
         rosy

  Documentation sucks!
That’s why I’m here
What I want to do?
What I want to do?
What I want to do?
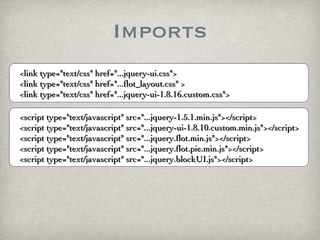
Imports
<link type="text/css" href="...jquery-ui.css">
<link type="text/css" href="...flot_layout.css" >
<link type="text/css" href="...jquery-ui-1.8.16.custom.css">

<script type="text/javascript" src="...jquery-1.5.1.min.js"></script>
<script type="text/javascript" src="...jquery-ui-1.8.10.custom.min.js"></script>
<script type="text/javascript" src="...jquery.flot.min.js"></script>
<script type="text/javascript" src="...jquery.flot.pie.min.js"></script>
<script type="text/javascript" src="...jquery.blockUI.js"></script>
Radio buttons

  <div id="radio">
     <input type="radio" id="connections_radio" name="radio"
checked="checked" /><label for="connections_radio">Connections</label>
     <input type="radio" id="usage_radio" name="radio" /><label
for="usage_radio">Usage</label>
     <input type="radio" id="export_radio" name="radio" /><label
for="export_radio">Export</label>
  </div>
Tabs
<div id="usage" style="display: none">
  <div id="usage_tabs">
      <ul>
          <li><a href="#day_statistics">Day</a></li>
          <li><a href="#week_statistics">Week</a></li>
          <li><a href="#month_statistics">Month</a></li>
          <li><a href="#year_statistics">Year</a></li>
      </ul>
      <div id="day_statistics">
          <div id="graphs_container1" class="graph_container”>
             <div id="graph1"></div>
             <div id="graph1_legend" class="graph_legend"></div>
          </div>
      </div>
      ...
      </div>
  ...
</div>
Radio buttons
$(function () {
   $("#connections_radio").click(function(event) {
      $("#connections").show();
      $("#usage").hide();
       $("#export").hide();
   });
   $("#usage_radio").click(function(event) {
      $("#connections").hide();
       $("#usage").show();
       $("#export").hide();
   });
   $("#export_radio").click(function(event) {
       $("#connections").hide();
       $("#usage").hide();
       $("#export").show();
   });
});
Tabs


$(function () {
   ...
   $("#connections_tabs").tabs();
   $("#usage_tabs").tabs();
   $("#usage_distribution_tabs").tabs();
});
Till now...
As a
  python
 guy it’s a
  lot of
 code for
    me
 already,
  so it’s
gonna be a
   mess
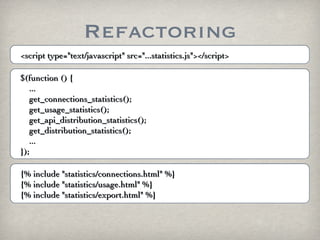
Refactoring
<script type="text/javascript" src="...statistics.js"></script>

$(function () {
   ...
   get_connections_statistics();
   get_usage_statistics();
   get_api_distribution_statistics();
   get_distribution_statistics();
   ...
});

{% include "statistics/connections.html" %}
{% include "statistics/usage.html" %}
{% include "statistics/export.html" %}
And now to the main
           part...
  var weekdayNames = "Sunday Monday Tuesday Wednesday Thursday Friday
Saturday".split(" ");
  var shortMonthNames = "Jan Feb Mar Apr May Jun Jul Aug Sep Oct Nov
Dec".split(" ");

  $.get('/manage/get_statistics_usage_data', {}, function(data){
    var stat_data = jQuery.parseJSON(data);

    //variables init
    var now = new Date().getTime() + stat_data.time_offset;
    var weekday = new Date(now).getDay();
    var month = new Date(now).getMonth();
    ...
And now to the main
         part...
//building weekly data
var api_calls_points = stat_data.api_calls_weekly;
var bandwidth_points = stat_data.bandwidth_weekly;
for(var i=0; i<api_calls_points.length; i++) {
    graph2_ticks.push([7-i, weekdayNames[(weekday+7-i)%7]]);
    api_calls_weekly.push([i, api_calls_points[i]]);
    bandwidth_weekly.push([i, bandwidth_points[i]]);
}
...
//building yearly data
var api_calls_points = stat_data.api_calls_yearly;
var bandwidth_points = stat_data.bandwidth_yearly;
for(var i=0; i<api_calls_points.length; i++) {
    graph4_ticks.push([12-i, shortMonthNames[(month+12-i)%12]]);
    api_calls_yearly.push([i, api_calls_points[i]]);
    bandwidth_yearly.push([i, bandwidth_points[i]]);
}
And now to the main
         part...
var options2 = {
   legend: {
      position: "ne",
      container: $("#graph2_legend")
   }, xaxis: {
      ticks: graph2_ticks
   }, yaxis: {
      min: 0,
      tickDecimals: 0 //only whole numbers
   }, grid: { hoverable: true }
};

    xaxis: { //in case of time axis
       mode: "time",
       timeformat: "%H:%M"
    },
And now to the main
         part...
var usage_plot2 = $.plot($("#graph2"), [
   {
      data: api_calls_weekly,
      label: "API calls",
      lines: { show: true }
   },
   {
      label: "Bandwidth (KB)",
      data: bandwidth_weekly,
      lines: { show: true }
   },
], options2);
Till now...
What if I want to
select a graph?
Graph Select
$('.legendColorBox').parent().click(function() {
  var plot = usage_plot1;
  var data = [api_calls_daily, bandwidth_daily];
  var graph = $(this).parent().parent().parent().attr("id").split("_")[0];
  if (graph == "graph2") {
      plot = usage_plot2;
      data = [api_calls_weekly, bandwidth_weekly];
  }
  ...
  if ($(this).children().text() == "API calls”) {
      plot.setData(get_plot_data([data[0], null, "lines", [], null, "lines"]));
  }
  if ($(this).children().text() == "Bandwidth (KB)") {
      plot.setData(get_plot_data([[], null, "lines", data[1], null, "lines"]));
  }
  plot.draw();
  ...
Graph Select
     var ticks = [graph2_ticks, graph3_ticks, graph4_ticks];
     if ($(this).siblings().text().search("Show all") == -1) {
        $('<tr/>', {
           style: 'cursor: auto;'
        }).bind('click', {plot: plot, data: data, ticks: ticks, now: now},
           show_all_usage_graphs)
        .append("<td class='legendColorBox'></td><td>Show all</td>").appendTo($
(this).parent());
        }
     });

function show_all_usage_graphs(e) {
    e.data.plot.setData(get_plot_data([e.data.data[0], null, "lines",
       e.data.data[1], null, "lines"]));
    e.data.plot.draw();
    $(this).remove();
  }
Till now...
What about
        tooltips?


I could take them from a lot of places. For
example: http://jquerytools.org/
I decided to do it
      myself
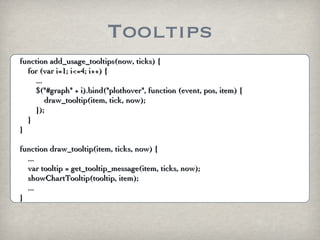
Tooltips
function add_usage_tooltips(now, ticks) {
  for (var i=1; i<=4; i++) {
     ...
     $("#graph" + i).bind("plothover", function (event, pos, item) {
         draw_tooltip(item, tick, now);
     });
  }
}

function draw_tooltip(item, ticks, now) {
  ...
  var tooltip = get_tooltip_message(item, ticks, now);
  showChartTooltip(tooltip, item);
  ...
}
Tooltips
function showChartTooltip(contents, item) {
  ...
  $("<div id='charttooltip'>" + contents + "</div>").css(
      {
         position: 'absolute',
         display: 'none',
         top: item.pageY + 5,
         left: item.pageX + 5,
         border: '1px solid #bfbfbf',
         padding: '2px',
         'background-color': item.series.color,
         opacity: 1
      }).appendTo("body").fadeIn(200);
  ...
}
Till now...
How can I make
                  bars?

$.plot($("#graph2"), [
   {
       data: api_calls_weekly,
       label: "Clients API hourly",
       bars: { show: true } //instead of: lines: { show: true }
   },
   ...
], options2);
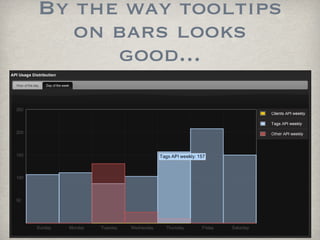
By the way tooltips
   on bars looks
      good...
For charts you
              should add:


<script type="text/javascript" src="...jquery.flot.pie.min.js"></script>
Charts
   var options = {
      series: {
        pie: {
           show: true,
           radius: 1,
           label: {
               show: true,
               radius: 3/4,
               formatter: function(label, series){
                 return '<div style="font-size:12pt;text-
align:center;padding:2px;color:black;">'+label+'<br/>'+Math.round(series.percent)+'%</
div>';              },                     background: { opacity: 0.5 }
           }
         }
      }
   };
   $.plot($("#countries_piechart"), data, options);
One last thing...


JQuery BlockUI Plugin:
http://jquery.malsup.com/block/
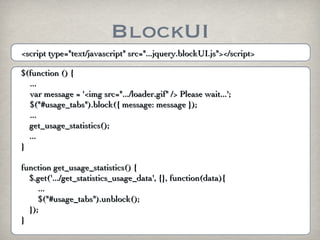
BlockUI
<script type="text/javascript" src="...jquery.blockUI.js"></script>

$(function () {
  ...
  var message = '<img src=".../loader.gif" /> Please wait...';
  $("#usage_tabs").block({ message: message });
  ...
  get_usage_statistics();
  ...
}

function get_usage_statistics() {
  $.get('.../get_statistics_usage_data', {}, function(data){
     ...
     $("#usage_tabs").unblock();
  });
}
BlockUI
Questions?


     alexarsh5@gmail.com

     http://twitter.com/alexarsh

     http://www.linkedin.com/pub

More Related Content

What's hot (20)

PDF
Using a mobile phone as a therapist - Superweek 2018
Peter Meyer
 
PDF
PhoneGap: Local Storage
Ivano Malavolta
 
PDF
Crowdsourcing with Django
Simon Willison
 
PPT
Supstat nyc subway
Vivian S. Zhang
 
PDF
画像Hacks
Yusuke Wada
 
PPT
An Elephant of a Different Colour: Hack
Vic Metcalfe
 
KEY
Advanced jQuery
sergioafp
 
PDF
HTML5 and CSS3 Refresher
Ivano Malavolta
 
ODP
ELK Stack - Turn boring logfiles into sexy dashboard
Georg Sorst
 
ODP
Javascript & jQuery: A pragmatic introduction
Iban Martinez
 
PDF
Drupal Mobile
Ruben Teijeiro
 
PDF
droidQuery: The Android port of jQuery
PhDBrown
 
PDF
MongoDB Aggregation Framework in action !
Sébastien Prunier
 
PDF
Node.js - Demnächst auf einem Server in Ihrer Nähe
Ralph Winzinger
 
TXT
Daily notes
meghendra168
 
PPTX
jQuery Data Manipulate API - A source code dissecting journey
Huiyi Yan
 
TXT
20160227 Granma
Sharon Liu
 
DOC
Php
Linh Tran
 
PPT
A Short Introduction To jQuery
Sudar Muthu
 
PPTX
SVCC 2013 D3.js Presentation (10/05/2013)
Oswald Campesato
 
Using a mobile phone as a therapist - Superweek 2018
Peter Meyer
 
PhoneGap: Local Storage
Ivano Malavolta
 
Crowdsourcing with Django
Simon Willison
 
Supstat nyc subway
Vivian S. Zhang
 
画像Hacks
Yusuke Wada
 
An Elephant of a Different Colour: Hack
Vic Metcalfe
 
Advanced jQuery
sergioafp
 
HTML5 and CSS3 Refresher
Ivano Malavolta
 
ELK Stack - Turn boring logfiles into sexy dashboard
Georg Sorst
 
Javascript & jQuery: A pragmatic introduction
Iban Martinez
 
Drupal Mobile
Ruben Teijeiro
 
droidQuery: The Android port of jQuery
PhDBrown
 
MongoDB Aggregation Framework in action !
Sébastien Prunier
 
Node.js - Demnächst auf einem Server in Ihrer Nähe
Ralph Winzinger
 
Daily notes
meghendra168
 
jQuery Data Manipulate API - A source code dissecting journey
Huiyi Yan
 
20160227 Granma
Sharon Liu
 
A Short Introduction To jQuery
Sudar Muthu
 
SVCC 2013 D3.js Presentation (10/05/2013)
Oswald Campesato
 

Similar to JQuery Flot (20)

PPTX
SPTechCon Dev Days - Third Party jQuery Libraries
Mark Rackley
 
PDF
HTML5 Graphing and Data Visualization Cookbook 1st Edition Ben Fhala
fuqrjow474
 
PDF
Visual Exploration of Large Data sets with D3, crossfilter and dc.js
Florian Georg
 
TXT
charts
pipalmetto
 
PDF
Html5 Graphing And Data Visualization Cookbook 1st Edition Ben Fhala
okkgaggas
 
PPTX
Spsmi13 charts
Derek Gusoff
 
PDF
Om nom nom nom
Anna Pawlicka
 
PPT
Sencha Touch Charts
saadulde
 
PPT
Making Pretty Charts in Splunk
Splunk
 
KEY
User Interface Development with jQuery
colinbdclark
 
PPTX
Shield UI JavaScript Chart
JStoikov
 
PPTX
PhDigital 2020: Web Development
Cindy Royal
 
PDF
Move your data (Hans Rosling style) with googleVis + 1 line of R code
Jeffrey Breen
 
PDF
2015 FOSS4G Track: Spatiotemporal Interface Development: Using Web Technologi...
GIS in the Rockies
 
PDF
Visualization of Big Data in Web Apps
EPAM
 
PDF
d4 and friendly charting DSL for D3
Mark Daggett
 
PDF
The world gets better with JavaScript
Angie Skazka
 
PDF
The world gets better with JavaScript
Angie Skazka
 
PDF
Learn D3.js in 90 minutes
Jos Dirksen
 
PPT
jQuery Loves You
DotNetMarche
 
SPTechCon Dev Days - Third Party jQuery Libraries
Mark Rackley
 
HTML5 Graphing and Data Visualization Cookbook 1st Edition Ben Fhala
fuqrjow474
 
Visual Exploration of Large Data sets with D3, crossfilter and dc.js
Florian Georg
 
charts
pipalmetto
 
Html5 Graphing And Data Visualization Cookbook 1st Edition Ben Fhala
okkgaggas
 
Spsmi13 charts
Derek Gusoff
 
Om nom nom nom
Anna Pawlicka
 
Sencha Touch Charts
saadulde
 
Making Pretty Charts in Splunk
Splunk
 
User Interface Development with jQuery
colinbdclark
 
Shield UI JavaScript Chart
JStoikov
 
PhDigital 2020: Web Development
Cindy Royal
 
Move your data (Hans Rosling style) with googleVis + 1 line of R code
Jeffrey Breen
 
2015 FOSS4G Track: Spatiotemporal Interface Development: Using Web Technologi...
GIS in the Rockies
 
Visualization of Big Data in Web Apps
EPAM
 
d4 and friendly charting DSL for D3
Mark Daggett
 
The world gets better with JavaScript
Angie Skazka
 
The world gets better with JavaScript
Angie Skazka
 
Learn D3.js in 90 minutes
Jos Dirksen
 
jQuery Loves You
DotNetMarche
 
Ad

Recently uploaded (20)

PDF
Bitcoin for Millennials podcast with Bram, Power Laws of Bitcoin
Stephen Perrenod
 
PDF
Using FME to Develop Self-Service CAD Applications for a Major UK Police Force
Safe Software
 
PPTX
AI Penetration Testing Essentials: A Cybersecurity Guide for 2025
defencerabbit Team
 
PDF
DevBcn - Building 10x Organizations Using Modern Productivity Metrics
Justin Reock
 
PDF
Exolore The Essential AI Tools in 2025.pdf
Srinivasan M
 
PDF
CIFDAQ Token Spotlight for 9th July 2025
CIFDAQ
 
PDF
Jak MŚP w Europie Środkowo-Wschodniej odnajdują się w świecie AI
dominikamizerska1
 
PDF
Presentation - Vibe Coding The Future of Tech
yanuarsinggih1
 
PDF
NewMind AI - Journal 100 Insights After The 100th Issue
NewMind AI
 
PPTX
COMPARISON OF RASTER ANALYSIS TOOLS OF QGIS AND ARCGIS
Sharanya Sarkar
 
PDF
Log-Based Anomaly Detection: Enhancing System Reliability with Machine Learning
Mohammed BEKKOUCHE
 
PPTX
"Autonomy of LLM Agents: Current State and Future Prospects", Oles` Petriv
Fwdays
 
PPTX
WooCommerce Workshop: Bring Your Laptop
Laura Hartwig
 
PDF
CIFDAQ Weekly Market Wrap for 11th July 2025
CIFDAQ
 
PDF
July Patch Tuesday
Ivanti
 
PDF
Complete JavaScript Notes: From Basics to Advanced Concepts.pdf
haydendavispro
 
PDF
"AI Transformation: Directions and Challenges", Pavlo Shaternik
Fwdays
 
PDF
Newgen Beyond Frankenstein_Build vs Buy_Digital_version.pdf
darshakparmar
 
PDF
Chris Elwell Woburn, MA - Passionate About IT Innovation
Chris Elwell Woburn, MA
 
PPTX
UiPath Academic Alliance Educator Panels: Session 2 - Business Analyst Content
DianaGray10
 
Bitcoin for Millennials podcast with Bram, Power Laws of Bitcoin
Stephen Perrenod
 
Using FME to Develop Self-Service CAD Applications for a Major UK Police Force
Safe Software
 
AI Penetration Testing Essentials: A Cybersecurity Guide for 2025
defencerabbit Team
 
DevBcn - Building 10x Organizations Using Modern Productivity Metrics
Justin Reock
 
Exolore The Essential AI Tools in 2025.pdf
Srinivasan M
 
CIFDAQ Token Spotlight for 9th July 2025
CIFDAQ
 
Jak MŚP w Europie Środkowo-Wschodniej odnajdują się w świecie AI
dominikamizerska1
 
Presentation - Vibe Coding The Future of Tech
yanuarsinggih1
 
NewMind AI - Journal 100 Insights After The 100th Issue
NewMind AI
 
COMPARISON OF RASTER ANALYSIS TOOLS OF QGIS AND ARCGIS
Sharanya Sarkar
 
Log-Based Anomaly Detection: Enhancing System Reliability with Machine Learning
Mohammed BEKKOUCHE
 
"Autonomy of LLM Agents: Current State and Future Prospects", Oles` Petriv
Fwdays
 
WooCommerce Workshop: Bring Your Laptop
Laura Hartwig
 
CIFDAQ Weekly Market Wrap for 11th July 2025
CIFDAQ
 
July Patch Tuesday
Ivanti
 
Complete JavaScript Notes: From Basics to Advanced Concepts.pdf
haydendavispro
 
"AI Transformation: Directions and Challenges", Pavlo Shaternik
Fwdays
 
Newgen Beyond Frankenstein_Build vs Buy_Digital_version.pdf
darshakparmar
 
Chris Elwell Woburn, MA - Passionate About IT Innovation
Chris Elwell Woburn, MA
 
UiPath Academic Alliance Educator Panels: Session 2 - Business Analyst Content
DianaGray10
 
Ad

JQuery Flot

  • 1. JQuery Flot by Arshavski Alexander
  • 2. Charting libraries A lot of choices - http://my.opera.com/tagawa/blog/list-of-javascript-ch
  • 4. Good list of features http://socialcompare.com/en/comparison/javascript-g
  • 5. Should work offline
  • 7. ...
  • 8. Flot works on: Firefox 2.x+ Safari 3.0+ Opera 9.5+ Konqueror 4.x+ Internet Explorer 6+ (the excanvas Javascript emulation helper is used for IE < 9)
  • 9. A lot of plugins and examples Plugins - http://code.google.com/p/flot/wiki/Plugins Bubble charts - https://github.com/ubermajestix/flot-plugins Usage examples: http://code.google.com/p/flot/wiki/FlotUsage
  • 10. It’s not all pink and rosy Documentation sucks!
  • 12. What I want to do?
  • 13. What I want to do?
  • 14. What I want to do?
  • 15. Imports <link type="text/css" href="...jquery-ui.css"> <link type="text/css" href="...flot_layout.css" > <link type="text/css" href="...jquery-ui-1.8.16.custom.css"> <script type="text/javascript" src="...jquery-1.5.1.min.js"></script> <script type="text/javascript" src="...jquery-ui-1.8.10.custom.min.js"></script> <script type="text/javascript" src="...jquery.flot.min.js"></script> <script type="text/javascript" src="...jquery.flot.pie.min.js"></script> <script type="text/javascript" src="...jquery.blockUI.js"></script>
  • 16. Radio buttons <div id="radio"> <input type="radio" id="connections_radio" name="radio" checked="checked" /><label for="connections_radio">Connections</label> <input type="radio" id="usage_radio" name="radio" /><label for="usage_radio">Usage</label> <input type="radio" id="export_radio" name="radio" /><label for="export_radio">Export</label> </div>
  • 17. Tabs <div id="usage" style="display: none"> <div id="usage_tabs"> <ul> <li><a href="#day_statistics">Day</a></li> <li><a href="#week_statistics">Week</a></li> <li><a href="#month_statistics">Month</a></li> <li><a href="#year_statistics">Year</a></li> </ul> <div id="day_statistics"> <div id="graphs_container1" class="graph_container”> <div id="graph1"></div> <div id="graph1_legend" class="graph_legend"></div> </div> </div> ... </div> ... </div>
  • 18. Radio buttons $(function () { $("#connections_radio").click(function(event) { $("#connections").show(); $("#usage").hide(); $("#export").hide(); }); $("#usage_radio").click(function(event) { $("#connections").hide(); $("#usage").show(); $("#export").hide(); }); $("#export_radio").click(function(event) { $("#connections").hide(); $("#usage").hide(); $("#export").show(); }); });
  • 19. Tabs $(function () { ... $("#connections_tabs").tabs(); $("#usage_tabs").tabs(); $("#usage_distribution_tabs").tabs(); });
  • 21. As a python guy it’s a lot of code for me already, so it’s gonna be a mess
  • 22. Refactoring <script type="text/javascript" src="...statistics.js"></script> $(function () { ... get_connections_statistics(); get_usage_statistics(); get_api_distribution_statistics(); get_distribution_statistics(); ... }); {% include "statistics/connections.html" %} {% include "statistics/usage.html" %} {% include "statistics/export.html" %}
  • 23. And now to the main part... var weekdayNames = "Sunday Monday Tuesday Wednesday Thursday Friday Saturday".split(" "); var shortMonthNames = "Jan Feb Mar Apr May Jun Jul Aug Sep Oct Nov Dec".split(" "); $.get('/manage/get_statistics_usage_data', {}, function(data){ var stat_data = jQuery.parseJSON(data); //variables init var now = new Date().getTime() + stat_data.time_offset; var weekday = new Date(now).getDay(); var month = new Date(now).getMonth(); ...
  • 24. And now to the main part... //building weekly data var api_calls_points = stat_data.api_calls_weekly; var bandwidth_points = stat_data.bandwidth_weekly; for(var i=0; i<api_calls_points.length; i++) { graph2_ticks.push([7-i, weekdayNames[(weekday+7-i)%7]]); api_calls_weekly.push([i, api_calls_points[i]]); bandwidth_weekly.push([i, bandwidth_points[i]]); } ... //building yearly data var api_calls_points = stat_data.api_calls_yearly; var bandwidth_points = stat_data.bandwidth_yearly; for(var i=0; i<api_calls_points.length; i++) { graph4_ticks.push([12-i, shortMonthNames[(month+12-i)%12]]); api_calls_yearly.push([i, api_calls_points[i]]); bandwidth_yearly.push([i, bandwidth_points[i]]); }
  • 25. And now to the main part... var options2 = { legend: { position: "ne", container: $("#graph2_legend") }, xaxis: { ticks: graph2_ticks }, yaxis: { min: 0, tickDecimals: 0 //only whole numbers }, grid: { hoverable: true } }; xaxis: { //in case of time axis mode: "time", timeformat: "%H:%M" },
  • 26. And now to the main part... var usage_plot2 = $.plot($("#graph2"), [ { data: api_calls_weekly, label: "API calls", lines: { show: true } }, { label: "Bandwidth (KB)", data: bandwidth_weekly, lines: { show: true } }, ], options2);
  • 28. What if I want to select a graph?
  • 29. Graph Select $('.legendColorBox').parent().click(function() { var plot = usage_plot1; var data = [api_calls_daily, bandwidth_daily]; var graph = $(this).parent().parent().parent().attr("id").split("_")[0]; if (graph == "graph2") { plot = usage_plot2; data = [api_calls_weekly, bandwidth_weekly]; } ... if ($(this).children().text() == "API calls”) { plot.setData(get_plot_data([data[0], null, "lines", [], null, "lines"])); } if ($(this).children().text() == "Bandwidth (KB)") { plot.setData(get_plot_data([[], null, "lines", data[1], null, "lines"])); } plot.draw(); ...
  • 30. Graph Select var ticks = [graph2_ticks, graph3_ticks, graph4_ticks]; if ($(this).siblings().text().search("Show all") == -1) { $('<tr/>', { style: 'cursor: auto;' }).bind('click', {plot: plot, data: data, ticks: ticks, now: now}, show_all_usage_graphs) .append("<td class='legendColorBox'></td><td>Show all</td>").appendTo($ (this).parent()); } }); function show_all_usage_graphs(e) { e.data.plot.setData(get_plot_data([e.data.data[0], null, "lines", e.data.data[1], null, "lines"])); e.data.plot.draw(); $(this).remove(); }
  • 32. What about tooltips? I could take them from a lot of places. For example: http://jquerytools.org/
  • 33. I decided to do it myself
  • 34. Tooltips function add_usage_tooltips(now, ticks) { for (var i=1; i<=4; i++) { ... $("#graph" + i).bind("plothover", function (event, pos, item) { draw_tooltip(item, tick, now); }); } } function draw_tooltip(item, ticks, now) { ... var tooltip = get_tooltip_message(item, ticks, now); showChartTooltip(tooltip, item); ... }
  • 35. Tooltips function showChartTooltip(contents, item) { ... $("<div id='charttooltip'>" + contents + "</div>").css( { position: 'absolute', display: 'none', top: item.pageY + 5, left: item.pageX + 5, border: '1px solid #bfbfbf', padding: '2px', 'background-color': item.series.color, opacity: 1 }).appendTo("body").fadeIn(200); ... }
  • 37. How can I make bars? $.plot($("#graph2"), [ { data: api_calls_weekly, label: "Clients API hourly", bars: { show: true } //instead of: lines: { show: true } }, ... ], options2);
  • 38. By the way tooltips on bars looks good...
  • 39. For charts you should add: <script type="text/javascript" src="...jquery.flot.pie.min.js"></script>
  • 40. Charts var options = { series: { pie: { show: true, radius: 1, label: { show: true, radius: 3/4, formatter: function(label, series){ return '<div style="font-size:12pt;text- align:center;padding:2px;color:black;">'+label+'<br/>'+Math.round(series.percent)+'%</ div>'; }, background: { opacity: 0.5 } } } } }; $.plot($("#countries_piechart"), data, options);
  • 41. One last thing... JQuery BlockUI Plugin: http://jquery.malsup.com/block/
  • 42. BlockUI <script type="text/javascript" src="...jquery.blockUI.js"></script> $(function () { ... var message = '<img src=".../loader.gif" /> Please wait...'; $("#usage_tabs").block({ message: message }); ... get_usage_statistics(); ... } function get_usage_statistics() { $.get('.../get_statistics_usage_data', {}, function(data){ ... $("#usage_tabs").unblock(); }); }
  • 44. Questions? [email protected] http://twitter.com/alexarsh http://www.linkedin.com/pub