SlideShare a Scribd company logo
Kernel Entropy Component Analysis
      in Remote Sensing Data Clustering

Luis Gómez-Chova1          Robert Jenssen2    Gustavo Camps-Valls1

 1 Image  Processing Laboratory (IPL), Universitat de València, Spain.
     luis.gomez-chova@uv.es , http://www.valencia.edu/chovago
2 Department of Physics and Technology, University of Tromsø, Norway.
       robert.jenssen@uit.no , http://www.phys.uit.no/∼robertj


                   IGARSS 2011 – Vancouver, Canada

                  *
       IPL


    Image Processing Laboratory
Intro            ECA           KECA              Clustering       Results            Conclusions

Outline


        1   Introduction


        2   Entropy Component Analysis


        3   Kernel Entropy Component Analysis (KECA)


        4   KECA Spectral Clustering


        5   Experimental Results


        6   Conclusions and Open questions


L. Gómez-Chova et al.       Kernel Entropy Component Analysis   IGARSS 2011 – Vancouver    1/26
Intro            ECA            KECA              Clustering       Results            Conclusions

Motivation

        Feature Extraction
             Feature selection/extraction essential before classification or regression
                  to discard redundant or noisy components
                  to reduce the dimensionality of the data
             Create a subset of new features by combinations of the existing ones

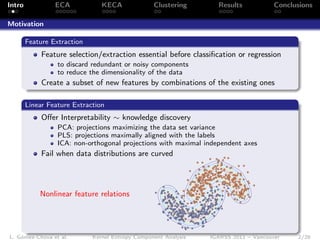
        Linear Feature Extraction
             Offer Interpretability ∼ knowledge discovery
                  PCA: projections maximizing the data set variance
                  PLS: projections maximally aligned with the labels
                  ICA: non-orthogonal projections with maximal independent axes
             Fail when data distributions are curved


            Nonlinear feature relations


L. Gómez-Chova et al.        Kernel Entropy Component Analysis   IGARSS 2011 – Vancouver    2/26
Intro            ECA               KECA              Clustering             Results           Conclusions

Objectives


        Objectives
             Kernel-based non-linear data-transformation
                     Captures the data higher order statistics
                     Extracts features suited for clustering


        Method
             Kernel Entropy Component Analysis (KECA)               [Jenssen, 2010]

             Based on Information Theory:
                     Maximally preserves entropy of the input data
                     Angular clustering maximizes cluster divergence
             Out-of-sample extension to deal with test data

        Experiments
             Cloud screening from ENVISAT/MERIS multispectral images


L. Gómez-Chova et al.           Kernel Entropy Component Analysis        IGARSS 2011 – Vancouver    3/26
Intro            ECA           KECA              Clustering       Results            Conclusions


        1   Introduction


        2   Entropy Component Analysis


        3   Kernel Entropy Component Analysis (KECA)


        4   KECA Spectral Clustering


        5   Experimental Results


        6   Conclusions and Open questions


L. Gómez-Chova et al.       Kernel Entropy Component Analysis   IGARSS 2011 – Vancouver    4/26
Intro           ECA           KECA              Clustering       Results            Conclusions

Information-Theoretic Learning


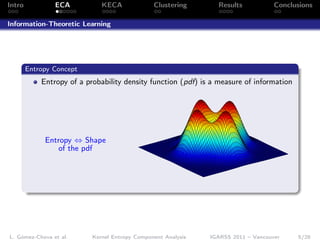
        Entropy Concept
            Entropy of a probability density function (pdf) is a measure of information


             Entropy ⇔ Shape
                 of the pdf


L. Gómez-Chova et al.      Kernel Entropy Component Analysis   IGARSS 2011 – Vancouver    5/26
Intro           ECA             KECA              Clustering       Results            Conclusions

Information-Theoretic Learning


        Divergence Concept
            The entropy concept can be extended to obtain a measure of dissimilarity
            between distributions

                                                                 ←→


            Divergence ⇔ Distance
                 between pdfs


L. Gómez-Chova et al.        Kernel Entropy Component Analysis   IGARSS 2011 – Vancouver    6/26
Intro            ECA            KECA                   Clustering            Results           Conclusions

Entropy Component Analysis


        Shannon entropy
                                                   Z
                                     H(p) = −           p(x) log p(x)dx
            How to handle densities?                                How to compute integrals?

        Rényi’s entropies
                                                             Z
                                                1
                                    H(p) = −       log           p α (x)dx
                                               1−α

             Rényi’s entropies contain Shannon as a special case α → 1
             We focus on the Rényi’s quadratic entropy α = 2

        Rényi’s quadratic entropy
                                               Z
                             H(p) = − log          p 2 (x)dx = − log V (p)


             It can be estimated directly from samples!

L. Gómez-Chova et al.        Kernel Entropy Component Analysis            IGARSS 2011 – Vancouver    7/26
Intro            ECA               KECA              Clustering          Results              Conclusions

Entropy Component Analysis


        Rényi’s quadratic entropy estimator

             Estimated from data D = {x1 , . . . , xN } ∈ Rd generated by the pdf p(x)
             Parzen window estimator with a Gaussian or Radial Basis Function (RBF):
                        1 X                                                              2
                               K (x, xt | σ)                                                 /2σ 2
                                                                             `                       ´
              p (x) =
              ˆ                                    with      K (x, xt ) = exp − x − xt
                        N x ∈D
                            t


             Idea: Place a kernel over the samples and sum with proper normalization
             The estimator for the information potential V (p) = p 2 (x)dx
                                                                      R

                            Z              Z
                                             1 X                    1 X
                ˆ
               V (p) =         p 2 (x)dx =
                               ˆ                      K (x, xt | σ)        K (x, xt | σ)dx
                                             N x ∈D                 N x ∈D
                                                t                      t
                                           Z
                             1 X X
                       =                     K (x, xt | σ)K (x, xt | σ)dx
                            N 2 x ∈D x ∈D
                                     t    t

                                 1 X X                  √      1
                        =         2
                                            K (xt , xt | 2σ) = 2 1 K1
                                N x ∈D x ∈D                   N
                                     t    t


L. Gómez-Chova et al.           Kernel Entropy Component Analysis      IGARSS 2011 – Vancouver           8/26
Intro            ECA            KECA              Clustering        Results             Conclusions

Entropy Component Analysis

        Rényi’s quadratic entropy estimator
             Empirical Rényi entropy estimate resides in the corresponding kernel matrix

                                              ˆ       1
                                              V (p) = 2 1 K1
                                                     N
             It can be expressed in terms of eigenvalues and eigenvectors of K

                                 D diagonal matrix of eigenvalues λ1 , . . . , λN
                              
                  K = EDE
                                 E matrix with the eigenvectors       e1 , . . . , eN

             Therefore we then have
                                                 N
                                               1 X “p        ”2
                                       ˆ
                                       V (p) = 2     λi ei 1
                                              N
                                                     i =1
                            √
             where each term λi ei 1 will contribute to the entropy estimate

        ECA dimensionality reduction
             Idea: to find the smallest set of features √ maximally preserve the
                                                       that
             entropy of the input data (contributions λi ei 1)
L. Gómez-Chova et al.        Kernel Entropy Component Analysis   IGARSS 2011 – Vancouver      9/26
Intro           ECA          KECA              Clustering         Results            Conclusions

Entropy Component Analysis


            H(p) = 4.36                    H(p) = 4.74                   H(p) = 5.05


                        H(p) = 4.71                                ˆ
                                                     H(p) = 4.81 , H(p) = 4.44


L. Gómez-Chova et al.     Kernel Entropy Component Analysis     IGARSS 2011 – Vancouver    10/26
Intro            ECA           KECA              Clustering       Results            Conclusions


        1   Introduction


        2   Entropy Component Analysis


        3   Kernel Entropy Component Analysis (KECA)


        4   KECA Spectral Clustering


        5   Experimental Results


        6   Conclusions and Open questions


L. Gómez-Chova et al.       Kernel Entropy Component Analysis   IGARSS 2011 – Vancouver    11/26
Intro           ECA             KECA              Clustering          Results           Conclusions

Kernel Principal Component Analysis (KPCA)

        Principal Component Analysis (PCA)

            Find projections of X = [x1 , . . . , xN ]   maximizing the variance of data XU

                  PCA:         maximize:      Trace{(XU) (XU)} = Trace{U Cxx U}
                               subject to:    U U=I
            Including Lagrange multipliers λ, this is equivalent to the eigenproblem
                                       Cxx ui = λi ui → Cxx U = UD

            ui are the eigenvectors of Cxx and they are orthonormal, ui uj = 0


                                        PCA


L. Gómez-Chova et al.        Kernel Entropy Component Analysis     IGARSS 2011 – Vancouver    12/26
Intro           ECA            KECA              Clustering       Results            Conclusions

Kernel Principal Component Analysis (KPCA)


        Kernel Principal Component Analysis (KPCA)

            Find projections maximizing variance of mapped data [φ(x1 ), . . . , φ(xN )]

                   KPCA:         maximize:       Tr{(ΦU) (ΦU)} = Tr{U Φ ΦU}
                                 subject to:     U U=I

            The covariance matrix Φ Φ and projection matrix U are dH × dH !!!

        KPCA through kernel trick

            Apply the representer’s theorem: U = Φ A where A = [α1 , . . . , αN ]

                   KPCA:        maximize:       Tr{A ΦΦ ΦΦ A} = Tr{A KKA}
                                subject to:     U U = A ΦΦ A = A KA = I

            Including Lagrange multipliers λ, this is equivalent to the eigenproblem

                                    KKαi = λi Kαi → Kαi = λi αi

            Now matrix A is N × N !!! (eigendecomposition of K = EDE = AA )

L. Gómez-Chova et al.       Kernel Entropy Component Analysis   IGARSS 2011 – Vancouver    13/26
Intro            ECA              KECA           Clustering            Results            Conclusions

Kernel ECA Transformation


        Kernel Entropy Component Analysis (KECA)
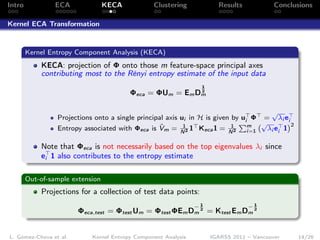
            KECA: projection of Φ onto those m feature-space principal axes
            contributing most to the Rényi entropy estimate of the input data
                                                                 1
                                                          2
                                         Φeca = ΦUm = Em Dm

                                                                                      √
                 Projections onto a single principal axis ui in H is given by ui Φ = λi ei
                                                           1               1 Pm `√          ´2
                                                   ˆ
                 Entropy associated with Φeca is Vm = N 2 1 Keca 1 = N 2             λi ei 1
                                                                                i =1


            Note that Φeca is not necessarily based on the top eigenvalues λi since
            ei 1 also contributes to the entropy estimate

        Out-of-sample extension
            Projections for a collection of test data points:
                                                                −1               −1
                        Φeca,test = Φtest Um = Φtest ΦEm Dm 2 = Ktest Em Dm 2


L. Gómez-Chova et al.       Kernel Entropy Component Analysis        IGARSS 2011 – Vancouver     14/26
Intro           ECA          KECA              Clustering       Results            Conclusions

Kernel ECA Transformation


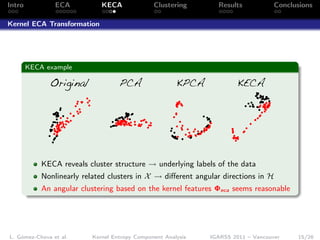
        KECA example

              Original             PCA                 KPCA           KECA


            KECA reveals cluster structure → underlying labels of the data
            Nonlinearly related clusters in X → different angular directions in H
            An angular clustering based on the kernel features Φeca seems reasonable


L. Gómez-Chova et al.     Kernel Entropy Component Analysis   IGARSS 2011 – Vancouver    15/26
Intro            ECA           KECA              Clustering       Results            Conclusions


        1   Introduction


        2   Entropy Component Analysis


        3   Kernel Entropy Component Analysis (KECA)


        4   KECA Spectral Clustering


        5   Experimental Results


        6   Conclusions and Open questions


L. Gómez-Chova et al.       Kernel Entropy Component Analysis   IGARSS 2011 – Vancouver    16/26
Intro           ECA            KECA              Clustering        Results            Conclusions

KECA Spectral Clustering

        Cauchy-Schwarz divergence
            The Cauchy-Schwarz divergence between the pdf of two clusters is
                                                                  R
                                                                    pi (x)pj (x)d x
                DCS (pi , pj ) = − log(VCS (pi , pj )) = − log qR           R
                                                                  pi (x)d x pj2 (x)d x
                                                                    2


            Measuring dissimilarity in a probability space is a complex issue
                                                                              1
                                                                                  φ(xt ):
                                                                                P
            Entropy interpretation in the kernel space → mean vector µ = N
                         Z
                                          1            1
                 V (p) = p 2 (x)dx = 2 1 K1 = 2 1 ΦΦ 1 = µ µ = µ 2
                 ˆ          ˆ
                                         N            N
                                                                µi µj
            Diverg. via Parzen windowing ⇒ VCS (pi , pj ) =
                                           ˆ
                                                                µi µj
                                                                         = cos ∠(µi , µj )


        KECA Spectral Clustering
            Angular clustering of Φeca maximizes the CS divergence between clusters:
                                                   k
                                                   X
                             J(C1 , . . . , Ck ) =   Ni cos ∠(φeca (x), µi )
                                                  i =1
L. Gómez-Chova et al.       Kernel Entropy Component Analysis    IGARSS 2011 – Vancouver     17/26
Intro               ECA         KECA              Clustering       Results            Conclusions

KECA Spectral Clustering


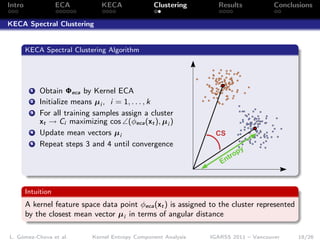
        KECA Spectral Clustering Algorithm


         1   Obtain Φeca by Kernel ECA
         2   Initialize means µi , i = 1, . . . , k
         3   For all training samples assign a cluster
             xt → Ci maximizing cos ∠(φeca (xt ), µi )
         4   Update mean vectors µi                               CS
         5   Repeat steps 3 and 4 until convergence
                                                                          py
                                                                       tro
                                                                    En


        Intuition
        A kernel feature space data point φeca (xt ) is assigned to the cluster represented
        by the closest mean vector µi in terms of angular distance

L. Gómez-Chova et al.        Kernel Entropy Component Analysis   IGARSS 2011 – Vancouver      18/26
Intro            ECA           KECA              Clustering       Results            Conclusions


        1   Introduction


        2   Entropy Component Analysis


        3   Kernel Entropy Component Analysis (KECA)


        4   KECA Spectral Clustering


        5   Experimental Results


        6   Conclusions and Open questions


L. Gómez-Chova et al.       Kernel Entropy Component Analysis   IGARSS 2011 – Vancouver    19/26
Intro            ECA           KECA              Clustering       Results            Conclusions

Experimental results: Data material


        Cloud masking from ENVISAT/MERIS multispectral images
            Pixel-wise binary decisions about the presence/absence of clouds
            MERIS images taken over Spain and France
            Input samples with 13 spectral bands and 6 physically inspired features


           Barrax (BR-2003-07-14)      Barrax (BR-2004-07-14)     France (FR-2005-03-19)


L. Gómez-Chova et al.       Kernel Entropy Component Analysis   IGARSS 2011 – Vancouver    20/26
Intro                                           ECA                    KECA                                         Clustering                                               Results                      Conclusions

Experimental results: Numerical comparison

        Experimental setup
                                        KECA compared with k-means, KPCA + k-means, and Kernel k-means
                                        Number of clusters fixed to k = 2 (cloud-free and cloudy areas)
                                        Number of KPCA and KECA features fixed to m = 2 (stress differences)
                                        RBF-kernel width parameter is selected by gird-search for all methods

        Numerical results
                                        Validation results on 10000 pixels per image manually labeled
                                        Kappa statistic results over 10 realizations for all images
                                                 BR-2003-07-14                                                    BR-2004-07-14                                                     FR-2005-03-19
                                   1                                                                  0.8                                                              0.6


                                                                                                                                                                       0.5
                                  0.9
                                                                                                      0.7


                                                                                                                                               Estimated κ statistic
          Estimated κ statistic


                                                                              Estimated κ statistic


                                                                                                                                                                       0.4
                                  0.8
                                                                                                      0.6                                                              0.3
                                                                                                                                                                                            KECA
                                  0.7                                                                                                                                                       KPCA
                                                                                                                                                                       0.2                  Kernel k-means
                                                                                                      0.5                                                                                   k-means
                                  0.6
                                                                                                                                                                       0.1


                                  0.5                                                                 0.4                                                               0
                                          200    400    600      800   1000                                 200   400    600      800   1000                                  200   400    600      800      1000
                                                   #Samples                                                         #Samples                                                          #Samples


L. Gómez-Chova et al.                                              Kernel Entropy Component Analysis                                                         IGARSS 2011 – Vancouver                                21/26
Intro            ECA                            KECA                Clustering                Results            Conclusions

Experimental results: Numerical comparison


        Average numerical results
                                                      0.8


                                                      0.7
                              Estimated κ statistic

                                                                                                        KECA
                                                      0.6                                               KPCA
                                                                                                        Kernel k-means
                                                                                                        k-means
                                                      0.5


                                                      0.4
                                                            200   400    600     800   1000
                                                                    #Samples


             KECA outperforms k-means (+25%) and Kk-means and KPCA (+15%)
             In general, the number of training samples positively affect the results


L. Gómez-Chova et al.        Kernel Entropy Component Analysis                          IGARSS 2011 – Vancouver          22/26
Intro              ECA                  KECA                  Clustering                 Results                Conclusions

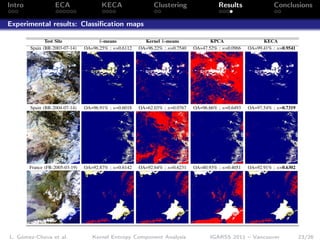
Experimental results: Classification maps

               Test Site               k-means            Kernel k-means              KPCA                  KECA
        Spain (BR-2003-07-14)    OA=96.25% ; κ=0.6112   OA=96.22% ; κ=0.7540   OA=47.52% ; κ=0.0966   OA=99.41% ; κ=0.9541


        Spain (BR-2004-07-14)    OA=96.91% ; κ=0.6018   OA=62.03% ; κ=0.0767   OA=96.66% ; κ=0.6493   OA=97.54% ; κ=0.7319


        France (FR-2005-03-19)   OA=92.87% ; κ=0.6142   OA=92.64% ; κ=0.6231   OA=80.93% ; κ=0.4051   OA=92.91% ; κ=0.6302


L. Gómez-Chova et al.               Kernel Entropy Component Analysis                 IGARSS 2011 – Vancouver                23/26
Intro            ECA           KECA              Clustering       Results            Conclusions


        1   Introduction


        2   Entropy Component Analysis


        3   Kernel Entropy Component Analysis (KECA)


        4   KECA Spectral Clustering


        5   Experimental Results


        6   Conclusions and Open questions


L. Gómez-Chova et al.       Kernel Entropy Component Analysis   IGARSS 2011 – Vancouver    24/26
Intro            ECA           KECA              Clustering          Results            Conclusions

Conclusions and open questions


        Conclusions
            Kernel entropy component analysis for clustering remote sensing data
                 Nonlinear features preserving entropy of the input data
                 Angular clustering reveals structure in terms of clusters divergence
            Out-of-sample extension for test data → mandatory in remote sensing
            Good results on cloud screening from MERIS images
            KECA code is available at http://www.phys.uit.no/∼robertj/
            Simple feature extraction toolbox (SIMFEAT) soon at http://isp.uv.es

        Open questions and Future work
            Pre-images of transformed data in the input space
            Learn kernel parameters in an automatic way
            Test KECA in more remote sensing applications


L. Gómez-Chova et al.       Kernel Entropy Component Analysis      IGARSS 2011 – Vancouver    25/26
Intro           ECA              KECA              Clustering           Results           Conclusions


                        Kernel Entropy Component Analysis
                        in Remote Sensing Data Clustering

             Luis Gómez-Chova1            Robert Jenssen2         Gustavo Camps-Valls1

                1 Image  Processing Laboratory (IPL), Universitat de València, Spain.
                    luis.gomez-chova@uv.es , http://www.valencia.edu/chovago
             2 Department     of Physics and Technology, University of Tromsø, Norway.
                        robert.jenssen@uit.no , http://www.phys.uit.no/∼robertj


                                  IGARSS 2011 – Vancouver, Canada

                                 *
                        IPL


                  Image Processing Laboratory

L. Gómez-Chova et al.         Kernel Entropy Component Analysis      IGARSS 2011 – Vancouver    26/26
More Related Content

What's hot (20)

PDF
Nonlinear Stochastic Optimization by the Monte-Carlo Method
SSA KPI
 
PDF
Bertail
eric_gautier
 
PDF
CVPR2010: Advanced ITinCVPR in a Nutshell: part 5: Shape, Matching and Diverg...
zukun
 
PDF
Visualizing, Modeling and Forecasting of Functional Time Series
hanshang
 
PDF
Do we need a logic of quantum computation?
Matthew Leifer
 
PDF
Stochastic Differentiation
SSA KPI
 
PDF
Random Matrix Theory in Array Signal Processing: Application Examples
Förderverein Technische Fakultät
 
PDF
6. balance laws jan 2013
Olowosulu Emmanuel
 
PDF
3. tensor calculus jan 2013
Olowosulu Emmanuel
 
PDF
CSMR11b.ppt
Ptidej Team
 
PDF
Two dimensional Pool Boiling
RobvanGils
 
PDF
Introduction to FDA and linear models
tuxette
 
PDF
Lesson 22: Optimization (Section 041 slides)
Matthew Leingang
 
PDF
Oriented Tensor Reconstruction. Tracing Neural Pathways from DT-MRI
Leonid Zhukov
 
PDF
Application of the Monte-Carlo Method to Nonlinear Stochastic Optimization wi...
SSA KPI
 
PPTX
Spectral clustering Tutorial
Zitao Liu
 
PDF
Ml mle_bayes
Phong Vo
 
PDF
Exponentialentropyonintuitionisticfuzzysets (1)
Dr. Hari Arora
 
PDF
11.final paper -0047www.iiste.org call-for_paper-58
Alexander Decker
 
PDF
Intro probability 4
Phong Vo
 
Nonlinear Stochastic Optimization by the Monte-Carlo Method
SSA KPI
 
Bertail
eric_gautier
 
CVPR2010: Advanced ITinCVPR in a Nutshell: part 5: Shape, Matching and Diverg...
zukun
 
Visualizing, Modeling and Forecasting of Functional Time Series
hanshang
 
Do we need a logic of quantum computation?
Matthew Leifer
 
Stochastic Differentiation
SSA KPI
 
Random Matrix Theory in Array Signal Processing: Application Examples
Förderverein Technische Fakultät
 
6. balance laws jan 2013
Olowosulu Emmanuel
 
3. tensor calculus jan 2013
Olowosulu Emmanuel
 
CSMR11b.ppt
Ptidej Team
 
Two dimensional Pool Boiling
RobvanGils
 
Introduction to FDA and linear models
tuxette
 
Lesson 22: Optimization (Section 041 slides)
Matthew Leingang
 
Oriented Tensor Reconstruction. Tracing Neural Pathways from DT-MRI
Leonid Zhukov
 
Application of the Monte-Carlo Method to Nonlinear Stochastic Optimization wi...
SSA KPI
 
Spectral clustering Tutorial
Zitao Liu
 
Ml mle_bayes
Phong Vo
 
Exponentialentropyonintuitionisticfuzzysets (1)
Dr. Hari Arora
 
11.final paper -0047www.iiste.org call-for_paper-58
Alexander Decker
 
Intro probability 4
Phong Vo
 

Viewers also liked (20)

PDF
fauvel_igarss.pdf
grssieee
 
PDF
Nonlinear component analysis as a kernel eigenvalue problem
Michele Filannino
 
PDF
Principal component analysis and matrix factorizations for learning (part 2) ...
zukun
 
PPTX
Different kind of distance and Statistical Distance
Khulna University
 
PDF
KPCA_Survey_Report
Randy Salm
 
PPTX
Principal Component Analysis For Novelty Detection
Jordan McBain
 
PDF
Analyzing Kernel Security and Approaches for Improving it
Milan Rajpara
 
PDF
Adaptive anomaly detection with kernel eigenspace splitting and merging
ieeepondy
 
PDF
Modeling and forecasting age-specific mortality: Lee-Carter method vs. Functi...
hanshang
 
PDF
Explicit Signal to Noise Ratio in Reproducing Kernel Hilbert Spaces.pdf
grssieee
 
PPTX
A Comparative Study between ICA (Independent Component Analysis) and PCA (Pri...
Sahidul Islam
 
PDF
Regularized Principal Component Analysis for Spatial Data
Wen-Ting Wang
 
PPT
Pca and kpca of ecg signal
es712
 
PDF
DataEngConf: Feature Extraction: Modern Questions and Challenges at Google
Hakka Labs
 
PDF
Probabilistic PCA, EM, and more
hsharmasshare
 
PDF
Principal component analysis and matrix factorizations for learning (part 1) ...
zukun
 
PDF
Principal Component Analysis and Clustering
Usha Vijay
 
PPTX
ECG: Indication and Interpretation
Rakesh Verma
 
PDF
Introduction to Statistical Machine Learning
mahutte
 
PPTX
Principal component analysis
Farah M. Altufaili
 
fauvel_igarss.pdf
grssieee
 
Nonlinear component analysis as a kernel eigenvalue problem
Michele Filannino
 
Principal component analysis and matrix factorizations for learning (part 2) ...
zukun
 
Different kind of distance and Statistical Distance
Khulna University
 
KPCA_Survey_Report
Randy Salm
 
Principal Component Analysis For Novelty Detection
Jordan McBain
 
Analyzing Kernel Security and Approaches for Improving it
Milan Rajpara
 
Adaptive anomaly detection with kernel eigenspace splitting and merging
ieeepondy
 
Modeling and forecasting age-specific mortality: Lee-Carter method vs. Functi...
hanshang
 
Explicit Signal to Noise Ratio in Reproducing Kernel Hilbert Spaces.pdf
grssieee
 
A Comparative Study between ICA (Independent Component Analysis) and PCA (Pri...
Sahidul Islam
 
Regularized Principal Component Analysis for Spatial Data
Wen-Ting Wang
 
Pca and kpca of ecg signal
es712
 
DataEngConf: Feature Extraction: Modern Questions and Challenges at Google
Hakka Labs
 
Probabilistic PCA, EM, and more
hsharmasshare
 
Principal component analysis and matrix factorizations for learning (part 1) ...
zukun
 
Principal Component Analysis and Clustering
Usha Vijay
 
ECG: Indication and Interpretation
Rakesh Verma
 
Introduction to Statistical Machine Learning
mahutte
 
Principal component analysis
Farah M. Altufaili
 
Ad

Similar to Kernel Entropy Component Analysis in Remote Sensing Data Clustering.pdf (20)

PDF
Astaño 4
Cire Oreja
 
PDF
11.performance evaluation of geometric active contour (gac) and enhanced geom...
Alexander Decker
 
PDF
Performance evaluation of geometric active contour (gac) and enhanced geometr...
Alexander Decker
 
PDF
Hideitsu Hino
Suurist
 
PDF
icml2004 tutorial on spectral clustering part II
zukun
 
PDF
CVPR2010: Advanced ITinCVPR in a Nutshell: part 2: Interest Points
zukun
 
PDF
Clustering using kernel entropy principal component analysis and variable ker...
IJECEIAES
 
PDF
Renyis entropy
wtyru1989
 
PDF
Foundation of KL Divergence
Natan Katz
 
PDF
Computing f-Divergences and Distances of\\ High-Dimensional Probability Densi...
Alexander Litvinenko
 
PDF
01fourier
satheeshraja10
 
PDF
WE4.L09 - MEAN-SHIFT AND HIERARCHICAL CLUSTERING FOR TEXTURED POLARIMETRIC SA...
grssieee
 
PDF
CH3-1.pdf
ArbabLatif1
 
PDF
Practising Fourier Analysis with Digital Images
Frédéric Morain-Nicolier
 
PDF
The Heat Kernel And Theta Inversion On Sl2c Jay Jorgenson Serge Lang
zukerglowe5v
 
PDF
The Heat Kernel And Theta Inversion On Sl2c Jay Jorgenson Serge Lang
zukerglowe5v
 
PDF
Rouviere
eric_gautier
 
PDF
cvpr2009 tutorial: kernel methods in computer vision: part II: Statistics and...
zukun
 
PDF
Kernel estimation(ref)
Zahra Amini
 
PDF
Basics of probability in statistical simulation and stochastic programming
SSA KPI
 
Astaño 4
Cire Oreja
 
11.performance evaluation of geometric active contour (gac) and enhanced geom...
Alexander Decker
 
Performance evaluation of geometric active contour (gac) and enhanced geometr...
Alexander Decker
 
Hideitsu Hino
Suurist
 
icml2004 tutorial on spectral clustering part II
zukun
 
CVPR2010: Advanced ITinCVPR in a Nutshell: part 2: Interest Points
zukun
 
Clustering using kernel entropy principal component analysis and variable ker...
IJECEIAES
 
Renyis entropy
wtyru1989
 
Foundation of KL Divergence
Natan Katz
 
Computing f-Divergences and Distances of\\ High-Dimensional Probability Densi...
Alexander Litvinenko
 
01fourier
satheeshraja10
 
WE4.L09 - MEAN-SHIFT AND HIERARCHICAL CLUSTERING FOR TEXTURED POLARIMETRIC SA...
grssieee
 
CH3-1.pdf
ArbabLatif1
 
Practising Fourier Analysis with Digital Images
Frédéric Morain-Nicolier
 
The Heat Kernel And Theta Inversion On Sl2c Jay Jorgenson Serge Lang
zukerglowe5v
 
The Heat Kernel And Theta Inversion On Sl2c Jay Jorgenson Serge Lang
zukerglowe5v
 
Rouviere
eric_gautier
 
cvpr2009 tutorial: kernel methods in computer vision: part II: Statistics and...
zukun
 
Kernel estimation(ref)
Zahra Amini
 
Basics of probability in statistical simulation and stochastic programming
SSA KPI
 
Ad

More from grssieee (20)

PDF
Tangent height accuracy of Superconducting Submillimeter-Wave Limb-Emission S...
grssieee
 
PDF
SEGMENTATION OF POLARIMETRIC SAR DATA WITH A MULTI-TEXTURE PRODUCT MODEL
grssieee
 
PPTX
TWO-POINT STATISTIC OF POLARIMETRIC SAR DATA TWO-POINT STATISTIC OF POLARIMET...
grssieee
 
PPT
THE SENTINEL-1 MISSION AND ITS APPLICATION CAPABILITIES
grssieee
 
PPTX
GMES SPACE COMPONENT:PROGRAMMATIC STATUS
grssieee
 
PPTX
PROGRESSES OF DEVELOPMENT OF CFOSAT SCATTEROMETER
grssieee
 
PPT
DEVELOPMENT OF ALGORITHMS AND PRODUCTS FOR SUPPORTING THE ITALIAN HYPERSPECTR...
grssieee
 
PPT
EO-1/HYPERION: NEARING TWELVE YEARS OF SUCCESSFUL MISSION SCIENCE OPERATION A...
grssieee
 
PPT
EO-1/HYPERION: NEARING TWELVE YEARS OF SUCCESSFUL MISSION SCIENCE OPERATION A...
grssieee
 
PPT
EO-1/HYPERION: NEARING TWELVE YEARS OF SUCCESSFUL MISSION SCIENCE OPERATION A...
grssieee
 
PDF
Test
grssieee
 
PPT
test 34mb wo animations
grssieee
 
PPT
Test 70MB
grssieee
 
PPT
Test 70MB
grssieee
 
PDF
2011_Fox_Tax_Worksheets.pdf
grssieee
 
PPT
DLR open house
grssieee
 
PPT
DLR open house
grssieee
 
PPT
DLR open house
grssieee
 
PPT
Tana_IGARSS2011.ppt
grssieee
 
PPT
Solaro_IGARSS_2011.ppt
grssieee
 
Tangent height accuracy of Superconducting Submillimeter-Wave Limb-Emission S...
grssieee
 
SEGMENTATION OF POLARIMETRIC SAR DATA WITH A MULTI-TEXTURE PRODUCT MODEL
grssieee
 
TWO-POINT STATISTIC OF POLARIMETRIC SAR DATA TWO-POINT STATISTIC OF POLARIMET...
grssieee
 
THE SENTINEL-1 MISSION AND ITS APPLICATION CAPABILITIES
grssieee
 
GMES SPACE COMPONENT:PROGRAMMATIC STATUS
grssieee
 
PROGRESSES OF DEVELOPMENT OF CFOSAT SCATTEROMETER
grssieee
 
DEVELOPMENT OF ALGORITHMS AND PRODUCTS FOR SUPPORTING THE ITALIAN HYPERSPECTR...
grssieee
 
EO-1/HYPERION: NEARING TWELVE YEARS OF SUCCESSFUL MISSION SCIENCE OPERATION A...
grssieee
 
EO-1/HYPERION: NEARING TWELVE YEARS OF SUCCESSFUL MISSION SCIENCE OPERATION A...
grssieee
 
EO-1/HYPERION: NEARING TWELVE YEARS OF SUCCESSFUL MISSION SCIENCE OPERATION A...
grssieee
 
Test
grssieee
 
test 34mb wo animations
grssieee
 
Test 70MB
grssieee
 
Test 70MB
grssieee
 
2011_Fox_Tax_Worksheets.pdf
grssieee
 
DLR open house
grssieee
 
DLR open house
grssieee
 
DLR open house
grssieee
 
Tana_IGARSS2011.ppt
grssieee
 
Solaro_IGARSS_2011.ppt
grssieee
 

Recently uploaded (20)

PDF
Impact of IEEE Computer Society in Advancing Emerging Technologies including ...
Hironori Washizaki
 
PDF
Arcee AI - building and working with small language models (06/25)
Julien SIMON
 
PDF
Log-Based Anomaly Detection: Enhancing System Reliability with Machine Learning
Mohammed BEKKOUCHE
 
PDF
Windsurf Meetup Ottawa 2025-07-12 - Planning Mode at Reliza.pdf
Pavel Shukhman
 
PPT
Interview paper part 3, It is based on Interview Prep
SoumyadeepGhosh39
 
PDF
CloudStack GPU Integration - Rohit Yadav
ShapeBlue
 
PDF
Apache CloudStack 201: Let's Design & Build an IaaS Cloud
ShapeBlue
 
PDF
Ampere Offers Energy-Efficient Future For AI And Cloud
ShapeBlue
 
PDF
Blockchain Transactions Explained For Everyone
CIFDAQ
 
PDF
Building Resilience with Digital Twins : Lessons from Korea
SANGHEE SHIN
 
PDF
Meetup Kickoff & Welcome - Rohit Yadav, CSIUG Chairman
ShapeBlue
 
PDF
2025-07-15 EMEA Volledig Inzicht Dutch Webinar
ThousandEyes
 
PDF
HCIP-Data Center Facility Deployment V2.0 Training Material (Without Remarks ...
mcastillo49
 
PDF
HR agent at Mediq: Lessons learned on Agent Builder & Maestro by Tacstone Tec...
UiPathCommunity
 
PPTX
Extensions Framework (XaaS) - Enabling Orchestrate Anything
ShapeBlue
 
PDF
Women in Automation Presents: Reinventing Yourself — Bold Career Pivots That ...
DianaGray10
 
PDF
Market Wrap for 18th July 2025 by CIFDAQ
CIFDAQ
 
PPTX
Building and Operating a Private Cloud with CloudStack and LINBIT CloudStack ...
ShapeBlue
 
PDF
Upgrading to z_OS V2R4 Part 01 of 02.pdf
Flavio787771
 
PPTX
Top Managed Service Providers in Los Angeles
Captain IT
 
Impact of IEEE Computer Society in Advancing Emerging Technologies including ...
Hironori Washizaki
 
Arcee AI - building and working with small language models (06/25)
Julien SIMON
 
Log-Based Anomaly Detection: Enhancing System Reliability with Machine Learning
Mohammed BEKKOUCHE
 
Windsurf Meetup Ottawa 2025-07-12 - Planning Mode at Reliza.pdf
Pavel Shukhman
 
Interview paper part 3, It is based on Interview Prep
SoumyadeepGhosh39
 
CloudStack GPU Integration - Rohit Yadav
ShapeBlue
 
Apache CloudStack 201: Let's Design & Build an IaaS Cloud
ShapeBlue
 
Ampere Offers Energy-Efficient Future For AI And Cloud
ShapeBlue
 
Blockchain Transactions Explained For Everyone
CIFDAQ
 
Building Resilience with Digital Twins : Lessons from Korea
SANGHEE SHIN
 
Meetup Kickoff & Welcome - Rohit Yadav, CSIUG Chairman
ShapeBlue
 
2025-07-15 EMEA Volledig Inzicht Dutch Webinar
ThousandEyes
 
HCIP-Data Center Facility Deployment V2.0 Training Material (Without Remarks ...
mcastillo49
 
HR agent at Mediq: Lessons learned on Agent Builder & Maestro by Tacstone Tec...
UiPathCommunity
 
Extensions Framework (XaaS) - Enabling Orchestrate Anything
ShapeBlue
 
Women in Automation Presents: Reinventing Yourself — Bold Career Pivots That ...
DianaGray10
 
Market Wrap for 18th July 2025 by CIFDAQ
CIFDAQ
 
Building and Operating a Private Cloud with CloudStack and LINBIT CloudStack ...
ShapeBlue
 
Upgrading to z_OS V2R4 Part 01 of 02.pdf
Flavio787771
 
Top Managed Service Providers in Los Angeles
Captain IT
 

Kernel Entropy Component Analysis in Remote Sensing Data Clustering.pdf

  • 1. Kernel Entropy Component Analysis in Remote Sensing Data Clustering Luis Gómez-Chova1 Robert Jenssen2 Gustavo Camps-Valls1 1 Image Processing Laboratory (IPL), Universitat de València, Spain. [email protected] , http://www.valencia.edu/chovago 2 Department of Physics and Technology, University of Tromsø, Norway. [email protected] , http://www.phys.uit.no/∼robertj IGARSS 2011 – Vancouver, Canada * IPL Image Processing Laboratory
  • 2. Intro ECA KECA Clustering Results Conclusions Outline 1 Introduction 2 Entropy Component Analysis 3 Kernel Entropy Component Analysis (KECA) 4 KECA Spectral Clustering 5 Experimental Results 6 Conclusions and Open questions L. Gómez-Chova et al. Kernel Entropy Component Analysis IGARSS 2011 – Vancouver 1/26
  • 3. Intro ECA KECA Clustering Results Conclusions Motivation Feature Extraction Feature selection/extraction essential before classification or regression to discard redundant or noisy components to reduce the dimensionality of the data Create a subset of new features by combinations of the existing ones Linear Feature Extraction Offer Interpretability ∼ knowledge discovery PCA: projections maximizing the data set variance PLS: projections maximally aligned with the labels ICA: non-orthogonal projections with maximal independent axes Fail when data distributions are curved Nonlinear feature relations L. Gómez-Chova et al. Kernel Entropy Component Analysis IGARSS 2011 – Vancouver 2/26
  • 4. Intro ECA KECA Clustering Results Conclusions Objectives Objectives Kernel-based non-linear data-transformation Captures the data higher order statistics Extracts features suited for clustering Method Kernel Entropy Component Analysis (KECA) [Jenssen, 2010] Based on Information Theory: Maximally preserves entropy of the input data Angular clustering maximizes cluster divergence Out-of-sample extension to deal with test data Experiments Cloud screening from ENVISAT/MERIS multispectral images L. Gómez-Chova et al. Kernel Entropy Component Analysis IGARSS 2011 – Vancouver 3/26
  • 5. Intro ECA KECA Clustering Results Conclusions 1 Introduction 2 Entropy Component Analysis 3 Kernel Entropy Component Analysis (KECA) 4 KECA Spectral Clustering 5 Experimental Results 6 Conclusions and Open questions L. Gómez-Chova et al. Kernel Entropy Component Analysis IGARSS 2011 – Vancouver 4/26
  • 6. Intro ECA KECA Clustering Results Conclusions Information-Theoretic Learning Entropy Concept Entropy of a probability density function (pdf) is a measure of information Entropy ⇔ Shape of the pdf L. Gómez-Chova et al. Kernel Entropy Component Analysis IGARSS 2011 – Vancouver 5/26
  • 7. Intro ECA KECA Clustering Results Conclusions Information-Theoretic Learning Divergence Concept The entropy concept can be extended to obtain a measure of dissimilarity between distributions ←→ Divergence ⇔ Distance between pdfs L. Gómez-Chova et al. Kernel Entropy Component Analysis IGARSS 2011 – Vancouver 6/26
  • 8. Intro ECA KECA Clustering Results Conclusions Entropy Component Analysis Shannon entropy Z H(p) = − p(x) log p(x)dx How to handle densities? How to compute integrals? Rényi’s entropies Z 1 H(p) = − log p α (x)dx 1−α Rényi’s entropies contain Shannon as a special case α → 1 We focus on the Rényi’s quadratic entropy α = 2 Rényi’s quadratic entropy Z H(p) = − log p 2 (x)dx = − log V (p) It can be estimated directly from samples! L. Gómez-Chova et al. Kernel Entropy Component Analysis IGARSS 2011 – Vancouver 7/26
  • 9. Intro ECA KECA Clustering Results Conclusions Entropy Component Analysis Rényi’s quadratic entropy estimator Estimated from data D = {x1 , . . . , xN } ∈ Rd generated by the pdf p(x) Parzen window estimator with a Gaussian or Radial Basis Function (RBF): 1 X 2 K (x, xt | σ) /2σ 2 ` ´ p (x) = ˆ with K (x, xt ) = exp − x − xt N x ∈D t Idea: Place a kernel over the samples and sum with proper normalization The estimator for the information potential V (p) = p 2 (x)dx R Z Z 1 X 1 X ˆ V (p) = p 2 (x)dx = ˆ K (x, xt | σ) K (x, xt | σ)dx N x ∈D N x ∈D t t Z 1 X X = K (x, xt | σ)K (x, xt | σ)dx N 2 x ∈D x ∈D t t 1 X X √ 1 = 2 K (xt , xt | 2σ) = 2 1 K1 N x ∈D x ∈D N t t L. Gómez-Chova et al. Kernel Entropy Component Analysis IGARSS 2011 – Vancouver 8/26
  • 10. Intro ECA KECA Clustering Results Conclusions Entropy Component Analysis Rényi’s quadratic entropy estimator Empirical Rényi entropy estimate resides in the corresponding kernel matrix ˆ 1 V (p) = 2 1 K1 N It can be expressed in terms of eigenvalues and eigenvectors of K D diagonal matrix of eigenvalues λ1 , . . . , λN  K = EDE E matrix with the eigenvectors e1 , . . . , eN Therefore we then have N 1 X “p ”2 ˆ V (p) = 2 λi ei 1 N i =1 √ where each term λi ei 1 will contribute to the entropy estimate ECA dimensionality reduction Idea: to find the smallest set of features √ maximally preserve the that entropy of the input data (contributions λi ei 1) L. Gómez-Chova et al. Kernel Entropy Component Analysis IGARSS 2011 – Vancouver 9/26
  • 11. Intro ECA KECA Clustering Results Conclusions Entropy Component Analysis H(p) = 4.36 H(p) = 4.74 H(p) = 5.05 H(p) = 4.71 ˆ H(p) = 4.81 , H(p) = 4.44 L. Gómez-Chova et al. Kernel Entropy Component Analysis IGARSS 2011 – Vancouver 10/26
  • 12. Intro ECA KECA Clustering Results Conclusions 1 Introduction 2 Entropy Component Analysis 3 Kernel Entropy Component Analysis (KECA) 4 KECA Spectral Clustering 5 Experimental Results 6 Conclusions and Open questions L. Gómez-Chova et al. Kernel Entropy Component Analysis IGARSS 2011 – Vancouver 11/26
  • 13. Intro ECA KECA Clustering Results Conclusions Kernel Principal Component Analysis (KPCA) Principal Component Analysis (PCA) Find projections of X = [x1 , . . . , xN ] maximizing the variance of data XU PCA: maximize: Trace{(XU) (XU)} = Trace{U Cxx U} subject to: U U=I Including Lagrange multipliers λ, this is equivalent to the eigenproblem Cxx ui = λi ui → Cxx U = UD ui are the eigenvectors of Cxx and they are orthonormal, ui uj = 0 PCA L. Gómez-Chova et al. Kernel Entropy Component Analysis IGARSS 2011 – Vancouver 12/26
  • 14. Intro ECA KECA Clustering Results Conclusions Kernel Principal Component Analysis (KPCA) Kernel Principal Component Analysis (KPCA) Find projections maximizing variance of mapped data [φ(x1 ), . . . , φ(xN )] KPCA: maximize: Tr{(ΦU) (ΦU)} = Tr{U Φ ΦU} subject to: U U=I The covariance matrix Φ Φ and projection matrix U are dH × dH !!! KPCA through kernel trick Apply the representer’s theorem: U = Φ A where A = [α1 , . . . , αN ] KPCA: maximize: Tr{A ΦΦ ΦΦ A} = Tr{A KKA} subject to: U U = A ΦΦ A = A KA = I Including Lagrange multipliers λ, this is equivalent to the eigenproblem KKαi = λi Kαi → Kαi = λi αi Now matrix A is N × N !!! (eigendecomposition of K = EDE = AA ) L. Gómez-Chova et al. Kernel Entropy Component Analysis IGARSS 2011 – Vancouver 13/26
  • 15. Intro ECA KECA Clustering Results Conclusions Kernel ECA Transformation Kernel Entropy Component Analysis (KECA) KECA: projection of Φ onto those m feature-space principal axes contributing most to the Rényi entropy estimate of the input data 1 2 Φeca = ΦUm = Em Dm √ Projections onto a single principal axis ui in H is given by ui Φ = λi ei 1 1 Pm `√ ´2 ˆ Entropy associated with Φeca is Vm = N 2 1 Keca 1 = N 2 λi ei 1 i =1 Note that Φeca is not necessarily based on the top eigenvalues λi since ei 1 also contributes to the entropy estimate Out-of-sample extension Projections for a collection of test data points: −1 −1 Φeca,test = Φtest Um = Φtest ΦEm Dm 2 = Ktest Em Dm 2 L. Gómez-Chova et al. Kernel Entropy Component Analysis IGARSS 2011 – Vancouver 14/26
  • 16. Intro ECA KECA Clustering Results Conclusions Kernel ECA Transformation KECA example Original PCA KPCA KECA KECA reveals cluster structure → underlying labels of the data Nonlinearly related clusters in X → different angular directions in H An angular clustering based on the kernel features Φeca seems reasonable L. Gómez-Chova et al. Kernel Entropy Component Analysis IGARSS 2011 – Vancouver 15/26
  • 17. Intro ECA KECA Clustering Results Conclusions 1 Introduction 2 Entropy Component Analysis 3 Kernel Entropy Component Analysis (KECA) 4 KECA Spectral Clustering 5 Experimental Results 6 Conclusions and Open questions L. Gómez-Chova et al. Kernel Entropy Component Analysis IGARSS 2011 – Vancouver 16/26
  • 18. Intro ECA KECA Clustering Results Conclusions KECA Spectral Clustering Cauchy-Schwarz divergence The Cauchy-Schwarz divergence between the pdf of two clusters is R pi (x)pj (x)d x DCS (pi , pj ) = − log(VCS (pi , pj )) = − log qR R pi (x)d x pj2 (x)d x 2 Measuring dissimilarity in a probability space is a complex issue 1 φ(xt ): P Entropy interpretation in the kernel space → mean vector µ = N Z 1 1 V (p) = p 2 (x)dx = 2 1 K1 = 2 1 ΦΦ 1 = µ µ = µ 2 ˆ ˆ N N µi µj Diverg. via Parzen windowing ⇒ VCS (pi , pj ) = ˆ µi µj = cos ∠(µi , µj ) KECA Spectral Clustering Angular clustering of Φeca maximizes the CS divergence between clusters: k X J(C1 , . . . , Ck ) = Ni cos ∠(φeca (x), µi ) i =1 L. Gómez-Chova et al. Kernel Entropy Component Analysis IGARSS 2011 – Vancouver 17/26
  • 19. Intro ECA KECA Clustering Results Conclusions KECA Spectral Clustering KECA Spectral Clustering Algorithm 1 Obtain Φeca by Kernel ECA 2 Initialize means µi , i = 1, . . . , k 3 For all training samples assign a cluster xt → Ci maximizing cos ∠(φeca (xt ), µi ) 4 Update mean vectors µi CS 5 Repeat steps 3 and 4 until convergence py tro En Intuition A kernel feature space data point φeca (xt ) is assigned to the cluster represented by the closest mean vector µi in terms of angular distance L. Gómez-Chova et al. Kernel Entropy Component Analysis IGARSS 2011 – Vancouver 18/26
  • 20. Intro ECA KECA Clustering Results Conclusions 1 Introduction 2 Entropy Component Analysis 3 Kernel Entropy Component Analysis (KECA) 4 KECA Spectral Clustering 5 Experimental Results 6 Conclusions and Open questions L. Gómez-Chova et al. Kernel Entropy Component Analysis IGARSS 2011 – Vancouver 19/26
  • 21. Intro ECA KECA Clustering Results Conclusions Experimental results: Data material Cloud masking from ENVISAT/MERIS multispectral images Pixel-wise binary decisions about the presence/absence of clouds MERIS images taken over Spain and France Input samples with 13 spectral bands and 6 physically inspired features Barrax (BR-2003-07-14) Barrax (BR-2004-07-14) France (FR-2005-03-19) L. Gómez-Chova et al. Kernel Entropy Component Analysis IGARSS 2011 – Vancouver 20/26
  • 22. Intro ECA KECA Clustering Results Conclusions Experimental results: Numerical comparison Experimental setup KECA compared with k-means, KPCA + k-means, and Kernel k-means Number of clusters fixed to k = 2 (cloud-free and cloudy areas) Number of KPCA and KECA features fixed to m = 2 (stress differences) RBF-kernel width parameter is selected by gird-search for all methods Numerical results Validation results on 10000 pixels per image manually labeled Kappa statistic results over 10 realizations for all images BR-2003-07-14 BR-2004-07-14 FR-2005-03-19 1 0.8 0.6 0.5 0.9 0.7 Estimated κ statistic Estimated κ statistic Estimated κ statistic 0.4 0.8 0.6 0.3 KECA 0.7 KPCA 0.2 Kernel k-means 0.5 k-means 0.6 0.1 0.5 0.4 0 200 400 600 800 1000 200 400 600 800 1000 200 400 600 800 1000 #Samples #Samples #Samples L. Gómez-Chova et al. Kernel Entropy Component Analysis IGARSS 2011 – Vancouver 21/26
  • 23. Intro ECA KECA Clustering Results Conclusions Experimental results: Numerical comparison Average numerical results 0.8 0.7 Estimated κ statistic KECA 0.6 KPCA Kernel k-means k-means 0.5 0.4 200 400 600 800 1000 #Samples KECA outperforms k-means (+25%) and Kk-means and KPCA (+15%) In general, the number of training samples positively affect the results L. Gómez-Chova et al. Kernel Entropy Component Analysis IGARSS 2011 – Vancouver 22/26
  • 24. Intro ECA KECA Clustering Results Conclusions Experimental results: Classification maps Test Site k-means Kernel k-means KPCA KECA Spain (BR-2003-07-14) OA=96.25% ; κ=0.6112 OA=96.22% ; κ=0.7540 OA=47.52% ; κ=0.0966 OA=99.41% ; κ=0.9541 Spain (BR-2004-07-14) OA=96.91% ; κ=0.6018 OA=62.03% ; κ=0.0767 OA=96.66% ; κ=0.6493 OA=97.54% ; κ=0.7319 France (FR-2005-03-19) OA=92.87% ; κ=0.6142 OA=92.64% ; κ=0.6231 OA=80.93% ; κ=0.4051 OA=92.91% ; κ=0.6302 L. Gómez-Chova et al. Kernel Entropy Component Analysis IGARSS 2011 – Vancouver 23/26
  • 25. Intro ECA KECA Clustering Results Conclusions 1 Introduction 2 Entropy Component Analysis 3 Kernel Entropy Component Analysis (KECA) 4 KECA Spectral Clustering 5 Experimental Results 6 Conclusions and Open questions L. Gómez-Chova et al. Kernel Entropy Component Analysis IGARSS 2011 – Vancouver 24/26
  • 26. Intro ECA KECA Clustering Results Conclusions Conclusions and open questions Conclusions Kernel entropy component analysis for clustering remote sensing data Nonlinear features preserving entropy of the input data Angular clustering reveals structure in terms of clusters divergence Out-of-sample extension for test data → mandatory in remote sensing Good results on cloud screening from MERIS images KECA code is available at http://www.phys.uit.no/∼robertj/ Simple feature extraction toolbox (SIMFEAT) soon at http://isp.uv.es Open questions and Future work Pre-images of transformed data in the input space Learn kernel parameters in an automatic way Test KECA in more remote sensing applications L. Gómez-Chova et al. Kernel Entropy Component Analysis IGARSS 2011 – Vancouver 25/26
  • 27. Intro ECA KECA Clustering Results Conclusions Kernel Entropy Component Analysis in Remote Sensing Data Clustering Luis Gómez-Chova1 Robert Jenssen2 Gustavo Camps-Valls1 1 Image Processing Laboratory (IPL), Universitat de València, Spain. [email protected] , http://www.valencia.edu/chovago 2 Department of Physics and Technology, University of Tromsø, Norway. [email protected] , http://www.phys.uit.no/∼robertj IGARSS 2011 – Vancouver, Canada * IPL Image Processing Laboratory L. Gómez-Chova et al. Kernel Entropy Component Analysis IGARSS 2011 – Vancouver 26/26