Lean Fundamentals Lean Supplier Association - Austin May/2001 WELCOME!
Agenda Introduction Lean Thinking Lean Line Design Conclusion
Influences That Trigger Change high cost of manufacturing fluctuations in demands rapid growth in size & revenue tighter quality standards highly configurable products long learning curves material  shortages increased competition insufficient vendor capabilities inconsistent processes
Industry Phases Cost Drivers Simpler Designs Commonality Manufacturable Models Maintainability/Serviceability Economies of Scale Short Cycle Times Supply Chain Management Differentiation Cost Innovation
Lean Manufacturing Progression 1995 Benchmarking Training at JcIT Institute Pilot conversions on modules
Lean Manufacturing Progression 1995 1996 ‘ Lean Teams’ Formed Division Conversions Began Support Functions Re-design Began
Lean Manufacturing Progression 1995 1996 ULMI 1997
Establishment of Common Processes for: -  Manufacturing -  Product development -  Product management Improved Performance in: -  Profitability -  Quality -  Cycle Time -  Asset Management -  Delivery Unified Lean Manufacturing Initiative
Transitioning to a Lean Enterprise
Going Up for a Strategic View...
What It Means to be a Lean Enterprise?  Products Processes Individuals Teams Organizations Functions The  WHOLE  Business System It Reaches  across It Consists of Customers Suppliers Board of Directors Investors
A LEAN enterprise focuses on... A LEAN enterprise practices LEAN thinking! Eliminating non value-added activities  throughout the enterprise Building an integrated product delivery  process to meet changing needs of customers Supporting a fundamental change in  management philosophy
Characteristics of a Lean Enterprise Processes are in place to  capture  the knowledge of  customers  (internal and  external!)   and their values All processes, systems and initiatives -including supplier partnerships- are aligned, to efficiently provide the right products to the right  customers at the right time…. The entire product delivery  process is flexible so the  enterprise can respond quickly  to changes Management of the business  is based on metrics, and they  are aligned at all levels  to evaluate performance
Agenda Introduction Lean Thinking Lean Line Design Conclusion
Lean Thinking... ...a mentality that emphasizes doing those things, and only those things, that create or add value to what the customer is willing to pay for. If it doesn’t add value, it is  WASTE !
Principles of Lean Thinking  from Womack & Jones  Lean Thinking Specify the value of each product and service from the customer’s perspective. Identify every step in the value stream to highlight waste. Make products flow without interruption by eliminating waste. Produce only what is pulled by the customer. Pursue perfection by continually improving.
Lean Principle #1 Specify the value of each product or service from the customers’ perspective.
What is value? Value is the product or service which meets the customer’s requirements at a price he is willing to pay when he requests it. Value is providing the right product for the right price at the right time.
Who’s the Customer? You will likely have multiple customers, and they change frequently! Anyone, internal or external, who  requires a product or service Final consumer Boss/management Co-workers
Lean Principle #2 Identify every step in the value stream to highlight waste.
  Mapping out the Process 1. Identify all steps in the value stream, including an estimated duration. 2. Identify value add activities vs. waste: Value Added Necessary, but non-value added Non-value added 3. Indicate types of waste
A Value Stream … consists of all activities and processes that are required to bring a specific product/service: from concept to design and engineering from raw materials to product launch from order-taking to scheduling from delivery to & support of the customer This means  everybody , and  everything  that takes place to produce the product/service!
Disconnected Processes Lost orders,  Delays,  Mistakes and  Other failures that cost time, money and customers! Most processes are full of  disconnects and bottlenecks  where the process crosses  departmental lines.
Adding Value or Waste? Lean thinking distinguishes between those  activities that are actually adding value to the product or service, and those activities  that are not adding value. If it’s not adding value, it is  WASTE !
Waste Eliminating waste is the greatest potential source of improvement in corporate profit, performance, and customer service. For most production operations:   -  60% add no value at all   -  35% are “necessary” activities, but don’t add value   -  only 5% of activities actually add value!
Lean Flow Waste disrupts the continuous flow to complete a product or process Processes or machines that take too long Inadequate training or staffing Lack of information and direction Bad quality or late arrival of materials Inventory and queues are usually symptoms of another problem
  Mapping out the Process 1. Identify all steps in the value stream, including an estimated duration. 2. Identify value add activities vs. waste: Value Added Necessary, but non-value added Non-value added 3. Indicate types of waste
Value Stream Mapping Tool Value Stream is all the actions (both value added and non value added) currently required to bring a product through the main flows essential to every product
Why Value Stream Mapping is an  Essential Tool Helps you to visualize the big picture, not just individual processes to improve the whole, not just optimizing the parts. Helps you to see the sources of waste in your value stream It forms the basis of a Lean Implementation Plan. It shows the linkage between the information flow and the material flow.
Initial Value Stream Mapping Steps Product Family Current-State Drawing Future-State Drawing Work Plan & Implementation
Value Stream Improvement & Process Improvement Follow the product from  beginning to end Draw visual representation of every process in the  materials  and  information  flows
 
 
Information for a process data box “ The Big Four”: Number of product variations Cycle time (from 1 piece to the next) Changeover time Process Reliability Number of operators Scrap Rate Production batch size Working Time (minus breaks) Pack Size
A Fictional Value Stream Map - An example of Lean Tools   Total lead time
A Fictional Value Stream Map -An example of Lean Tools   Total lead time
We need a next Lean Leap: Value Stream Management Focus on the entire value stream for product families. Make someone responsible for each product family: the Value Stream Manager. Ask them to create an accurate current state. Tell the traditional functions to support the VSMs.
Using Five Whys Root cause Problem Data gathering Problem clarification Why? Why? Why? Why? Why?
Measurements Why measure? What to measure? Hierarchy of measurements Leading and lagging indicators Importance of adding a reference, benchmark, or standard Location for measurements  Data and information Data collection and processing
Measurements-  Why Measure? You can manage if you can measure Offers a baseline for continuous improvement You will know if your efforts to improve are working Customer requirements demand it You can make decisions based on the information derived from the measurements Lean conversion  Certification Pricing Etc.
Measurements  To ensure they will be effective and useful, determine: Which measures does the customer want? Which measures do you need to improve performance? Cycle time  Quality Cost Productivity What information/results do you want to obtain? Remember:  if the measure is not being used for decision making, ask  “WHY ARE WE MEASURING THIS?” Caution: Measurements entail cost and effort!
Measurements  Determine how the types and locations of the metrics are linked throughout the organization Identify the critical operations to determine where to start for the most cost effective improvements Create documented maps of the processes:  Identify the inputs & outputs Set applicable standards for each critical step Show cause and effect relationships Disconnects will indicate missing or non value- adding measurements
It all starts with a  Hoshin Annual Operating Plan (AOP) ... A specific, measurable objective to achieve breakthrough results. Measurements
The Aim of Hoshin Planning is to ... Align people, activities, and performance metrics throughout  all levels of the organization with strategic priorities so the Company can achieve its corporate mission….
Measurements Hoshins/AOP Goals Inventory Quality Cost Cycle Time Failure Internal/ External Appraisal Prevention Throughput  Takt Operating  Expenses
Measurements-  Measure What?   Hierarchy of Measurements Similar to Hoshin planning, define the hierarchy of measurements and show the cascading links between metrics at different levels of the company. Level 1:  Earnings / Profitability, Customer  satisfaction, On time delivery Level 2:  Plant based metrics: scrap rates,  returns,  schedule… Level 3:  Line based metrics: cycle time, yields,  escapes... Plant 1 Plant 2 Company Line 1 Line 2 Line 3 Line 2 Line 1 Example: 3 Level System
Cascading Objective Process Level 1 Level 3 Level 2 Programs Division Corporation Hoshin  Initiatives Corporate Objectives Strategies Business Unit  Strategies Division Strategies Business Unit Business Unit Objectives Division   Objectives
Measurements-  Measure What? Have consistent definitions for whatever is being measured Know the difference between proactive and reactive:  - Lagging - downstream indicators for use in preventing  defects upstream (reactive) - Leading - upstream indicators for use in predicting quality downstream (proactive) Example:  high reject rates (leading) can be an  indication of poor profitability (lagging)
Measurements-  Measure What? Measures have little meaning in isolation Comparison with a reference will add relevance In absence of a standard or benchmark, at least have a baseline to use for making comparisons Month Cycle Time Month Cycle Time Target
Measurements-  Measure Where? Most measurements are carried out too late; typically at the end of the process (lagging indicators) Such measurements are usually easy and convenient to install, but might be of little help in preventing problems Measuring as close as possible to the point of cause or occurrence is more pro-active (leading indicators) Implementing closed loop feedback and real time controls on the operations can actually prevent non-conformances from occurring in the first place Measurements are often started on every operation in  the business, even if they aren’t the right ones!
Measurements-  Data and Information Data is not always the same as information Information is that which can be used for decision making Information for one stage can be data for the next ---Data set 1 ---Data set 2 ---Data set 3 Information  set 3 Information  set 1 Information  set 2 Processing Data set 4 Data set 5 Processing Supplier End   Applied Materials End
Measurements - Data Collection and Processing The metric is only as good as the integrity of the data collected Statistical treatment of data can add more power to analysis & decision making  Presentation of information should be simple yet  comprehensive, and it should be directly aimed at facilitating the decisions that are to be made Information should be made available in a timely manner to those who need it Cross check to see if the information is useful in the way it is intended to be
Measurements - Summary Start with what is important to the customer Remember that measurements are often lagging indicators Understand the process, the causes/effects, the inputs/outputs Develop the hierarchy of measurements to address gaps and redundancies Identify the critical points where measurements will make the biggest difference
Measurements - Summary Use measurements as leading indicators for the most proactive approach, and understand how they are linked to lagging indicators. Data integrity checks are important since it becomes the foundation for many decisions Presentation of information (rather than data) should be simple, comprehensive, and timely
  Mapping out the Process 1. Identify all steps in the value stream, including an estimated duration. 2. Identify value add activities vs. waste: Value Added Necessary, but non-value added Non-value added 3. Indicate types of waste
Overproduction Waiting Time Transportation Processing Inventory Motion Defects 7 Wastes
Overproduction  Producing More Than Needed Producing Faster Than Needed
Wait Time Waiting for signatures  Watching machines or equipment run Keeping busy to avoid being idle Waiting for computers to process data Waiting for materials  Waiting for someone w/ the right skill Waiting in traffic
Transportation Sending materials/product long distances Handling materials/paperwork multiple times Storing incoming material before it is used Returning unused materials  Having multiple storage locations Routing documents to multiple signers
Processing   Processes that don’t do the entire  job, or that do it incorrectly Poorly maintained equipment that produces poor quality Doing things manually instead of automatically Doing more than would be necessary
Inventory  Cost of materials Cost and management of obsolete materials Space & equipment Interest charges Defects, rework Paperwork & documents in queue Inventory accounting
Inventory Analogy  Wait Time Defects Process Over Production Water Level = Inventory Level Boat = Production System Rocks = Hidden Problems (Uncovered as Inventory is Reduced)
Motion  Searching for tools or supplies Walking to multiple areas to accomplish a task Things located in random locations or not according  to frequency of use Picking something up multiple times
Defects  Rework Scrap Lost work Time Sorting Warranty Costs Lost Customer Satisfaction Other intangibles (Typos?)
Lean Principle #3 Make products flow without interruption by eliminating waste.
Tools & Techniques 5Ss Poka-yoke Visual Controls 5 Whys Lean Enterprise
5Ss: The Gateway to Quality
Benefits Gives the opportunity to provide creative input to how your workplace should be organized and laid out, and  to how your work should be done Makes your workplace more a pleasant to work Makes your job more satisfying Removes many obstacles and frustrations in your work Helps you know what you are expected to do, and when and where you are expected to do it Makes it easier to communicate with everyone you work
5Ss: The Gateway to Quality 5 S Set in order Standardize Shine Sustain Sort
Sort & Discard-Implementation No Value & Easy To Dispose Of Retain Some Value No Value But Costly To Dispose Of  Dispose Immediately Actively Look  For Best Customer Work Out Less Costly Method For Disposal Necessary Items Implement Next S Unnecessary Items
Sort & Discard BEFORE Sort & Discard AFTER Sort & Discard
Sort &  Discard Before After
Set in Order To arrange necessary items  in good order so that they are  easily accessible for use There should be a home  for everything and everything  should be in its home 60 SECONDS RULE Everything should be able to  be found & retrieved within 1 min.
Set in Order-Implementation Unnecessary Items Sort/Discard Frequently Used Sometimes Used Not Used But Must Be Kept  Place Near To The Point of Use Place A Bit Distant To The Point Of Use Place Separately Necessary Items
Set in Order-Tools BENEFITS OF MOTION MAPPING BEFORE Workstation 100 Workstation 200 Parts Integration Integration AFTER Workstation 100 Parts Integration Workstation 200 Integration Parts
Set in Order-Tools LABELING
Set in Order-Tools FLOOR  TAPING
Set in Order-Tools Visual Management - You can see the work status of the line - there is no work present at these stations
Set in Order-Tools COLOR CODING
Standardize Taping and Post
Set in Order-Tools Part Replenishment carts are color coded by particular route.
Set in Order-Tools SILHOUETTES /CUTOUTS
Set in Order-Example Material Kanbans Tool Cutouts Bin Labels In Process Testing Kanban
Shine/Inspect-Implementation Unnecessary Items Sort/Discard Set in order Necessary Items Defect or Irregularity Found Instant Maintenance Requested Maintenance Shine/Inspect
Shine/Inspect-Tools 1. DEFINE AREA OF RESPONSIBILITY Draw map of cleaning area 2. DISTRIBUTE RESPONSIBILITY Schedule cleaning to be done and people to do it Devote certain times exclusively to cleaning 3. DEFINE STANDARD Develop a cleaning/inspection  checklist Establish a minimum requirement
Shine/Inspect-Tools CHECKLISTS Checking Item 5 S Checklist No unnecessary stock  items or work in progress All machines & equipment  are in regular use All jigs, fixtures and  tools are in regular  use All unnecessary items can  be identified at a glance There are clear standards  for eliminating excess 1 2 3 4 5 Seiri 1 2 3 4 5 Seiri Parts or  Materials Machines &  Equipment Jigs,  Fixtures &  Tools Visual  Controls Standards  for  Disposal Visual controls used to  fix location of all items  within the workcenter Clear indications of max &  min stock quantities Blue tape used to divide  workcenter Jig and tool storage  organized for ease of  removal and return Score Evaluation Criteria Workcenter Name Out Of Cat Comp. By Date Score No. 1 2 3 4 Seiton Storage  Labels Quantity  Indicators Dividing  Lines Jigs,  Fixtures &  Tools
5S Organizer and Implementation Schedule
Shine/Inspect-Tools SHELVES SHELVES SHELVES SHELVES SHELVES SHELVES INTEGRATION STATION 2 INTEGRATION STATION 1 MAPS SHELVES SHELVES SHELVES SUBASSEMBLY STATION 3 SUBASSEMBLY STATION 3 SUBASSEMBLY STATION 3
Shine/Inspect-Tools Decide order and frequency: daily, weekly, monthly SCHEDULE Seiri Sort/ Discard Seiton Arrange/ Order Seiso Clean/ Inspect Seiketsu Stand./ Improve Shitsuke Believe/ Discipline 5 S Category Task Responsibility Date To Complete Date Completed 5 S Schedule
5 S Schedule - another example
5 S Checklist - Example
Shine/Inspect-Tools -- Radar Chart
Shine/Inspect-Tools --  Thermometer
Standardize VIP TOUR MONDAY TUESDAY THURSDAY … ...Not just when the boss is around
Standardize THURSDAY MONDAY TUESDAY …… .Not just at the beginning of the week WEDNESDAY
Standardize ...But as a regular function of your daily activities WEEK 1 WEEK 5
Sustain PROMOTION AND RECOGNITION PROGRAM Leadership Roles Establish a 5 S  evaluation and promotion plan Organize 5 S  inter-departmental competitions to sustain activities Periodically award groups and individuals implementing  good 5 S practices Implementation Roles Conduct 5 S audits regularly Look for innovative and exceptional 5 S performance and bring to the attention of supervisors
Sustain Ergonomic floor mats for work areas. Material Kanbans Overhead signs designating area. Additional overhead task lights for ergonomic concerns. Parts off work surface and labeled. Designated location for desk equipment
Tools & Techniques 5Ss Poka-yoke Visual Controls 5 Whys Lean Enterprise
Visual Controls Visual controls are intended to make things easy to understand at a glance
Visual Controls 0060-04090  Qty 20 XYZ Line A, Op 30  50-46-23 DMR Shift Output Output Level (1/29 to date) Goal Credit Memo Debit Memo
Visual Controls Red Bins: DMR Parts A Flow Rack Yellow Bins: CES or low usage Parts Blue Bins: Regular Parts
Visual Controls Builds trust between Management and Employees. Creates a company culture where sharing is a key principle. Employees control the production line with minimum confusion for “What needs to be done” and maximum understanding of “How it must be done." Allows everyone to visually observe factory progress and expose inefficiencies. Toyota:   When you make problems visual, it takes less people to solve them. “ A picture is worth a thousand words.”
Visual Controls Some Considerations of Visual Management A few, not too many Easy to see Must get your attention  Must have an effect on you Anyone can understand
Visual Management:  Display Boards Line #3  P5000 Robot  Supervisor: John Glenn The Team: Dave Thomas Brian Roy Pat Wilson Greg Watkins Pete Wilson Lines Stops due to: (1/29 to date) Defective part Part shortage Accident Test fixture failure Tool failure Week # of Shortages Goal Quality Level (1/29 - 5/27) Shift Output Output Level (1/29 to date) Line Status Board Example Goal Pareto Chart (1/29 to date) Part Shortage # of Line Stops Defective Parts Test Fixture Failure Tooling Failure Accident
Visual Management:  Display Boards Orientation Trainee Certified Master Skill Diversity Chart Operations Line #: 3 P5000 Robot Team Members A1 A2 A4 A5 A6 A7 Adrian Castro Mike Depp Jorge Nakos Ricky Martin Eli Button
Visual Management - Sequencing board is present on the floor for workers to see.
Visual Management:  Schedule Board
Visual Example:  Andon System Line Status Communication
Visual Example:  Andon System Line Status Communication Red: Work activity stopped due to a problem Yellow: Problem encountered, but no disruption of activity Andon:  Japanese word for  lantern Alert Buttons Andon Unit
Andon System Data Collection Visual Signal located at the cell Light Flag Andon Metrics Sheet located at Cell can track: Issues and reason codes Corrective actions taken Repeat issues (pareto of part shortages, root cause) Amount of time andon light is on = workstation is down   # of times per month or quarter - root cause Andon Escalation Procedure posted  Who to contact, escalate Time based
Department Andon
Andons for Project Management
5S Tool Display You can visually see the tools that are missing. Work station is color coded and labeled. Tool cutouts are present and tools are color coded.
Visual Example:  Kanban    Signal to Build or Fill
Before - WHSE Ship and Receive
After - Shipping and Receiving Non value added items removed Yellow tape indicates walk way  Shipping is in designated and appropriate area Blue tape for designated cells and traffic flow Cells clearly marked Better traffic flow
Tools & Techniques 5Ss Poka-yoke Visual Controls 5 Whys Lean Enterprise
Error Proofing: Poka Yoke Poka yoke is a method aimed at designing a product, process or service where mistakes are prevented, or at least easily detected and corrected.
Error Proofing: Poka Yoke Poka Yoke is Japanese for Mistake Proofing. Poka Yoke differs from traditional inspection techniques that are problem detection oriented rather than problem prevention.  The focus of Poka Yoke is on 100% inspection at the source rather than sample inspections at the end of a process or set of processes. Inspection at the source allows a process to be stopped when a nonconformity is present.  The key to effective Poka Yoke is to target repetitive tasks and actions that require operator diligence, uncover the root cause of errors, and make it impossible to make a mistake.
Error Proofing: Poka Yoke A Few Everyday Examples Auto shut-off irons so we cannot make the mistake of leaving the iron on all day. Automatic sinks in public facilities so the water cannot be left on when someone walks away. Automatic toilets in public facilities so …….(well, you know) Coffee makers that stop brewing when the pot is removed. Circuit Breakers that trip when they are overloaded Overwrite protect tabs on disks
Error Proofing: Poka Yoke Example Visual cues . Often visual cues, in the form of templates, guides and color coding make it easier for the operator to complete  the procedure without making a mistake. The Clippard Valve Polylines Template, for example, guides the operator to correctly attach polylines to the assembly.
How could you use the tools to eliminate the waste  you’ve identified? Suggest other ways to eliminate waste automation? reorganizing departments? make different staffing decisions? etc. Eliminating Waste in the Process
Lean Principle #4 Produce only what is pulled by the customer.
Examples of customer pull signals Kanban Alarm! Phone Call Andon Purchase Order
Lean Principle #5 Pursue perfection by continuously  improving
Kaizen “ Zen” (For the Good) = Continuous Improvement “ Kai” (Change) +
Kaizen Rules K eep an open mind to change A lways maintain a positive attitude I nvolve everyone in the activity Z ero blame!  Fix the problem instead E ach member has an equal vote N ever leave in silent disagreement R esults should be publicly displayed U nderstand the thought process L earn by taking action E xercise mutual respect. Work together S hare the successes
Kaizen Team Upper Management support  extremely critical  to success Usually 6 to 8 members Include or consult with customers (both internal and external) of the process Should have representation from different levels in the company Always use an “extended” team member as a sanity check (Why?)
Kaizen Time Line Determine how much time it would take one (100% dedicated) person to complete the tasks Use commitment % per team member to determine the length of the kaizen Three major components of a kaizen Cost Time Manpower
SMART Goals Kaizen Team Goals must be: S pecific M easurable A ttainable R elevant T ime bound
Kaizen Process Identify Sustain Implement Define
Identify Wastes Takt time Plant layout & material flow Work sequence Cycle times Quality issues  Safety & Ergonomics Don’t forget to ask the 5 why’s
Define Opportunities for improvement Would plant layout changes eliminate waste? Is there any waste at any operation which  could be eliminated? Optimum staffing level Standard work sequences Standard WIP Quality checks Safety considerations
Implement Brainstorm for solutions Institute Standardized Work methodologies Get input and make improvements Document the new standard operation Train on new methods Design & install visual management systems Get management approval where needed
Sustain Adhere to the new process Continue to improve Visual controls Retrain after each improvement Management support & commitment Follow up, Follow up, Follow up
Sample Kaizen Project Summary
Sample Team Form
Kaizen Card-Example
7 Wastes Techniques Used
Kaizen Summary Upper Management support determines the path for success Conveys the intent of the kaizen and the deliverables at a glance Displays the expected benefits obtained by conducting an analysis on ROI (return on investment) Helps to determine whether it is feasible to continue with the kaizen
Identify the number of potential projects Identify the kaizen type for each project Determine return on investment (ROI) of each project to assist with prioritizing  cost and time investment for each project potential savings after improvement Kaizen Event Selection
Automate Routing Process Cost $ 10,000 programmers ($100/hr x 40 hrs) training Time to Implement - 3 months Savings $ 500,000/year labor materials defects cycle time (decreased from 116 to <6 hrs!) Implement Visual Controls Cost $300 new envelopes training Time to Implement - 3 weeks Savings $ 48,000/year labor cycle time defects   Kaizen Event Selection
Choose the team Write project summary & objectives “ to develop a process to automatically route data for signature to multiple users” Is it S M A R T ? Determine project timeline Collect baseline data Determine implementation strategy & tools Present results Audit   Kaizen Event Selection
SOE - Top Level
Upper and Lower Level SOE’s
Total Product Cycle Time- Product Sync TPCT =4950 Minutes  Longest Path Back
Balancing the Line
Accomplishments TPCT reduced from 15 days to 5 days (67%) Created 5 standardized Work Cells 4 Mixed Model feeders for identified parallel work Established Takt Time at 7.8 hrs Implementation of 2 bin kanban system FIFO material flow Standardized and structured the manufacturing process  (SOE) Operational Method Sheets for training Balanced the line
Traditional Situation  Managing Change Change Management's Attention Resistance 80 % Undecided Cooperation Reduced Resistance 30 % Undecided Increasing  Cooperation 10 % 10 % Managing Resistance to Change
Agenda Introduction Lean Thinking Lean Line Design Conclusion
Traditional Production Work order driven “push” system  Batch production Rework areas necessary to bring  finished goods up to quality standards Characteristics Results Poor Delivery Long/Inconsistent Cycle Times Customer Dissatisfaction Poor Quality Excessive Resources Excess Inventory / Liabilities Inflexible System Long Lead Times Capacity Constrained High Working Capital
Traditional  vs.  Lean Materials are purchased for “just-in-case” usage  Large-scale machines Functional layout Minimal skills Long production runs Massive inventories Development is isolated, with little input from production or customers Materials are pulled on a  just-in-time basis Human-scale machines Cell-type layout Multi-skilled workers One-piece flow Low inventories at point-of-use High input from customers, concurrent development of product and production process design
Traditional Production System PUSH SYSTEM Supplier Production and Finished Goods AMAT Forecast EDI OP OP OP OP OP OP OP OP Finished Goods Applied Materials Production Ship Work Pushes to  Next Operation AMAT
Traditional Production System Machine Paint Weld Pack & Ship Saw Push Push Push Push Poor On Time Delivery Poor Quality High/Inconsistent Cycle Times Long Lead Times Excess Inventory / Liabilities Capacity Constrained Imbalanced Operations Customer Dissatisfaction COMMON PROBLEMS
Lean Production System AMAT Forecast Supplier Production and Finished Goods EDI OP OP OP OP OP OP OP OP Finished Goods PULL Work is pulled as needed  by Next Operation Order Point Applied Materials Production AMAT PULL SYSTEM
Lean Production System Machine Paint Weld Pack & Ship Saw Lean Lean Lean Lean Pull Pull Pull Pull Improved OTD Improved Throughput Improved Quality Reduced Inventory Greater Flexibility Shorter Lead Times BENEFITS TOOLS Value Stream Mapping Pull System 5S Program  Visual Management
Lean Production System Production system which operates with much lower costs by focusing on: Elimination of  waste Process re-engineering Simple self managing systems   Crosses functional boundaries to rethink the entire production stream, including: Scheduling and planning Relationships with vendors Material & product delivery processes Layout & management of the processes
Pull   System Lean Enterprise Production & Quality Customer Order Pull Suppliers Suppliers Suppliers Suppliers Pull Pull Pull Pull Pull Pull Pull
Lean Production Journey Past F astest Delivery Highest Quality Lowest Cost Customer Response & Speed to Market In-Process & Customer Satisfaction  Inventory Space Overhead Future World Class
Lean Production Basics Establishing a Lean Flow Establishing Pull with Customers Continuously Improving
Reminder:  Lean Principle #3 Make products flow without interruption by eliminating waste Establishing a Lean Flow Waste Elimination Basic Production Elements + Line Design
Basic Elements of a Pull Production System -Reminder 5 S Philosophy Visual Controls Poke Yoke
Other Basic Elements of a  Pull Production System Total Productive Maintenance Set up reduction Tooling and Fixture Design Variability Reduction Ergonomics
Establishing a Lean Flow - Basic Elements   Ergonomics Safety  lifting practices and limits no slippery surfaces access/stack height of material Work station design tables and seating Tools hanging tools ergonomic design fixed storage locations Parts presentation gravity bins Adequate lighting, ventilation and noise control Motion economy
Establishing a Lean Flow - Basic Elements     Maintenance   Total Productive Maintenance  (TPM) Routine maintenance performance by the operator simple repairs daily thorough cleaning Preventive maintenance maintenance experts during reserved third shift  Calibration procedures (stickers part of visual controls) Life cycle management monitoring with SPC increasing life of equipment with good care
Establishing a Lean Flow - Basic Elements     Setup Reduction Single Minute Exchange of Dies (SMED) External  vs. internal setup Dynamic  vs. static  Quick disconnect fittings on test fixtures Specialized tools to perform a specific job
Establishing a Lean Flow - Basic Elements     Tooling and Fixture Design Why special tools and fixtures? safety  reduce the level of human effort required improve quality Sourcing commercially available modified commercially available fully customized design
Establishing a Lean Flow - Basic Elements     Variability Reduction Process capability studies how does the natural variation of the process output compare to specification limits? Statistical process control  has the process shifted based on sample output? Quality control charting techniques facilitates investigation into causes so that actions can be taken to improve the process. cause and effect (fish bone) diagram, Pareto charts, etc.
Establishing a Lean Flow     World Class Lean Production Waste Elimination Basic Production System Elements + Line Design
Lean Process Design Start Here Operations Balance In-process Kanbans Flexible employees Materials Kanbans Operational Method Sheets
Establishing a Lean Flow Product Synchronization Product Synchronization: Grouping products on a production line according to similar processes. Assembly 1 Test Box Assembly 2 Assembly 3 Assembly 4 Repair Sub 1 Sub 2 SP Test
Establishing a Lean Flow Product Synchronization Process Map:  A matrix of information, process names across the top and product names along the side, that is used to see commonality among products being considered for the same mixed model production line. Process Map Model A Model B Model C A1 Sub1 A2 A3 Sub 2 A4 Sp Test Rep Test Box
Establishing a Lean Flow   Process Types Sequential Assembly Test Post-test Assembly Box
Establishing a Lean Flow   Process Types Option Assembly 1 Test Box Assembly 2 Post-test Assembly
Establishing a Lean Flow   Process Types Feeder Assembly Test Post-test Assembly Box Test Sub-assembly
Establishing a Lean Flow   Process Types Spur Assembly Test Post-test Assembly Box Spare Boxing
Establishing a Lean Flow   Process Types Rework Assembly 1 Test Box Assembly 2 Repair
Example Product Synchronization:  RF Match Assembly Sub-Assy DMR (Rework) Setup PVD/Etch/Tung/MxP CVD CVD Burn-In Shipping Customer Returns Pre-Test PVD/Etch/Tung/MxP TPCT  = 338.75 min = (5.65 hours) 21.5 min 16.75 min 19.75 min 157 min 41 min 20 min 82.75 min Calibration
Lean Line Design Operations SOE Balance IPKB Flexible Employees Material Kanbans
Sequence of Events (SOE)  A document that contains: A description of each step in the process. Time required for each step. Tools required for each step. Quality requirements for each step.
Establishing a Lean Flow  Define the Work in the Process Sequence of Events (SOE) Product: Model B Seq. Task Time Type VA Quality 1.0 Unwrap face plate 32.0 SL Check for Scratches 2.0 Insert four screws, 44.0 RL • Window at upper left attaching to main unit 3.0 Test 51.0 RL Pass/Fail 4.0 Move to next Op. 12.0 ML Type Codes: SL= Setup Labor SM= Setup Machine RL= Req’d Labor RM= Req’d Machine ML= Move Labor MM= Move Machine Is it Value Added in the eyes of the customer? Work that will ensure quality
Upper and Lower Level SOE’s
Lean Line Design Operations TPCT Balance IPKB Flexible Employees Material Kanbans
Establishing a Lean Flow   Total Product Cycle Time (TPCT) The sum of work time along the longest path in the product synchronization TPCT = 160 30 50 20 10 20 20 30 40 70
Total Product Cycle Time- Product Sync TPCT =4950 Minutes  Longest Path Back
Lean Line Design Operations Demand Balance IPKB Flexible Employees Material Kanbans
Demand at Capacity (D c ) : The demand that will be used to design the line. It represents the line’s capacity without overtime. Daily Rate(D r ) : The average day’s rate of production, usually less than Demand at Capacity. The actual daily demand is used to calculate staffing requirements. Establishing a Lean Flow D c  = Demand at Capacity Get Average Daily Rate Planning Manufacturing Marketing 120% D c 50% D c D c D r Q1 Q2 Q3
Establishing a Lean Flow Effective Work Hours per Person 8 hours total work time? ?  hours for  production Breaks Cleaning Paperwork Projects Delays Vacation & Sick Training
Lean Line Design Operations Takt Balance IPKB Flexible Employees Material Kanbans
Establishing a Lean Flow   Takt The speed or rhythm of the production line, expressed in time per unit. A statistic representing total work time divided by total demand for the line. Takt Takt Takt Takt Takt = 1 min.   = 10 min.   = 60 min. (7.1 hrs. / shift) (60 min / hr) (1)  426 units / day (7.1 hrs. / shift) (60 min / hr) (1)  43 units / day (7.1 hrs. / shift) (60 min / hr) (1)  7 units / day Formula for Takt = (H s ) (# of Shifts) D c
Lean Line Design Operations Operations Balance IPKB Flexible Employees Material Kanbans
Establishing a Lean Flow   Operations Physical places to work on the Lean line. Each operation represent a portion of the work in the process. Operation 1 Operation 2 Operation 3 Examples 60 min. of work / 10 min. Takt = 6 ops. 8 hrs. work / 6 hrs. Takt = 2 ops Operation 4
Establishing a Lean Flow  Placement of the Operations Sequential whole whole whole whole whole Builds quality into the product whole Parallel (Bay Build) Checks quality after the product is complete 1/6 1/6 1/6 1/6 1/6 1/6
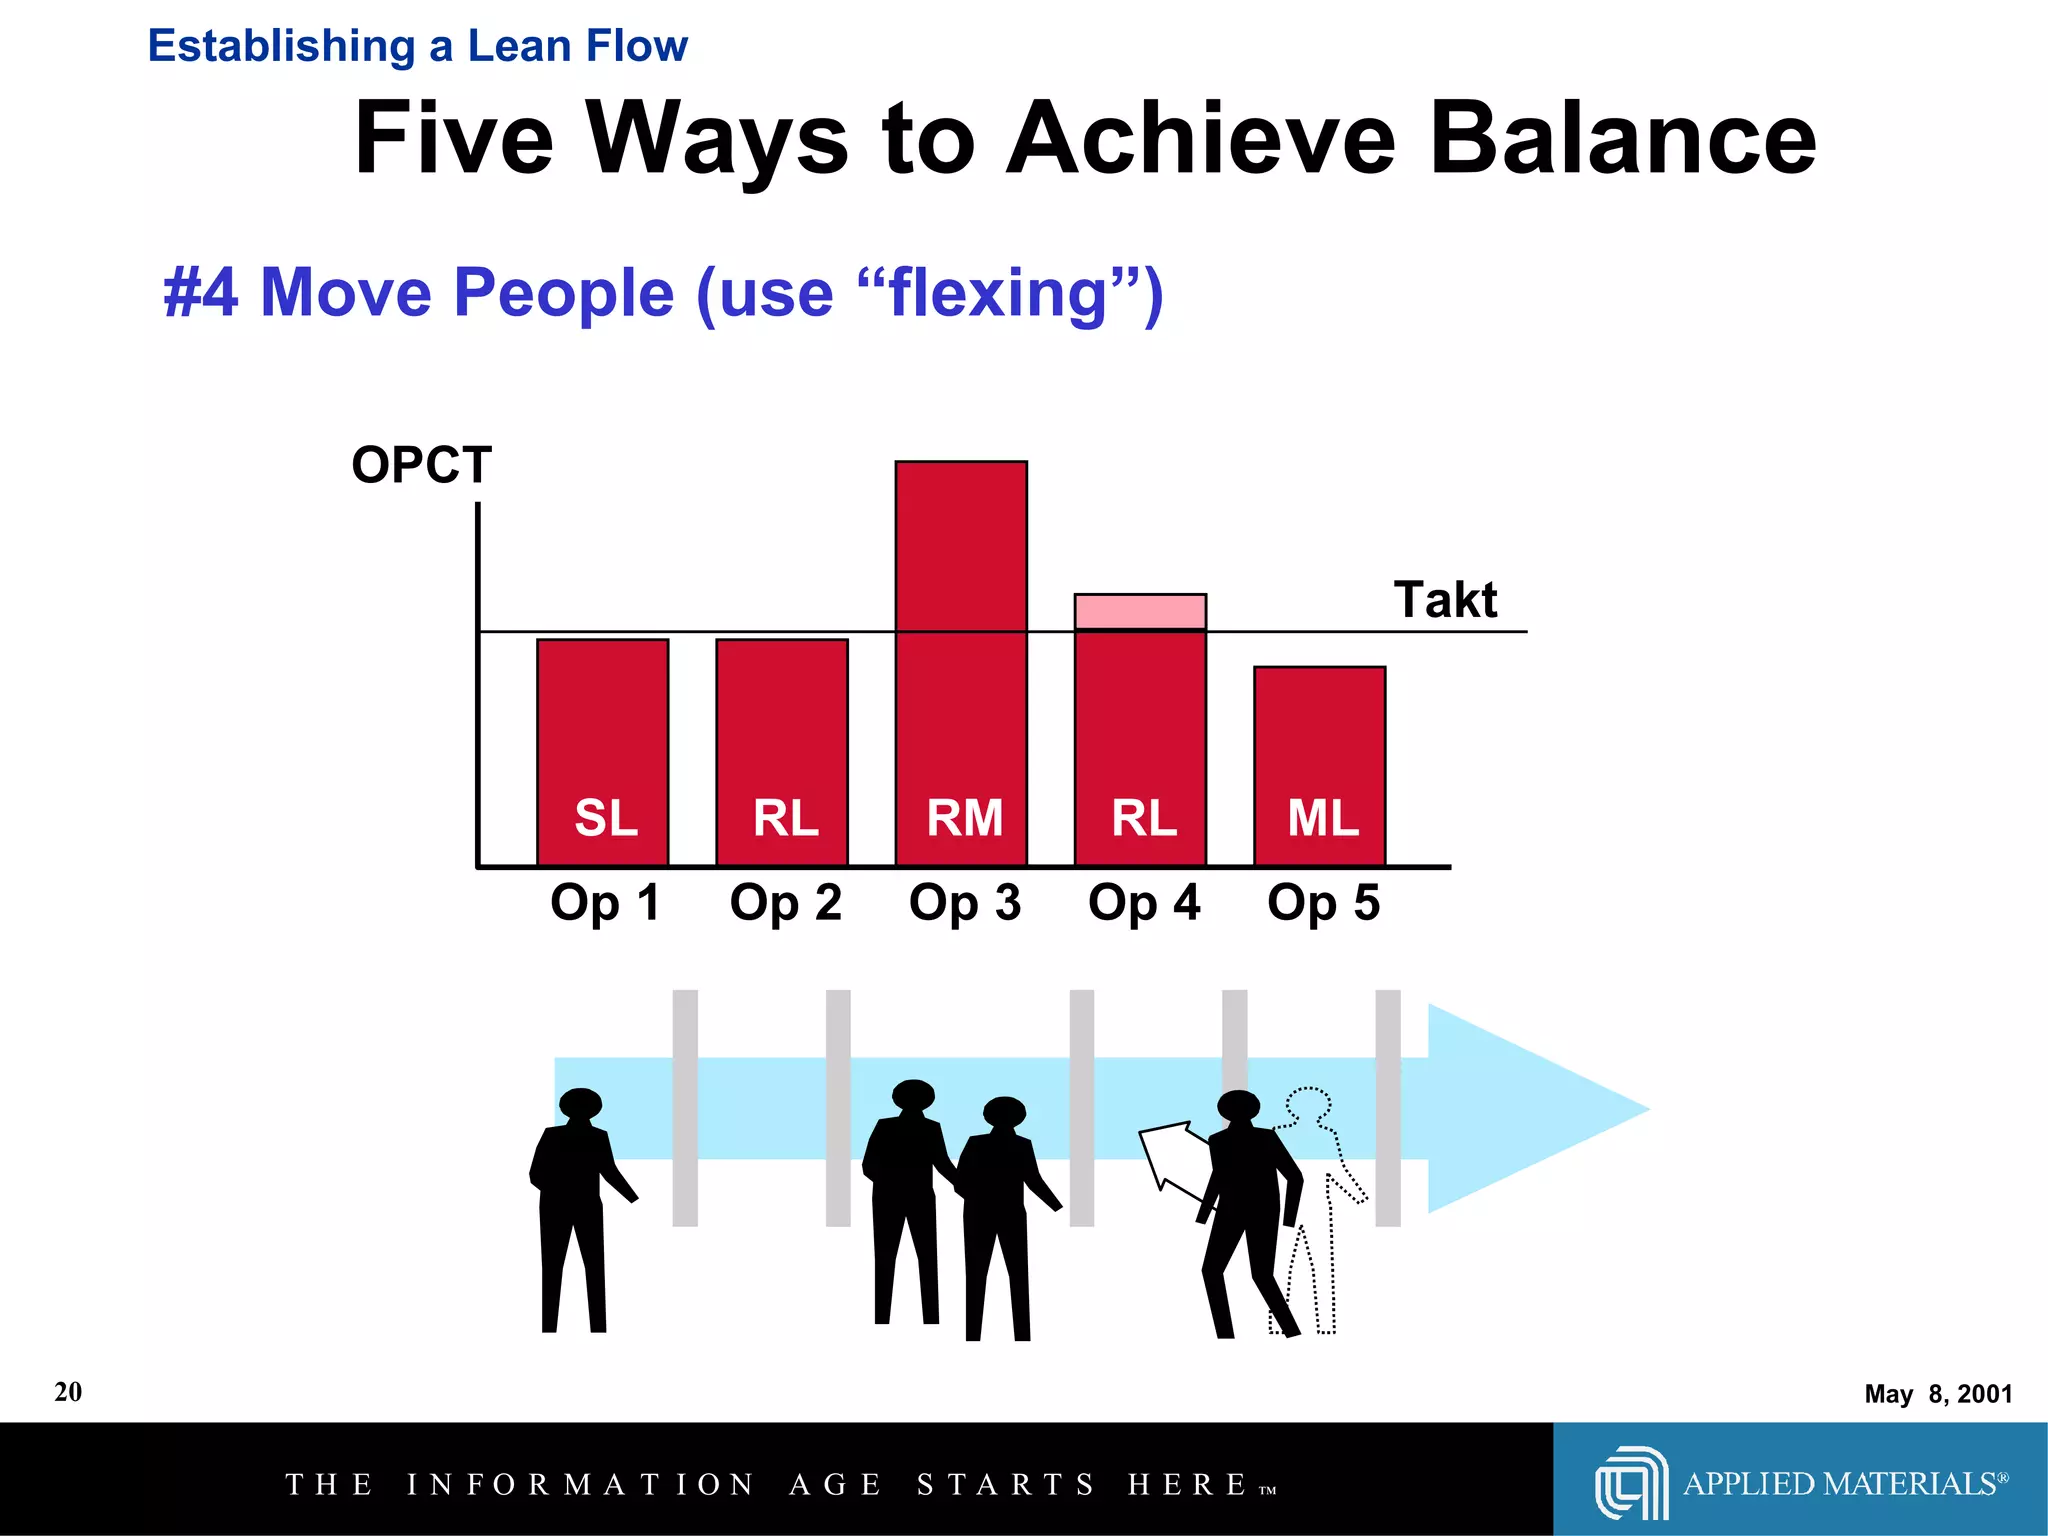
Establishing a Lean Flow   Balance Operational Cycle Time (OPCT) is the time each operation takes start to finish. The target for OPCT is Takt. Balance is the relationship between Takt and OPCT. An imbalanced operation is one that has cycle time in excess of Takt. Takt Takt Takt Takt Takt Takt SL RL RM RL ML Op 1 Op 2 Op 3 Op 4 Op 5 OPCT
  Sequence of Events (SOE) Product: Model B  Process: Assembly 2 Establishing a Lean Flow   Five Ways to Achieve Balance Seq. Task Time   Type   VA   Quality 1.0 Unwrap face plate 32.0   SL   Check for Scratches 2.0 Insert four screws, 44.0   RL   X  Window at upper left   attaching to main unit 3.0 Test 51.0   RL Pass/Fail 4.0 Move to next Op. 12.0   ML #1 Eliminate Work Setup & move Eliminate as many non-value add tasks as possible Low value add tasks
#2 Move Work Establishing a Lean Flow Five Ways to Achieve Balance Takt SL RL RM RL ML Op 1 Op 2 Op 3 Op 4 Op 5 OPCT
#3 Add People or Machines Establishing a Lean Flow Five Ways to Achieve Balance Takt SL RL RM RL ML Op 1 Op 2 Op 3 Op 4 Op 5 OPCT Machine 1 Machine 2 Takt Takt Takt
#4 Move People (use “flexing”) Establishing a Lean Flow Five Ways to Achieve Balance Takt SL RL RM RL ML Op 1 Op 2 Op 3 Op 4 Op 5 OPCT
#5 Rely on Overtime & Inventory First Shift Overtime / Second Shift Establishing a Lean Flow Five Ways to Achieve Balance Takt RL Op 5 OPCT
Establishing a Lean Flow   Operational Method Sheet (OMS) Operational Method Sheets are simple, graphic, color-coded work instructions used on the Lean Manufacturing line instead of engineering drawings and bills of material. EC# 12345 OP# 123 REV. A PG# 1 of 10 P/N 0250-12345 TITLE: Smoke Sensor Assembly APPLIED  MATERIALS Information contained in this document is considered by  Applied Materials to be confidential and is not to be used in  any manner without the consent of Applied Materials. TQC VERIFY WORK PART DESCRIPTION SEQ FIND QTY TASK DESCRIPTION TQC/TOOLING PART # 6 1 2 4 3 5 270 1 Check label orientation 275 2 Loosen screws 280 3 0150-20764 System Controller Smoke Sensor Cable  Assembly 1 Strip wires from C/A & insert in matching slots  on Sensor 300 4 Tighten screws 400 5 Verify wires are securely in place 410 6 Replace top of Sensor & secure with wire clip YELLOW indicates the WORK CONTENT to  be performed by the current production employee Work to be  VERIFIED by the  production employee  that performed the  work is coded BLUE RED indicates the TQC  (Touch Quality Check.)  A  TQC is the current  production employee  verifying the previous work  content done by another  employee
Lean Line Design Operations Flexible Employees Balance IPKB Flexible Employees Material Kanbans
Establishing a Lean Flow   Employee Certification Orientation Trainee Certified Master Skill Diversity Chart Operations Line #: 3 P5000 Robot Team Members A1 A2 A4 A5 A6 A7 Dave Thomas Brian Roy Pat Wilson Greg Watkins Pete Wilson
Establishing a Lean Flow   Flexible Employees Flexing is the movement of employees who are trained and certified in different parts of the process.  At a minimum, employees should be trained “one-up” and “one-down.” On most days, the number of operations will not equal the number of employees on the line D c Q1 Q2 Q3
Lean Line Design Operations Material Kanbans Balance IPKB Flexible Employees Material Kanbans
Reminder:  Lean Principle #4 Produce only what is pulled by the customer A ‘pull signal’ acts as a request for someone to: Produce Replenish The signal -which is really a customer  demand - can provide information on: When How many What kind Establishing Pull with Customers
Establishing Pull     Kanban:  Communication Signal In-Process Kanbans = Signal for Work
Establishing Pull     In-Process Kanbans Add Queue Time When will you be finished? You are here 3 minute process
Establishing Pull     In-Process Kanbans Represent  Inventory Money spent ahead of time Space needed to store product Rework, obsolescence, damage possible
Establishing Pull     Things to Know About Kanbans A full kanban does NOT need a new limit A kanban should NOT always be full, it is a signal to build. Kanbans can and will cause a line stopper. When the kanban is full  you  can... Flex Housekeeping DMR Scrap tickets Training ? ? ? ?
Establishing Pull   Material Pull Raw & In-Process Material (RIP)  - All parts that are kept in the resupply area or on the production line. RIP Area Backflush Scrap Resupply Stores Transaction Resupply: A designated area within RIP used to replenish the line, or to hold those parts that are not kept on the line.
Establishing Pull     Material Replenishment Part No. Qty. Usage   Supply Stores RIP Area Resupply
Establishing Pull     Non-Replenish Materials Planning Stores Kanban Card Part No. Qty. Usage Supply Non Replenish Unique Parts RIP Area Resupply Common Parts
Lean Process Design Start Here Operations Balance In-process Kanbans Flexible employees Materials Kanbans Operational Method Sheets
Reminder:  Lean Principle #5   Pursue perfection by continuously improving Continuous Improvement The Lean Production Basics and Lean Line Design  will always need to be revisited, as there will always be room for improvement!
BREAK TIME (15 MINUTES) LEGO ASSEMBLY WORKSHOP NEXT STEP
Establishing a Lean Flow - Workshop    LEGO ASSEMBLY 1.  Create a Product Synchronization diagram 2.  Conduct a Time Study and Develop SOE’s 3.  Calculate Total Product Cycle Time (TPCT) 4.  Calculate TAKT Time 5.  Balance the assembly flow line 6  Create a line layout diagram and indicate staffing at each operation (station). 7.  Share your results Workshop Objectives (Team effort):
Establishing a Lean Flow - Workshop    LEGO ASSEMBLY Given: 1.  Lego Model 2.  Operation Method Sheets (OMS’s) 3.  Demand at Capacity (Dc) 4.  Operation Constraints 5.  Line design formulas
Establishing a Lean Flow  Workshop     LEGO ASSEMBLY :  PRODUCT SYNCHRONIZATION DIAGRAM 1.   Draw a circle to represent each job step (reference OMS’s provided)   and write down a brief description. 2.  Connect the circles (job steps) in sequence using an arrow to represent    the process flow TPCT = _______ Step 1 2 3 4
Establishing a Lean Flow  Workshop     LEGO ASSEMBLY :  Sequence of Events 1.  List each task (reference the Product Synch), determine the time for   each task (job step) through time study work.  Seq. Task Time  Type VA Quality
Establishing a Lean Flow  Workshop     LEGO ASSEMBLY:  CALCULATE TAKT TIME    CALCULATE NUMBER OF STATIONS (OPERATIONS) Formula for Takt = (H s ) (# of Shifts) D c = = Given:  Dc = 852 Lego Assy’s per day Hs = 7.1 Hrs./shift  # of shifts = 1 Convert answer to seconds and plot  line on graph Hours Seconds =
Establishing a Lean Flow  Workshop     LEGO ASSEMBLY:  CALCULATE NUMBER OF STATIONS (OPERATIONS) Formula for Number of Stations = (TPCT)/Operators per Station = Note:  Use the same time units for TPCT  and TAKT Time in the formula. This is only a guideline, you still need to balance the line by grouping job steps to achieve a station time equal to or below the desired TAKT Time. Stations TAKT Time
LEGO ASSEMBLY:  LINE BALANCING 1.   Draw a horizontal line on the chart representing the TAKT time for the line. 2.  Draw a bar for each job step identified on the SOE’s, indicating the total time for each bar on the chart below. 3.  Draw a circle around a group of job step bars that will be grouped into a station (operation). 4.  For job step bars that exceed the TAKT Time line, indicate how that particular job step time will be reduced (ex. adding operators, process redesign, job step work breakdown, etc.)   Establishing a Lean Flow  Workshop
Establishing a Lean Flow  Workshop     LEGO ASSEMBLY:  LINE BALANCING Job Task Descriptions Time Scale
Establishing a Lean Flow - Workshop     LEGO ASSEMBLY:  LINE LAYOUT Use a square to represent one station Use arrows to show assembly flow Show material  and operator placement Make suggestions for line improvements TAKT Time = ____________ TPCT =  ____________ # Stations = ____________ # Operators = ___________ Capacity = ____________
Wrap Up Where Do We Go From Here? Course evaluations
Where to go from here… Lean Fundamentals Materials Lean Production Basics Kaizen Workshop Poka-yoke Design for Manufacturability Systems Thinking Project Management Program Management Concurrent Engineering Lean  Line  Design

Lean Fundamentals And Line Design 06 04 01

  • 1.
    Lean Fundamentals LeanSupplier Association - Austin May/2001 WELCOME!
  • 2.
    Agenda Introduction LeanThinking Lean Line Design Conclusion
  • 3.
    Agenda Introduction LeanThinking Lean Line Design Conclusion
  • 4.
    Influences That TriggerChange high cost of manufacturing fluctuations in demands rapid growth in size & revenue tighter quality standards highly configurable products long learning curves material shortages increased competition insufficient vendor capabilities inconsistent processes
  • 5.
    Industry Phases CostDrivers Simpler Designs Commonality Manufacturable Models Maintainability/Serviceability Economies of Scale Short Cycle Times Supply Chain Management Differentiation Cost Innovation
  • 6.
    Lean Manufacturing Progression1995 Benchmarking Training at JcIT Institute Pilot conversions on modules
  • 7.
    Lean Manufacturing Progression1995 1996 ‘ Lean Teams’ Formed Division Conversions Began Support Functions Re-design Began
  • 8.
    Lean Manufacturing Progression1995 1996 ULMI 1997
  • 9.
    Establishment of CommonProcesses for: - Manufacturing - Product development - Product management Improved Performance in: - Profitability - Quality - Cycle Time - Asset Management - Delivery Unified Lean Manufacturing Initiative
  • 10.
    Transitioning to aLean Enterprise
  • 11.
    Transitioning to aLean Enterprise
  • 12.
    Transitioning to aLean Enterprise
  • 13.
    Going Up fora Strategic View...
  • 14.
    What It Meansto be a Lean Enterprise? Products Processes Individuals Teams Organizations Functions The WHOLE Business System It Reaches across It Consists of Customers Suppliers Board of Directors Investors
  • 15.
    A LEAN enterprisefocuses on... A LEAN enterprise practices LEAN thinking! Eliminating non value-added activities throughout the enterprise Building an integrated product delivery process to meet changing needs of customers Supporting a fundamental change in management philosophy
  • 16.
    Characteristics of aLean Enterprise Processes are in place to capture the knowledge of customers (internal and external!) and their values All processes, systems and initiatives -including supplier partnerships- are aligned, to efficiently provide the right products to the right customers at the right time…. The entire product delivery process is flexible so the enterprise can respond quickly to changes Management of the business is based on metrics, and they are aligned at all levels to evaluate performance
  • 17.
    Agenda Introduction LeanThinking Lean Line Design Conclusion
  • 18.
    Lean Thinking... ...amentality that emphasizes doing those things, and only those things, that create or add value to what the customer is willing to pay for. If it doesn’t add value, it is WASTE !
  • 19.
    Principles of LeanThinking from Womack & Jones Lean Thinking Specify the value of each product and service from the customer’s perspective. Identify every step in the value stream to highlight waste. Make products flow without interruption by eliminating waste. Produce only what is pulled by the customer. Pursue perfection by continually improving.
  • 20.
    Lean Principle #1Specify the value of each product or service from the customers’ perspective.
  • 21.
    What is value?Value is the product or service which meets the customer’s requirements at a price he is willing to pay when he requests it. Value is providing the right product for the right price at the right time.
  • 22.
    Who’s the Customer?You will likely have multiple customers, and they change frequently! Anyone, internal or external, who requires a product or service Final consumer Boss/management Co-workers
  • 23.
    Lean Principle #2Identify every step in the value stream to highlight waste.
  • 24.
    Mappingout the Process 1. Identify all steps in the value stream, including an estimated duration. 2. Identify value add activities vs. waste: Value Added Necessary, but non-value added Non-value added 3. Indicate types of waste
  • 25.
    A Value Stream… consists of all activities and processes that are required to bring a specific product/service: from concept to design and engineering from raw materials to product launch from order-taking to scheduling from delivery to & support of the customer This means everybody , and everything that takes place to produce the product/service!
  • 26.
    Disconnected Processes Lostorders, Delays, Mistakes and Other failures that cost time, money and customers! Most processes are full of disconnects and bottlenecks where the process crosses departmental lines.
  • 27.
    Adding Value orWaste? Lean thinking distinguishes between those activities that are actually adding value to the product or service, and those activities that are not adding value. If it’s not adding value, it is WASTE !
  • 28.
    Waste Eliminating wasteis the greatest potential source of improvement in corporate profit, performance, and customer service. For most production operations: - 60% add no value at all - 35% are “necessary” activities, but don’t add value - only 5% of activities actually add value!
  • 29.
    Lean Flow Wastedisrupts the continuous flow to complete a product or process Processes or machines that take too long Inadequate training or staffing Lack of information and direction Bad quality or late arrival of materials Inventory and queues are usually symptoms of another problem
  • 30.
    Mappingout the Process 1. Identify all steps in the value stream, including an estimated duration. 2. Identify value add activities vs. waste: Value Added Necessary, but non-value added Non-value added 3. Indicate types of waste
  • 31.
    Value Stream MappingTool Value Stream is all the actions (both value added and non value added) currently required to bring a product through the main flows essential to every product
  • 32.
    Why Value StreamMapping is an Essential Tool Helps you to visualize the big picture, not just individual processes to improve the whole, not just optimizing the parts. Helps you to see the sources of waste in your value stream It forms the basis of a Lean Implementation Plan. It shows the linkage between the information flow and the material flow.
  • 33.
    Initial Value StreamMapping Steps Product Family Current-State Drawing Future-State Drawing Work Plan & Implementation
  • 34.
    Value Stream Improvement& Process Improvement Follow the product from beginning to end Draw visual representation of every process in the materials and information flows
  • 35.
  • 36.
  • 37.
    Information for aprocess data box “ The Big Four”: Number of product variations Cycle time (from 1 piece to the next) Changeover time Process Reliability Number of operators Scrap Rate Production batch size Working Time (minus breaks) Pack Size
  • 38.
    A Fictional ValueStream Map - An example of Lean Tools Total lead time
  • 39.
    A Fictional ValueStream Map -An example of Lean Tools Total lead time
  • 40.
    We need anext Lean Leap: Value Stream Management Focus on the entire value stream for product families. Make someone responsible for each product family: the Value Stream Manager. Ask them to create an accurate current state. Tell the traditional functions to support the VSMs.
  • 41.
    Using Five WhysRoot cause Problem Data gathering Problem clarification Why? Why? Why? Why? Why?
  • 42.
    Measurements Why measure?What to measure? Hierarchy of measurements Leading and lagging indicators Importance of adding a reference, benchmark, or standard Location for measurements Data and information Data collection and processing
  • 43.
    Measurements- WhyMeasure? You can manage if you can measure Offers a baseline for continuous improvement You will know if your efforts to improve are working Customer requirements demand it You can make decisions based on the information derived from the measurements Lean conversion Certification Pricing Etc.
  • 44.
    Measurements Toensure they will be effective and useful, determine: Which measures does the customer want? Which measures do you need to improve performance? Cycle time Quality Cost Productivity What information/results do you want to obtain? Remember: if the measure is not being used for decision making, ask “WHY ARE WE MEASURING THIS?” Caution: Measurements entail cost and effort!
  • 45.
    Measurements Determinehow the types and locations of the metrics are linked throughout the organization Identify the critical operations to determine where to start for the most cost effective improvements Create documented maps of the processes: Identify the inputs & outputs Set applicable standards for each critical step Show cause and effect relationships Disconnects will indicate missing or non value- adding measurements
  • 46.
    It all startswith a Hoshin Annual Operating Plan (AOP) ... A specific, measurable objective to achieve breakthrough results. Measurements
  • 47.
    The Aim ofHoshin Planning is to ... Align people, activities, and performance metrics throughout all levels of the organization with strategic priorities so the Company can achieve its corporate mission….
  • 48.
    Measurements Hoshins/AOP GoalsInventory Quality Cost Cycle Time Failure Internal/ External Appraisal Prevention Throughput Takt Operating Expenses
  • 49.
    Measurements- MeasureWhat? Hierarchy of Measurements Similar to Hoshin planning, define the hierarchy of measurements and show the cascading links between metrics at different levels of the company. Level 1: Earnings / Profitability, Customer satisfaction, On time delivery Level 2: Plant based metrics: scrap rates, returns, schedule… Level 3: Line based metrics: cycle time, yields, escapes... Plant 1 Plant 2 Company Line 1 Line 2 Line 3 Line 2 Line 1 Example: 3 Level System
  • 50.
    Cascading Objective ProcessLevel 1 Level 3 Level 2 Programs Division Corporation Hoshin Initiatives Corporate Objectives Strategies Business Unit Strategies Division Strategies Business Unit Business Unit Objectives Division Objectives
  • 51.
    Measurements- MeasureWhat? Have consistent definitions for whatever is being measured Know the difference between proactive and reactive: - Lagging - downstream indicators for use in preventing defects upstream (reactive) - Leading - upstream indicators for use in predicting quality downstream (proactive) Example: high reject rates (leading) can be an indication of poor profitability (lagging)
  • 52.
    Measurements- MeasureWhat? Measures have little meaning in isolation Comparison with a reference will add relevance In absence of a standard or benchmark, at least have a baseline to use for making comparisons Month Cycle Time Month Cycle Time Target
  • 53.
    Measurements- MeasureWhere? Most measurements are carried out too late; typically at the end of the process (lagging indicators) Such measurements are usually easy and convenient to install, but might be of little help in preventing problems Measuring as close as possible to the point of cause or occurrence is more pro-active (leading indicators) Implementing closed loop feedback and real time controls on the operations can actually prevent non-conformances from occurring in the first place Measurements are often started on every operation in the business, even if they aren’t the right ones!
  • 54.
    Measurements- Dataand Information Data is not always the same as information Information is that which can be used for decision making Information for one stage can be data for the next ---Data set 1 ---Data set 2 ---Data set 3 Information set 3 Information set 1 Information set 2 Processing Data set 4 Data set 5 Processing Supplier End Applied Materials End
  • 55.
    Measurements - DataCollection and Processing The metric is only as good as the integrity of the data collected Statistical treatment of data can add more power to analysis & decision making Presentation of information should be simple yet comprehensive, and it should be directly aimed at facilitating the decisions that are to be made Information should be made available in a timely manner to those who need it Cross check to see if the information is useful in the way it is intended to be
  • 56.
    Measurements - SummaryStart with what is important to the customer Remember that measurements are often lagging indicators Understand the process, the causes/effects, the inputs/outputs Develop the hierarchy of measurements to address gaps and redundancies Identify the critical points where measurements will make the biggest difference
  • 57.
    Measurements - SummaryUse measurements as leading indicators for the most proactive approach, and understand how they are linked to lagging indicators. Data integrity checks are important since it becomes the foundation for many decisions Presentation of information (rather than data) should be simple, comprehensive, and timely
  • 58.
    Mappingout the Process 1. Identify all steps in the value stream, including an estimated duration. 2. Identify value add activities vs. waste: Value Added Necessary, but non-value added Non-value added 3. Indicate types of waste
  • 59.
    Overproduction Waiting TimeTransportation Processing Inventory Motion Defects 7 Wastes
  • 60.
    Overproduction ProducingMore Than Needed Producing Faster Than Needed
  • 61.
    Wait Time Waitingfor signatures Watching machines or equipment run Keeping busy to avoid being idle Waiting for computers to process data Waiting for materials Waiting for someone w/ the right skill Waiting in traffic
  • 62.
    Transportation Sending materials/productlong distances Handling materials/paperwork multiple times Storing incoming material before it is used Returning unused materials Having multiple storage locations Routing documents to multiple signers
  • 63.
    Processing Processes that don’t do the entire job, or that do it incorrectly Poorly maintained equipment that produces poor quality Doing things manually instead of automatically Doing more than would be necessary
  • 64.
    Inventory Costof materials Cost and management of obsolete materials Space & equipment Interest charges Defects, rework Paperwork & documents in queue Inventory accounting
  • 65.
    Inventory Analogy Wait Time Defects Process Over Production Water Level = Inventory Level Boat = Production System Rocks = Hidden Problems (Uncovered as Inventory is Reduced)
  • 66.
    Motion Searchingfor tools or supplies Walking to multiple areas to accomplish a task Things located in random locations or not according to frequency of use Picking something up multiple times
  • 67.
    Defects ReworkScrap Lost work Time Sorting Warranty Costs Lost Customer Satisfaction Other intangibles (Typos?)
  • 68.
    Lean Principle #3Make products flow without interruption by eliminating waste.
  • 69.
    Tools & Techniques5Ss Poka-yoke Visual Controls 5 Whys Lean Enterprise
  • 70.
    5Ss: The Gatewayto Quality
  • 71.
    Benefits Gives theopportunity to provide creative input to how your workplace should be organized and laid out, and to how your work should be done Makes your workplace more a pleasant to work Makes your job more satisfying Removes many obstacles and frustrations in your work Helps you know what you are expected to do, and when and where you are expected to do it Makes it easier to communicate with everyone you work
  • 72.
    5Ss: The Gatewayto Quality 5 S Set in order Standardize Shine Sustain Sort
  • 73.
    Sort & Discard-ImplementationNo Value & Easy To Dispose Of Retain Some Value No Value But Costly To Dispose Of Dispose Immediately Actively Look For Best Customer Work Out Less Costly Method For Disposal Necessary Items Implement Next S Unnecessary Items
  • 74.
    Sort & DiscardBEFORE Sort & Discard AFTER Sort & Discard
  • 75.
    Sort & Discard Before After
  • 76.
    Set in OrderTo arrange necessary items in good order so that they are easily accessible for use There should be a home for everything and everything should be in its home 60 SECONDS RULE Everything should be able to be found & retrieved within 1 min.
  • 77.
    Set in Order-ImplementationUnnecessary Items Sort/Discard Frequently Used Sometimes Used Not Used But Must Be Kept Place Near To The Point of Use Place A Bit Distant To The Point Of Use Place Separately Necessary Items
  • 78.
    Set in Order-ToolsBENEFITS OF MOTION MAPPING BEFORE Workstation 100 Workstation 200 Parts Integration Integration AFTER Workstation 100 Parts Integration Workstation 200 Integration Parts
  • 79.
  • 80.
    Set in Order-ToolsFLOOR TAPING
  • 81.
    Set in Order-ToolsVisual Management - You can see the work status of the line - there is no work present at these stations
  • 82.
    Set in Order-ToolsCOLOR CODING
  • 83.
  • 84.
    Set in Order-ToolsPart Replenishment carts are color coded by particular route.
  • 85.
    Set in Order-ToolsSILHOUETTES /CUTOUTS
  • 86.
    Set in Order-ExampleMaterial Kanbans Tool Cutouts Bin Labels In Process Testing Kanban
  • 87.
    Shine/Inspect-Implementation Unnecessary ItemsSort/Discard Set in order Necessary Items Defect or Irregularity Found Instant Maintenance Requested Maintenance Shine/Inspect
  • 88.
    Shine/Inspect-Tools 1. DEFINEAREA OF RESPONSIBILITY Draw map of cleaning area 2. DISTRIBUTE RESPONSIBILITY Schedule cleaning to be done and people to do it Devote certain times exclusively to cleaning 3. DEFINE STANDARD Develop a cleaning/inspection checklist Establish a minimum requirement
  • 89.
    Shine/Inspect-Tools CHECKLISTS CheckingItem 5 S Checklist No unnecessary stock items or work in progress All machines & equipment are in regular use All jigs, fixtures and tools are in regular use All unnecessary items can be identified at a glance There are clear standards for eliminating excess 1 2 3 4 5 Seiri 1 2 3 4 5 Seiri Parts or Materials Machines & Equipment Jigs, Fixtures & Tools Visual Controls Standards for Disposal Visual controls used to fix location of all items within the workcenter Clear indications of max & min stock quantities Blue tape used to divide workcenter Jig and tool storage organized for ease of removal and return Score Evaluation Criteria Workcenter Name Out Of Cat Comp. By Date Score No. 1 2 3 4 Seiton Storage Labels Quantity Indicators Dividing Lines Jigs, Fixtures & Tools
  • 90.
    5S Organizer andImplementation Schedule
  • 91.
    Shine/Inspect-Tools SHELVES SHELVESSHELVES SHELVES SHELVES SHELVES INTEGRATION STATION 2 INTEGRATION STATION 1 MAPS SHELVES SHELVES SHELVES SUBASSEMBLY STATION 3 SUBASSEMBLY STATION 3 SUBASSEMBLY STATION 3
  • 92.
    Shine/Inspect-Tools Decide orderand frequency: daily, weekly, monthly SCHEDULE Seiri Sort/ Discard Seiton Arrange/ Order Seiso Clean/ Inspect Seiketsu Stand./ Improve Shitsuke Believe/ Discipline 5 S Category Task Responsibility Date To Complete Date Completed 5 S Schedule
  • 93.
    5 S Schedule- another example
  • 94.
    5 S Checklist- Example
  • 95.
  • 96.
  • 97.
    Standardize VIP TOURMONDAY TUESDAY THURSDAY … ...Not just when the boss is around
  • 98.
    Standardize THURSDAY MONDAYTUESDAY …… .Not just at the beginning of the week WEDNESDAY
  • 99.
    Standardize ...But asa regular function of your daily activities WEEK 1 WEEK 5
  • 100.
    Sustain PROMOTION ANDRECOGNITION PROGRAM Leadership Roles Establish a 5 S evaluation and promotion plan Organize 5 S inter-departmental competitions to sustain activities Periodically award groups and individuals implementing good 5 S practices Implementation Roles Conduct 5 S audits regularly Look for innovative and exceptional 5 S performance and bring to the attention of supervisors
  • 101.
    Sustain Ergonomic floormats for work areas. Material Kanbans Overhead signs designating area. Additional overhead task lights for ergonomic concerns. Parts off work surface and labeled. Designated location for desk equipment
  • 102.
    Tools & Techniques5Ss Poka-yoke Visual Controls 5 Whys Lean Enterprise
  • 103.
    Visual Controls Visualcontrols are intended to make things easy to understand at a glance
  • 104.
    Visual Controls 0060-04090 Qty 20 XYZ Line A, Op 30 50-46-23 DMR Shift Output Output Level (1/29 to date) Goal Credit Memo Debit Memo
  • 105.
    Visual Controls RedBins: DMR Parts A Flow Rack Yellow Bins: CES or low usage Parts Blue Bins: Regular Parts
  • 106.
    Visual Controls Buildstrust between Management and Employees. Creates a company culture where sharing is a key principle. Employees control the production line with minimum confusion for “What needs to be done” and maximum understanding of “How it must be done.&quot; Allows everyone to visually observe factory progress and expose inefficiencies. Toyota: When you make problems visual, it takes less people to solve them. “ A picture is worth a thousand words.”
  • 107.
    Visual Controls SomeConsiderations of Visual Management A few, not too many Easy to see Must get your attention Must have an effect on you Anyone can understand
  • 108.
    Visual Management: Display Boards Line #3 P5000 Robot Supervisor: John Glenn The Team: Dave Thomas Brian Roy Pat Wilson Greg Watkins Pete Wilson Lines Stops due to: (1/29 to date) Defective part Part shortage Accident Test fixture failure Tool failure Week # of Shortages Goal Quality Level (1/29 - 5/27) Shift Output Output Level (1/29 to date) Line Status Board Example Goal Pareto Chart (1/29 to date) Part Shortage # of Line Stops Defective Parts Test Fixture Failure Tooling Failure Accident
  • 109.
    Visual Management: Display Boards Orientation Trainee Certified Master Skill Diversity Chart Operations Line #: 3 P5000 Robot Team Members A1 A2 A4 A5 A6 A7 Adrian Castro Mike Depp Jorge Nakos Ricky Martin Eli Button
  • 110.
    Visual Management -Sequencing board is present on the floor for workers to see.
  • 111.
    Visual Management: Schedule Board
  • 112.
    Visual Example: Andon System Line Status Communication
  • 113.
    Visual Example: Andon System Line Status Communication Red: Work activity stopped due to a problem Yellow: Problem encountered, but no disruption of activity Andon: Japanese word for lantern Alert Buttons Andon Unit
  • 114.
    Andon System DataCollection Visual Signal located at the cell Light Flag Andon Metrics Sheet located at Cell can track: Issues and reason codes Corrective actions taken Repeat issues (pareto of part shortages, root cause) Amount of time andon light is on = workstation is down # of times per month or quarter - root cause Andon Escalation Procedure posted Who to contact, escalate Time based
  • 115.
  • 116.
  • 117.
    5S Tool DisplayYou can visually see the tools that are missing. Work station is color coded and labeled. Tool cutouts are present and tools are color coded.
  • 118.
    Visual Example: Kanban Signal to Build or Fill
  • 119.
    Before - WHSEShip and Receive
  • 120.
    After - Shippingand Receiving Non value added items removed Yellow tape indicates walk way Shipping is in designated and appropriate area Blue tape for designated cells and traffic flow Cells clearly marked Better traffic flow
  • 121.
    Tools & Techniques5Ss Poka-yoke Visual Controls 5 Whys Lean Enterprise
  • 122.
    Error Proofing: PokaYoke Poka yoke is a method aimed at designing a product, process or service where mistakes are prevented, or at least easily detected and corrected.
  • 123.
    Error Proofing: PokaYoke Poka Yoke is Japanese for Mistake Proofing. Poka Yoke differs from traditional inspection techniques that are problem detection oriented rather than problem prevention. The focus of Poka Yoke is on 100% inspection at the source rather than sample inspections at the end of a process or set of processes. Inspection at the source allows a process to be stopped when a nonconformity is present. The key to effective Poka Yoke is to target repetitive tasks and actions that require operator diligence, uncover the root cause of errors, and make it impossible to make a mistake.
  • 124.
    Error Proofing: PokaYoke A Few Everyday Examples Auto shut-off irons so we cannot make the mistake of leaving the iron on all day. Automatic sinks in public facilities so the water cannot be left on when someone walks away. Automatic toilets in public facilities so …….(well, you know) Coffee makers that stop brewing when the pot is removed. Circuit Breakers that trip when they are overloaded Overwrite protect tabs on disks
  • 125.
    Error Proofing: PokaYoke Example Visual cues . Often visual cues, in the form of templates, guides and color coding make it easier for the operator to complete the procedure without making a mistake. The Clippard Valve Polylines Template, for example, guides the operator to correctly attach polylines to the assembly.
  • 126.
    How could youuse the tools to eliminate the waste you’ve identified? Suggest other ways to eliminate waste automation? reorganizing departments? make different staffing decisions? etc. Eliminating Waste in the Process
  • 127.
    Lean Principle #4Produce only what is pulled by the customer.
  • 128.
    Examples of customerpull signals Kanban Alarm! Phone Call Andon Purchase Order
  • 129.
    Lean Principle #5Pursue perfection by continuously improving
  • 130.
    Kaizen “ Zen”(For the Good) = Continuous Improvement “ Kai” (Change) +
  • 131.
    Kaizen Rules Keep an open mind to change A lways maintain a positive attitude I nvolve everyone in the activity Z ero blame! Fix the problem instead E ach member has an equal vote N ever leave in silent disagreement R esults should be publicly displayed U nderstand the thought process L earn by taking action E xercise mutual respect. Work together S hare the successes
  • 132.
    Kaizen Team UpperManagement support extremely critical to success Usually 6 to 8 members Include or consult with customers (both internal and external) of the process Should have representation from different levels in the company Always use an “extended” team member as a sanity check (Why?)
  • 133.
    Kaizen Time LineDetermine how much time it would take one (100% dedicated) person to complete the tasks Use commitment % per team member to determine the length of the kaizen Three major components of a kaizen Cost Time Manpower
  • 134.
    SMART Goals KaizenTeam Goals must be: S pecific M easurable A ttainable R elevant T ime bound
  • 135.
    Kaizen Process IdentifySustain Implement Define
  • 136.
    Identify Wastes Takttime Plant layout & material flow Work sequence Cycle times Quality issues Safety & Ergonomics Don’t forget to ask the 5 why’s
  • 137.
    Define Opportunities forimprovement Would plant layout changes eliminate waste? Is there any waste at any operation which could be eliminated? Optimum staffing level Standard work sequences Standard WIP Quality checks Safety considerations
  • 138.
    Implement Brainstorm forsolutions Institute Standardized Work methodologies Get input and make improvements Document the new standard operation Train on new methods Design & install visual management systems Get management approval where needed
  • 139.
    Sustain Adhere tothe new process Continue to improve Visual controls Retrain after each improvement Management support & commitment Follow up, Follow up, Follow up
  • 140.
  • 141.
  • 142.
  • 143.
  • 144.
    Kaizen Summary UpperManagement support determines the path for success Conveys the intent of the kaizen and the deliverables at a glance Displays the expected benefits obtained by conducting an analysis on ROI (return on investment) Helps to determine whether it is feasible to continue with the kaizen
  • 145.
    Identify the numberof potential projects Identify the kaizen type for each project Determine return on investment (ROI) of each project to assist with prioritizing cost and time investment for each project potential savings after improvement Kaizen Event Selection
  • 146.
    Automate Routing ProcessCost $ 10,000 programmers ($100/hr x 40 hrs) training Time to Implement - 3 months Savings $ 500,000/year labor materials defects cycle time (decreased from 116 to <6 hrs!) Implement Visual Controls Cost $300 new envelopes training Time to Implement - 3 weeks Savings $ 48,000/year labor cycle time defects Kaizen Event Selection
  • 147.
    Choose the teamWrite project summary & objectives “ to develop a process to automatically route data for signature to multiple users” Is it S M A R T ? Determine project timeline Collect baseline data Determine implementation strategy & tools Present results Audit Kaizen Event Selection
  • 148.
    SOE - TopLevel
  • 149.
    Upper and LowerLevel SOE’s
  • 150.
    Total Product CycleTime- Product Sync TPCT =4950 Minutes Longest Path Back
  • 151.
  • 152.
    Accomplishments TPCT reducedfrom 15 days to 5 days (67%) Created 5 standardized Work Cells 4 Mixed Model feeders for identified parallel work Established Takt Time at 7.8 hrs Implementation of 2 bin kanban system FIFO material flow Standardized and structured the manufacturing process (SOE) Operational Method Sheets for training Balanced the line
  • 153.
    Traditional Situation Managing Change Change Management's Attention Resistance 80 % Undecided Cooperation Reduced Resistance 30 % Undecided Increasing Cooperation 10 % 10 % Managing Resistance to Change
  • 154.
    Agenda Introduction LeanThinking Lean Line Design Conclusion
  • 155.
    Traditional Production Workorder driven “push” system Batch production Rework areas necessary to bring finished goods up to quality standards Characteristics Results Poor Delivery Long/Inconsistent Cycle Times Customer Dissatisfaction Poor Quality Excessive Resources Excess Inventory / Liabilities Inflexible System Long Lead Times Capacity Constrained High Working Capital
  • 156.
    Traditional vs. Lean Materials are purchased for “just-in-case” usage Large-scale machines Functional layout Minimal skills Long production runs Massive inventories Development is isolated, with little input from production or customers Materials are pulled on a just-in-time basis Human-scale machines Cell-type layout Multi-skilled workers One-piece flow Low inventories at point-of-use High input from customers, concurrent development of product and production process design
  • 157.
    Traditional Production SystemPUSH SYSTEM Supplier Production and Finished Goods AMAT Forecast EDI OP OP OP OP OP OP OP OP Finished Goods Applied Materials Production Ship Work Pushes to Next Operation AMAT
  • 158.
    Traditional Production SystemMachine Paint Weld Pack & Ship Saw Push Push Push Push Poor On Time Delivery Poor Quality High/Inconsistent Cycle Times Long Lead Times Excess Inventory / Liabilities Capacity Constrained Imbalanced Operations Customer Dissatisfaction COMMON PROBLEMS
  • 159.
    Lean Production SystemAMAT Forecast Supplier Production and Finished Goods EDI OP OP OP OP OP OP OP OP Finished Goods PULL Work is pulled as needed by Next Operation Order Point Applied Materials Production AMAT PULL SYSTEM
  • 160.
    Lean Production SystemMachine Paint Weld Pack & Ship Saw Lean Lean Lean Lean Pull Pull Pull Pull Improved OTD Improved Throughput Improved Quality Reduced Inventory Greater Flexibility Shorter Lead Times BENEFITS TOOLS Value Stream Mapping Pull System 5S Program Visual Management
  • 161.
    Lean Production SystemProduction system which operates with much lower costs by focusing on: Elimination of waste Process re-engineering Simple self managing systems Crosses functional boundaries to rethink the entire production stream, including: Scheduling and planning Relationships with vendors Material & product delivery processes Layout & management of the processes
  • 162.
    Pull System Lean Enterprise Production & Quality Customer Order Pull Suppliers Suppliers Suppliers Suppliers Pull Pull Pull Pull Pull Pull Pull
  • 163.
    Lean Production JourneyPast F astest Delivery Highest Quality Lowest Cost Customer Response & Speed to Market In-Process & Customer Satisfaction Inventory Space Overhead Future World Class
  • 164.
    Lean Production BasicsEstablishing a Lean Flow Establishing Pull with Customers Continuously Improving
  • 165.
    Reminder: LeanPrinciple #3 Make products flow without interruption by eliminating waste Establishing a Lean Flow Waste Elimination Basic Production Elements + Line Design
  • 166.
    Basic Elements ofa Pull Production System -Reminder 5 S Philosophy Visual Controls Poke Yoke
  • 167.
    Other Basic Elementsof a Pull Production System Total Productive Maintenance Set up reduction Tooling and Fixture Design Variability Reduction Ergonomics
  • 168.
    Establishing a LeanFlow - Basic Elements Ergonomics Safety lifting practices and limits no slippery surfaces access/stack height of material Work station design tables and seating Tools hanging tools ergonomic design fixed storage locations Parts presentation gravity bins Adequate lighting, ventilation and noise control Motion economy
  • 169.
    Establishing a LeanFlow - Basic Elements Maintenance Total Productive Maintenance (TPM) Routine maintenance performance by the operator simple repairs daily thorough cleaning Preventive maintenance maintenance experts during reserved third shift Calibration procedures (stickers part of visual controls) Life cycle management monitoring with SPC increasing life of equipment with good care
  • 170.
    Establishing a LeanFlow - Basic Elements Setup Reduction Single Minute Exchange of Dies (SMED) External vs. internal setup Dynamic vs. static Quick disconnect fittings on test fixtures Specialized tools to perform a specific job
  • 171.
    Establishing a LeanFlow - Basic Elements Tooling and Fixture Design Why special tools and fixtures? safety reduce the level of human effort required improve quality Sourcing commercially available modified commercially available fully customized design
  • 172.
    Establishing a LeanFlow - Basic Elements Variability Reduction Process capability studies how does the natural variation of the process output compare to specification limits? Statistical process control has the process shifted based on sample output? Quality control charting techniques facilitates investigation into causes so that actions can be taken to improve the process. cause and effect (fish bone) diagram, Pareto charts, etc.
  • 173.
    Establishing a LeanFlow World Class Lean Production Waste Elimination Basic Production System Elements + Line Design
  • 174.
    Lean Process DesignStart Here Operations Balance In-process Kanbans Flexible employees Materials Kanbans Operational Method Sheets
  • 175.
    Establishing a LeanFlow Product Synchronization Product Synchronization: Grouping products on a production line according to similar processes. Assembly 1 Test Box Assembly 2 Assembly 3 Assembly 4 Repair Sub 1 Sub 2 SP Test
  • 176.
    Establishing a LeanFlow Product Synchronization Process Map: A matrix of information, process names across the top and product names along the side, that is used to see commonality among products being considered for the same mixed model production line. Process Map Model A Model B Model C A1 Sub1 A2 A3 Sub 2 A4 Sp Test Rep Test Box
  • 177.
    Establishing a LeanFlow Process Types Sequential Assembly Test Post-test Assembly Box
  • 178.
    Establishing a LeanFlow Process Types Option Assembly 1 Test Box Assembly 2 Post-test Assembly
  • 179.
    Establishing a LeanFlow Process Types Feeder Assembly Test Post-test Assembly Box Test Sub-assembly
  • 180.
    Establishing a LeanFlow Process Types Spur Assembly Test Post-test Assembly Box Spare Boxing
  • 181.
    Establishing a LeanFlow Process Types Rework Assembly 1 Test Box Assembly 2 Repair
  • 182.
    Example Product Synchronization: RF Match Assembly Sub-Assy DMR (Rework) Setup PVD/Etch/Tung/MxP CVD CVD Burn-In Shipping Customer Returns Pre-Test PVD/Etch/Tung/MxP TPCT = 338.75 min = (5.65 hours) 21.5 min 16.75 min 19.75 min 157 min 41 min 20 min 82.75 min Calibration
  • 183.
    Lean Line DesignOperations SOE Balance IPKB Flexible Employees Material Kanbans
  • 184.
    Sequence of Events(SOE) A document that contains: A description of each step in the process. Time required for each step. Tools required for each step. Quality requirements for each step.
  • 185.
    Establishing a LeanFlow Define the Work in the Process Sequence of Events (SOE) Product: Model B Seq. Task Time Type VA Quality 1.0 Unwrap face plate 32.0 SL Check for Scratches 2.0 Insert four screws, 44.0 RL • Window at upper left attaching to main unit 3.0 Test 51.0 RL Pass/Fail 4.0 Move to next Op. 12.0 ML Type Codes: SL= Setup Labor SM= Setup Machine RL= Req’d Labor RM= Req’d Machine ML= Move Labor MM= Move Machine Is it Value Added in the eyes of the customer? Work that will ensure quality
  • 186.
    Upper and LowerLevel SOE’s
  • 187.
    Lean Line DesignOperations TPCT Balance IPKB Flexible Employees Material Kanbans
  • 188.
    Establishing a LeanFlow Total Product Cycle Time (TPCT) The sum of work time along the longest path in the product synchronization TPCT = 160 30 50 20 10 20 20 30 40 70
  • 189.
    Total Product CycleTime- Product Sync TPCT =4950 Minutes Longest Path Back
  • 190.
    Lean Line DesignOperations Demand Balance IPKB Flexible Employees Material Kanbans
  • 191.
    Demand at Capacity(D c ) : The demand that will be used to design the line. It represents the line’s capacity without overtime. Daily Rate(D r ) : The average day’s rate of production, usually less than Demand at Capacity. The actual daily demand is used to calculate staffing requirements. Establishing a Lean Flow D c = Demand at Capacity Get Average Daily Rate Planning Manufacturing Marketing 120% D c 50% D c D c D r Q1 Q2 Q3
  • 192.
    Establishing a LeanFlow Effective Work Hours per Person 8 hours total work time? ? hours for production Breaks Cleaning Paperwork Projects Delays Vacation & Sick Training
  • 193.
    Lean Line DesignOperations Takt Balance IPKB Flexible Employees Material Kanbans
  • 194.
    Establishing a LeanFlow Takt The speed or rhythm of the production line, expressed in time per unit. A statistic representing total work time divided by total demand for the line. Takt Takt Takt Takt Takt = 1 min. = 10 min. = 60 min. (7.1 hrs. / shift) (60 min / hr) (1) 426 units / day (7.1 hrs. / shift) (60 min / hr) (1) 43 units / day (7.1 hrs. / shift) (60 min / hr) (1) 7 units / day Formula for Takt = (H s ) (# of Shifts) D c
  • 195.
    Lean Line DesignOperations Operations Balance IPKB Flexible Employees Material Kanbans
  • 196.
    Establishing a LeanFlow Operations Physical places to work on the Lean line. Each operation represent a portion of the work in the process. Operation 1 Operation 2 Operation 3 Examples 60 min. of work / 10 min. Takt = 6 ops. 8 hrs. work / 6 hrs. Takt = 2 ops Operation 4
  • 197.
    Establishing a LeanFlow Placement of the Operations Sequential whole whole whole whole whole Builds quality into the product whole Parallel (Bay Build) Checks quality after the product is complete 1/6 1/6 1/6 1/6 1/6 1/6
  • 198.
    Establishing a LeanFlow Balance Operational Cycle Time (OPCT) is the time each operation takes start to finish. The target for OPCT is Takt. Balance is the relationship between Takt and OPCT. An imbalanced operation is one that has cycle time in excess of Takt. Takt Takt Takt Takt Takt Takt SL RL RM RL ML Op 1 Op 2 Op 3 Op 4 Op 5 OPCT
  • 199.
    Sequenceof Events (SOE) Product: Model B Process: Assembly 2 Establishing a Lean Flow Five Ways to Achieve Balance Seq. Task Time Type VA Quality 1.0 Unwrap face plate 32.0 SL Check for Scratches 2.0 Insert four screws, 44.0 RL X Window at upper left attaching to main unit 3.0 Test 51.0 RL Pass/Fail 4.0 Move to next Op. 12.0 ML #1 Eliminate Work Setup & move Eliminate as many non-value add tasks as possible Low value add tasks
  • 200.
    #2 Move WorkEstablishing a Lean Flow Five Ways to Achieve Balance Takt SL RL RM RL ML Op 1 Op 2 Op 3 Op 4 Op 5 OPCT
  • 201.
    #3 Add Peopleor Machines Establishing a Lean Flow Five Ways to Achieve Balance Takt SL RL RM RL ML Op 1 Op 2 Op 3 Op 4 Op 5 OPCT Machine 1 Machine 2 Takt Takt Takt
  • 202.
    #4 Move People(use “flexing”) Establishing a Lean Flow Five Ways to Achieve Balance Takt SL RL RM RL ML Op 1 Op 2 Op 3 Op 4 Op 5 OPCT
  • 203.
    #5 Rely onOvertime & Inventory First Shift Overtime / Second Shift Establishing a Lean Flow Five Ways to Achieve Balance Takt RL Op 5 OPCT
  • 204.
    Establishing a LeanFlow Operational Method Sheet (OMS) Operational Method Sheets are simple, graphic, color-coded work instructions used on the Lean Manufacturing line instead of engineering drawings and bills of material. EC# 12345 OP# 123 REV. A PG# 1 of 10 P/N 0250-12345 TITLE: Smoke Sensor Assembly APPLIED MATERIALS Information contained in this document is considered by Applied Materials to be confidential and is not to be used in any manner without the consent of Applied Materials. TQC VERIFY WORK PART DESCRIPTION SEQ FIND QTY TASK DESCRIPTION TQC/TOOLING PART # 6 1 2 4 3 5 270 1 Check label orientation 275 2 Loosen screws 280 3 0150-20764 System Controller Smoke Sensor Cable Assembly 1 Strip wires from C/A & insert in matching slots on Sensor 300 4 Tighten screws 400 5 Verify wires are securely in place 410 6 Replace top of Sensor & secure with wire clip YELLOW indicates the WORK CONTENT to be performed by the current production employee Work to be VERIFIED by the production employee that performed the work is coded BLUE RED indicates the TQC (Touch Quality Check.) A TQC is the current production employee verifying the previous work content done by another employee
  • 205.
    Lean Line DesignOperations Flexible Employees Balance IPKB Flexible Employees Material Kanbans
  • 206.
    Establishing a LeanFlow Employee Certification Orientation Trainee Certified Master Skill Diversity Chart Operations Line #: 3 P5000 Robot Team Members A1 A2 A4 A5 A6 A7 Dave Thomas Brian Roy Pat Wilson Greg Watkins Pete Wilson
  • 207.
    Establishing a LeanFlow Flexible Employees Flexing is the movement of employees who are trained and certified in different parts of the process. At a minimum, employees should be trained “one-up” and “one-down.” On most days, the number of operations will not equal the number of employees on the line D c Q1 Q2 Q3
  • 208.
    Lean Line DesignOperations Material Kanbans Balance IPKB Flexible Employees Material Kanbans
  • 209.
    Reminder: LeanPrinciple #4 Produce only what is pulled by the customer A ‘pull signal’ acts as a request for someone to: Produce Replenish The signal -which is really a customer demand - can provide information on: When How many What kind Establishing Pull with Customers
  • 210.
    Establishing Pull Kanban: Communication Signal In-Process Kanbans = Signal for Work
  • 211.
    Establishing Pull In-Process Kanbans Add Queue Time When will you be finished? You are here 3 minute process
  • 212.
    Establishing Pull In-Process Kanbans Represent Inventory Money spent ahead of time Space needed to store product Rework, obsolescence, damage possible
  • 213.
    Establishing Pull Things to Know About Kanbans A full kanban does NOT need a new limit A kanban should NOT always be full, it is a signal to build. Kanbans can and will cause a line stopper. When the kanban is full you can... Flex Housekeeping DMR Scrap tickets Training ? ? ? ?
  • 214.
    Establishing Pull Material Pull Raw & In-Process Material (RIP) - All parts that are kept in the resupply area or on the production line. RIP Area Backflush Scrap Resupply Stores Transaction Resupply: A designated area within RIP used to replenish the line, or to hold those parts that are not kept on the line.
  • 215.
    Establishing Pull Material Replenishment Part No. Qty. Usage Supply Stores RIP Area Resupply
  • 216.
    Establishing Pull Non-Replenish Materials Planning Stores Kanban Card Part No. Qty. Usage Supply Non Replenish Unique Parts RIP Area Resupply Common Parts
  • 217.
    Lean Process DesignStart Here Operations Balance In-process Kanbans Flexible employees Materials Kanbans Operational Method Sheets
  • 218.
    Reminder: LeanPrinciple #5 Pursue perfection by continuously improving Continuous Improvement The Lean Production Basics and Lean Line Design will always need to be revisited, as there will always be room for improvement!
  • 219.
    BREAK TIME (15MINUTES) LEGO ASSEMBLY WORKSHOP NEXT STEP
  • 220.
    Establishing a LeanFlow - Workshop LEGO ASSEMBLY 1. Create a Product Synchronization diagram 2. Conduct a Time Study and Develop SOE’s 3. Calculate Total Product Cycle Time (TPCT) 4. Calculate TAKT Time 5. Balance the assembly flow line 6 Create a line layout diagram and indicate staffing at each operation (station). 7. Share your results Workshop Objectives (Team effort):
  • 221.
    Establishing a LeanFlow - Workshop LEGO ASSEMBLY Given: 1. Lego Model 2. Operation Method Sheets (OMS’s) 3. Demand at Capacity (Dc) 4. Operation Constraints 5. Line design formulas
  • 222.
    Establishing a LeanFlow Workshop LEGO ASSEMBLY : PRODUCT SYNCHRONIZATION DIAGRAM 1. Draw a circle to represent each job step (reference OMS’s provided) and write down a brief description. 2. Connect the circles (job steps) in sequence using an arrow to represent the process flow TPCT = _______ Step 1 2 3 4
  • 223.
    Establishing a LeanFlow Workshop LEGO ASSEMBLY : Sequence of Events 1. List each task (reference the Product Synch), determine the time for each task (job step) through time study work. Seq. Task Time Type VA Quality
  • 224.
    Establishing a LeanFlow Workshop LEGO ASSEMBLY: CALCULATE TAKT TIME CALCULATE NUMBER OF STATIONS (OPERATIONS) Formula for Takt = (H s ) (# of Shifts) D c = = Given: Dc = 852 Lego Assy’s per day Hs = 7.1 Hrs./shift # of shifts = 1 Convert answer to seconds and plot line on graph Hours Seconds =
  • 225.
    Establishing a LeanFlow Workshop LEGO ASSEMBLY: CALCULATE NUMBER OF STATIONS (OPERATIONS) Formula for Number of Stations = (TPCT)/Operators per Station = Note: Use the same time units for TPCT and TAKT Time in the formula. This is only a guideline, you still need to balance the line by grouping job steps to achieve a station time equal to or below the desired TAKT Time. Stations TAKT Time
  • 226.
    LEGO ASSEMBLY: LINE BALANCING 1. Draw a horizontal line on the chart representing the TAKT time for the line. 2. Draw a bar for each job step identified on the SOE’s, indicating the total time for each bar on the chart below. 3. Draw a circle around a group of job step bars that will be grouped into a station (operation). 4. For job step bars that exceed the TAKT Time line, indicate how that particular job step time will be reduced (ex. adding operators, process redesign, job step work breakdown, etc.) Establishing a Lean Flow Workshop
  • 227.
    Establishing a LeanFlow Workshop LEGO ASSEMBLY: LINE BALANCING Job Task Descriptions Time Scale
  • 228.
    Establishing a LeanFlow - Workshop LEGO ASSEMBLY: LINE LAYOUT Use a square to represent one station Use arrows to show assembly flow Show material and operator placement Make suggestions for line improvements TAKT Time = ____________ TPCT = ____________ # Stations = ____________ # Operators = ___________ Capacity = ____________
  • 229.
    Wrap Up WhereDo We Go From Here? Course evaluations
  • 230.
    Where to gofrom here… Lean Fundamentals Materials Lean Production Basics Kaizen Workshop Poka-yoke Design for Manufacturability Systems Thinking Project Management Program Management Concurrent Engineering Lean Line Design

Editor's Notes

  • #2 Key Points
  • #3 Key Points
  • #4 Key Points
  • #5 Key Points
  • #6 Key Points
  • #7 Key Points
  • #8 Key Points
  • #9 Key Points
  • #10 Key Points
  • #11 Key Points
  • #12 Key Points
  • #13 Key Points
  • #14 Key Points
  • #15 Key Points
  • #16 Key Points
  • #17 Key Points
  • #18 Key Points
  • #19 Key Points
  • #20 Key Points
  • #21 Key Points
  • #22 Key Points Our customers define value. Our customers’ values are constantly changing. We create value for our customers.
  • #23 Key Points Our customers define value. Our customers’ values are constantly changing. We create value for our customers.
  • #24 Key Points
  • #25 Key Points
  • #26 Key Points
  • #27 Key Points
  • #28 Key Points another approach is to ask the question: “ Does this make or save money ?” If not, it’s WASTE.
  • #29 Key Points Dept of Defense spends $1B in travel, and $2B administering it!
  • #30 Key Points
  • #42 Key Points
  • #47 Key Points
  • #48 Key Points
  • #51 Key Points
  • #60 Key Points
  • #61 Key Points
  • #62 Key Points
  • #63 Key Points
  • #64 Key Points
  • #65 Key Points … .only in America, do we buy hot dogs in packages of ten and buns in packages of eight!
  • #66 Key Points
  • #67 Key Points
  • #68 Key Points
  • #69 Key Points
  • #70 Key Points
  • #71 Key Points
  • #72 Key Points
  • #73 Key Points
  • #74 Key Points
  • #75 Key Points
  • #76 Key Points
  • #77 Key Points
  • #78 Key Points
  • #79 Key Points
  • #80 Key Points
  • #81 Key Points
  • #82 Key Points
  • #83 Key Points
  • #85 Key Points
  • #86 Key Points
  • #87 Key Points
  • #88 Key Points
  • #89 Key Points
  • #90 Key Points
  • #92 Key Points
  • #93 Key Points
  • #96 Key Points
  • #97 Key Points
  • #98 Key Points
  • #99 Key Points
  • #100 Key Points
  • #101 Key Points
  • #102 Key Points
  • #103 Key Points
  • #104 Key Points
  • #105 Key Points
  • #106 Key Points
  • #107 Key Points
  • #108 Key Points
  • #109 Key Points
  • #110 Key Points
  • #111 Key Points
  • #112 Key Points In the Navy: squid proof!
  • #113 Key Points In the Navy: squid proof!
  • #114 Key Points In the Navy: squid proof!
  • #118 Key Points In the Navy: squid proof!
  • #119 Key Points In the Navy: squid proof!
  • #122 Key Points
  • #123 Key Points In the Navy: squid proof!
  • #124 Key Points In the Navy: squid proof!
  • #125 Key Points In the Navy: squid proof!
  • #126 Key Points In the Navy: squid proof!
  • #128 Key Points Nothing is produced until the customer requests it. It is assumed that the producer has the ability to produce the product when the customer requests it.
  • #129 Key Points
  • #130 Key Points
  • #131 Key Points
  • #132 Key Points
  • #155 Key Points
  • #156 Emphasize the elimination of waste and reengineering the ENTIRE manufacturing system. Definition
  • #162 Emphasize the elimination of waste and reengineering the ENTIRE manufacturing system. Definition
  • #164 Emphasize the elimination of waste and reengineering the ENTIRE manufacturing system. Definition
  • #166 Key Points
  • #167 Each of the Production System Elements introduced here are too comprehensive to be taught within the context of this course. They are mentioned as complements to the Line Design section that follows. Consult the reference lists of books and existing Applied Materials courses at the back of this section for more complete information. Note that any improvement to a production system must be both effective and integrated with other elements of that production system. A matrix describing this integration is located at the back of this section. Basic Elements of a Production System
  • #168 Each of the Production System Elements introduced here are too comprehensive to be taught within the context of this course. They are mentioned as complements to the Line Design section that follows. Consult the reference lists of books and existing Applied Materials courses at the back of this section for more complete information. Note that any improvement to a production system must be both effective and integrated with other elements of that production system. A matrix describing this integration is located at the back of this section. Basic Elements of a Production System
  • #170 Total Productive Maintenance (TPM) means caring for equipment so often and so thoroughly that problems are non-existent. Abandon the goal of full 3-shift utilization of capital equipment. This equipment deserves our best care, not our worst. TPM focuses on spending money taking care of existing equipment. Down-time = $; but so does variability and bad quality. Maintenance (TPM)
  • #171 Reducing dynamic setup times or change-over time from one model to another. Single Minute Exchange of Dies (SMED) Reduce all factory setups 59/60ths (i.e., an hour to a minute to a second). Means of eliminating large lot sizes in production. This enables the production of many different models each day. Refer to Dr. Shigeo Shingo’s A Revolution in Manufacturing, The SMED System . External vs. Internal Setup External setup may be done with or without the machine running. Internal setup must be done with the machine stopped. External is preferred because it allows more time for processing parts. Dynamic vs. Static Dynamic setup is done per piece. Static setup is done for a run of many parts. Dynamic setup is preferred to allow for inventory benefits of running single piece production Setup Reduction
  • #172 Process improvement of this kind involve: identifying the need for tools and fixtures, and then processing the needed item. See Applied Material’s Special Tooling and Work Station Fixtures , by Ken Orr, for information on how to recognize the need for a tool/ fixture, what kind to procure, and the steps to acquire one. Richard Schonberger, author of World Class Manufacturing , recommends the following policy: Make your own equipment whenever possible Buy from the outside when you need advanced, state of the art expertise For the following reasons: It shortens lead time You can produce small capacity machines and add on for growth You can design for your specific needs You retain the expertise to keep improving and error-proofing your machine Tooling and Fixture Design
  • #173 Multiple volumes of Quality Control information are available on the market. The authors Joseph M. Juran and Dr. W. Edward Deming are good starting places for research. Variability Reduction
  • #174 In this first section of Lean Manufacturing, we have discussed: The need for Lean Manufacturing as a strategic initiative Seven wastes of Manufacturing Basic Production System Elements that define a World Class Manufacturing system. The remainder of this course will teach you how to convert existing production processes using a step-by-step line design technology. The result will be an effective and integrated improvement in your production system. Review
  • #175 Contents of the Line Design portion of this course are represented pictorially. The map can serve as a reminder of the steps required to set up a Lean Mfg. Process Development: “Working it out on paper” is an iterative effort. Setting up the Line: Definition of the physical line is part of it. In the background, the other part is generating work instructions called method sheets. Course Map
  • #176 Process Map The second part of a product synchronization, this matrix can be used to deternime which products should be mixed on the same product line. Process Map: A mix of information, process names across the top and product names along the side, that is used to see commonalty among products being considered for the same mixed model production line. Be Bold ! Mostly manual labor and relatively few parts can lead to successful high mix manufacturing. Question the existing process As you examine the details of the product synchronization, you have the opportunity to ask questions not usually asked. Remember this process is iterative so that it can be optimized early on. Product Synchronization
  • #177 Process Map The second part of a product synchronization, this matrix can be used to deternime which products should be mixed on the same product line. Process Map: A mix of information, process names across the top and product names along the side, that is used to see commonalty among products being considered for the same mixed model production line. Be Bold ! Mostly manual labor and relatively few parts can lead to successful high mix manufacturing. Question the existing process As you examine the details of the product synchronization, you have the opportunity to ask questions not usually asked. Remember this process is iterative so that it can be optimized early on. Product Synchronization
  • #178 Option Processes Dont’ confuse an optional part with an optional process. An optional process typically requires a product to be routed to a different location in order for work to be performed. An option part may still be assembled on the main line, not requiring the product to follow a different routing. Also, the term ”option” becomes relative to the group of products being built on the production line. For instance, if only model A in a mix model line requires a specific process, that process would be “optional” in the process flow, even though model A must have that work done to it. Feeder Processes A feeder process represents work being done at the same time as work in another process, parallel work. Spur Processes Products on a spur (typically spares and field units) do not re-enter the production line. As such, they are normally not considered in a TPCT calculation. Repair Processes A repair loop usually has a backward flow, but may not if the process preceding it doesn’t have to be repeated. In the upcoming discussion on demand, point out that yield and re-test considerations must be taken into account. Process Types
  • #179 Option Processes Dont’ confuse an optional part with an optional process. An optional process typically requires a product to be routed to a different location in order for work to be performed. An option part may still be assembled on the main line, not requiring the product to follow a different routing. Also, the term ”option” becomes relative to the group of products being built on the production line. For instance, if only model A in a mix model line requires a specific process, that process would be “optional” in the process flow, even though model A must have that work done to it. Feeder Processes A feeder process represents work being done at the same time as work in another process, parallel work. Spur Processes Products on a spur (typically spares and field units) do not re-enter the production line. As such, they are normally not considered in a TPCT calculation. Repair Processes A repair loop usually has a backward flow, but may not if the process preceding it doesn’t have to be repeated. In the upcoming discussion on demand, point out that yield and re-test considerations must be taken into account. Process Types
  • #180 Option Processes Dont’ confuse an optional part with an optional process. An optional process typically requires a product to be routed to a different location in order for work to be performed. An option part may still be assembled on the main line, not requiring the product to follow a different routing. Also, the term ”option” becomes relative to the group of products being built on the production line. For instance, if only model A in a mix model line requires a specific process, that process would be “optional” in the process flow, even though model A must have that work done to it. Feeder Processes A feeder process represents work being done at the same time as work in another process, parallel work. Spur Processes Products on a spur (typically spares and field units) do not re-enter the production line. As such, they are normally not considered in a TPCT calculation. Repair Processes A repair loop usually has a backward flow, but may not if the process preceding it doesn’t have to be repeated. In the upcoming discussion on demand, point out that yield and re-test considerations must be taken into account. Process Types
  • #181 Option Processes Dont’ confuse an optional part with an optional process. An optional process typically requires a product to be routed to a different location in order for work to be performed. An option part may still be assembled on the main line, not requiring the product to follow a different routing. Also, the term ”option” becomes relative to the group of products being built on the production line. For instance, if only model A in a mix model line requires a specific process, that process would be “optional” in the process flow, even though model A must have that work done to it. Feeder Processes A feeder process represents work being done at the same time as work in another process, parallel work. Spur Processes Products on a spur (typically spares and field units) do not re-enter the production line. As such, they are normally not considered in a TPCT calculation. Repair Processes A repair loop usually has a backward flow, but may not if the process preceding it doesn’t have to be repeated. In the upcoming discussion on demand, point out that yield and re-test considerations must be taken into account. Process Types
  • #182 Option Processes Dont’ confuse an optional part with an optional process. An optional process typically requires a product to be routed to a different location in order for work to be performed. An option part may still be assembled on the main line, not requiring the product to follow a different routing. Also, the term ”option” becomes relative to the group of products being built on the production line. For instance, if only model A in a mix model line requires a specific process, that process would be “optional” in the process flow, even though model A must have that work done to it. Feeder Processes A feeder process represents work being done at the same time as work in another process, parallel work. Spur Processes Products on a spur (typically spares and field units) do not re-enter the production line. As such, they are normally not considered in a TPCT calculation. Repair Processes A repair loop usually has a backward flow, but may not if the process preceding it doesn’t have to be repeated. In the upcoming discussion on demand, point out that yield and re-test considerations must be taken into account. Process Types
  • #183 An example of an Applied Materials production synchronization Product Synchronization
  • #186 Sequence of Events (SOE): A document that, for every product, describes the work and quality criteria for each process used to build that product. It is the basis for the remainder of line design and cannot be skipped. An SOE is an expansion of the Product Synchronization. Every product gets one, and it may be used in a new line as an interim work instruction. Don’t skip this step, it leads to TPCT, balance, defining operations. Sequence: Order counts in an SOE. Task: Define work in processes for each product. Time: Set a time standard. Type: classify work as setup, required, or move work done by labor or machine (SL, SM, RL, RM, ML, MM) Value-Added (VA) tasks: Work that increases the value or completeness of a product. Typical non-value-added tasks are setups, move work, and tests to catch manufacturing defects. Identify value-added work as seen through the eyes of the customer. A customer specified test may be value-adding, specified to catch manufacturing defects is not. Quality: Identify quality criteria of the product. Specify activities that will eliminate opportunity for a defect, An SOE also becomes part of the quality documentation. Sequence of Events (SOE)
  • #189 Total Product Cycle Time (TPCT): The sum of work time along the longest path in the product synchronization. Formula: P arallel work does not have to count in the calculation. Driver for overhead absorption: TPCT is recommended as the basis of Activity Based Costing (not direct labor) NOT Delivery Time: The name Total Product Cycle Time is misleading, in that it is not necessarily the time a customer could expect to wait once an order is placed. Step 3: Total Product Cycle Time TPCT =  SOE Time longest path
  • #192 Daily Demand Setting demand requires whole company involvement. Marketing, Planning, Manufacturing negotiate the capability of the production line. Daily Rate (D r ): The current day’s rate of production, usually less than Demand at Capacity. This is used to calculate staffing requirements. Demand at Capacity A rule of thumb is “Design to 20% over Daily Rate” Demand at Capacity (D c ): A daily demand that will be used to design the line. This represents the line’s capacity without overtime. This quantity should be set carefully. Step 4: Demand
  • #193 Effective Work Hours per Person Every person is probably paid 8 hours per day. Lunch is usually not-paid. Does every person work a full 8 hour day? What accounts for non-production time? Breaks Daily accrual of vacation/sick Assigned project time Delays Paperwork Group meetings Training Be aware of how much production time is expected of each employee when daily staffing plans are made. Follow through both individually and as a work team. Effective Work Hours
  • #195 Takt: The speed or rhythm of the production line, expressed in time per unit. The formula represents total work time divided by total demand for the line. Step 5: Takt
  • #197 Operations do NOT necessarily equal people. Only at demand at capacity (Dc) would the number of people coincide with the number of operations. (Discussed later with staffing) Operations
  • #198 You could set up your operations sequentially - so that the work is done as the product moves through the line. Or, you could do all the work at one operation, and duplicate that for the number of operations you have determined that you need to keep up with Takt. Why do we recommend Sequential? Shorter learning curves Quality is checked at more frequent intervals, before it’s completely built All parts must be duplicated All fixtures and tooling must be duplicated Operation Types
  • #199 Balance
  • #200 Go back to the SOE and look at ways to minimize or eliminate non-value-adding work. Improve efficiency of the work or reduce setup/move time. Five (and only five) ways to achieve balance #1 Eliminate Work
  • #201 Not all work will be easy to divide into near-Takt cycle times. But when possible, move longer operation work time to shorter operations. #2 Move Work
  • #202 Adding resources to do the same work, means each resources (person or machine) can individually operate slower, but still keep up with a faster paced line. #3 Add People or Machines
  • #203 It is possible resolve imbalances in the short term by moving people into a station or work area until balance is resolved. #4 Move People (“Flexing”)
  • #204 One operation can run longer that the rest of the line to resolve imbalance. Doing so means you need a place to accrue work, and place to put work that is completed during overtime. #5 Operation Overtime
  • #205 Operational Method Sheets
  • #207 A simple chart can be used by each workcenter to map the current skill diversity of its team members, as shown. The chart is a useful tool in monitoring improvements in skill diversity of the operators. The goal should be to achieve “Master” for each team member for all the workcenter operations. This can be achieved by continuous training, operator certification and job rotation. Display Boards
  • #208 Flexible Employees Certified/Cross-trained employees Flexible employees are employees certified in operations at, one up, and one down from their current position. In reality, an even broader range of cross training is preferred. Flexing: The movement of flexible employees on the Lean Manufacturing line. Often this is “one-up” or “one-down”, referring to one operation. When is Flexing required? In the following circumstances: • Running an understaffed line • Moving for balance • When kanbans signal it. Accepting flexing as part of the job Flexing goes against our territorial human natures. Understanding the reasons for it, see that it adds a level of interest to the work, and have a positive attitude. This will require practice.
  • #210 Key Points Nothing is produced until the customer requests it. It is assumed that the producer has the ability to produce the product when the customer requests it.
  • #211 Two Kinds of Kanban: In-process kanban Material kanbans First we’re going to discuss in-process kanbans. Signal for Work A lean manufacturing line has NO work orders, NO schedule. A Kanban is the signal to do work. (It is THE “Demand” of Demand Flow). It can be a space on the floor, a tray, a shelf, a tote, card, etc. . . Minimum Kanban The minimum kanban size is one. In-Process Kanbans = Signal for Work
  • #212 Queue Time While not at first intuitive, it soon becomes apparent in this example, that kanbans also represent queue time, or wait time, in the process (queue time being time other than TPCT). Deliver time = TPCT + kanban time Example: Delivery Time = (1 x 3 min.) + (6 x 3 min) = 21 min. In-Process Kanbans = Queue Time
  • #213 Inventory Costs of carrying inventory are usually the largest contributors to overhead costs (Space, taxes, people to count and track, lost opportunity, etc...). In a Lean Manufacturing line, kanbans ARE the Inventory. To minimize the cost, minimize the kanbans! For this reason, using operation overtime as a solution to imbalance is the least desirable solution. Maximum kanban limits A kanban limit is the maximum amount of material that may accrue in one shift/day as result of an imbalance. In-Process Kanbans = Inventory
  • #214 Things to Know about Kanbans A consistently full or over-full kanban is indicating imbalance. Adding more units to a kanban is like adding another oil light to your car if the first one comes on too often. A kanban limit is set based on how much material may need to accrue at some point during the work day. This does not mean the material should be there all day. Kanbans are supposed to shut the production line down when there’s a problem to prevent bad material from being produced. People can be re-deployed doing: Fixing the problem Work area cleanup Work-group meetings Process improvement documentation Projects Impromptu or formal training etc...
  • #215 Material going in RIP: All parts raw and in-process that are kept in the re-supply area or on the production line. A stock transaction takes place as material goes from a store room into RIP (Raw and In-Process inventory). No counting or transactions take place in RIP. It can be valued at half during inventory because everything in there is somewhere between full and empty. Never have suppliers deliver to the line, too risky! Resupply: A designated area for RIP parts not kept on the line. Vendor Deliveries Vendor to RIP deliveries are the goal, but should not be attempted until: Linearity 99%+ This is a description of how accurately your business predicts its demand. A plus or minus deviation is still a deviation. Vendor Delivery 99% If a Resupply area has about 2 days worth of parts in it, then you have less than two days to deal with a shortage on an order. Vendor Quality 99% For the same reason as above, quality must be high when vendors deliver to resupply. Raw/In-Process Material and Backflush (RIP)
  • #216 This kind of material kanban is used line to resupply, and resupply to stores/supplier. Single Card Kanbans Loop
  • #217 This type of material kanban is for one time demand. (Either CES materials, or low use option). It is the less desired method because it requires more planning, kanban maintenance, and scheduling. The trade off is in saving floor space on the line and reduced risk of obsolescence versus having to wait for the parts to be delivered. It is similar to kitting. Non-Replenish
  • #218 Contents of the Line Design portion of this course are represented pictorially. The map can serve as a reminder of the steps required to set up a Lean Mfg. Process Development: “Working it out on paper” is an iterative effort. Setting up the Line: Definition of the physical line is part of it. In the background, the other part is generating work instructions called method sheets. Course Map
  • #219 Key Points
  • #220 Key Points
  • #221 Process Flow
  • #222 Process Flow
  • #223 Keep it simple!! SOE
  • #224 Keep it simple!! SOE
  • #225 Keep it simple!! SOE
  • #226 Keep it simple!! SOE
  • #227 Keep it simple!! SOE
  • #228 Keep it simple!! SOE
  • #229 Process Flow
  • #230 Key Points
  • #231 Key Points