


![Difficulty and appropriateness parameters for
displaying the fish (initial placement, when the
flag is clicked (source))
• The appropriateness of the questions
decreased from 2021 to 2023.
• The difficulty level of the questions
is low throughout the years,
indicating that the questions are
simplified in terms of their contents.
Target(Appropriateness) 2021 2022 2023
Point it to [90] degrees 2.129 0.808 1.062
Set x-coordinate to [200]
and y-coordinate to [140]
2.232 2.083 1.050
Set the size to [50]%. 2.303 0.814 1.426
Display 2.172 1.447 1.337
Repeat until 1.270 0.884 1.202
Target(Difficulty) 2021 2022 2023
Point it to [90] degrees -0.947 -0.348 -1.237
Set x-coordinate to [200] and y-
coordinate to [140]
-1.141 -0.974 -1.249
Set the size to [50]%. -1.129 -0.355 -0.588
Display -0.783 -0.816 -0.621
Repeat until 0.291 -0.757 -0.021](https://image.slidesharecdn.com/random-250717155233-149f99cc/85/Learning-Tendency-Analysis-of-Scratch-Programming-Course-Entry-Class-for-Upper-Elementary-School-Students-Based-on-Bayesian-Item-Response-Theory-22-320.jpg)
![Difficulty and appropriateness parameter for until
the shark eats the fish (conditional loop, repeated
until (source))
• Both the difficulty and appropriateness of
the conditional statements (corresponding
to ‘while’ statements) until a fish is eaten
by a shark have similarly decreased toward
the year 2023.
• In 2022, the difficulty level of target
‘Touched [shark]’ was low, while that of
target ‘Go to [mouse pointer]’ tended to be
high.
Target(Appropriateness) 2021 2022 2023
Touched [shark]. 0.870 1.201 1.323
Go to [mouse pointer] 1.167 1.383 1.414
hide 2.135 1.592 0.857
Send [eaten] 2.144 1.050 0.920
Target(Difficulty) 2021 2022 2023
Touched [shark]. -0.261 -0.902 0.152
Go to [mouse pointer] 0.536 0.978 -0.028
hide 0.473 0.073 -0.561
Send [eaten] 0.462 -0.324 -0.496](https://image.slidesharecdn.com/random-250717155233-149f99cc/85/Learning-Tendency-Analysis-of-Scratch-Programming-Course-Entry-Class-for-Upper-Elementary-School-Students-Based-on-Bayesian-Item-Response-Theory-23-320.jpg)
![Difficulty and appropriateness parameter for the
case when fish escapes (conditional branch, when
[Tired] is received (source))
• Regarding the appropriateness of the problem, the target “Stop other scripts” is high only
for the year 2023.
• As for the difficulty level, it has been decreasing each year.
• In the case of the target “Says [I got away]”, both the appropriateness and the difficulty are
low throughout the year.
Target(Appropriateness) 2021 2022 2023
Stops other scripts 0.970 1.080 2.125
Says [I got away] 1.222 0.430 1.038
Target(Difficulty) 2021 2022 2023
Stops other scripts 0.787 0.514 -0.334
Says [I got away] -0.289 -0.352 -0.451](https://image.slidesharecdn.com/random-250717155233-149f99cc/85/Learning-Tendency-Analysis-of-Scratch-Programming-Course-Entry-Class-for-Upper-Elementary-School-Students-Based-on-Bayesian-Item-Response-Theory-24-320.jpg)
![Difficulty and appropriateness parameter for shark
placement and display (when flag is pressed (source))
The appropriateness of the questions is high throughout the year, and the difficulty level is
low, indicating that the questions are easy as a whole.
Target(Appropriateness) 2021 2022 2023
Set the rotation method to [Rotate Freely] 2.265 2.062 1.730
Set x-coordinate to [-200] and y-coordinate to [-150] 1.521 1.948 2.161
Set the size to [80]%. 2.319 1.356 2.133
Repeat [100] times <=Initial Setting! 2.140 1.387 1.861
Target(Difficulty) 2021 2022 2023
Set the rotation method to [Rotate Freely] -0.161 -0.521 -0.542
Set x-coordinate to [-200] and y-coordinate to [-150] -0.317 -0.510 -1.035
Set the size to [80]%. -0.161 0.078 -0.317
Repeat [100] times <=Initial Setting! 0.442 0.346 0.040](https://image.slidesharecdn.com/random-250717155233-149f99cc/85/Learning-Tendency-Analysis-of-Scratch-Programming-Course-Entry-Class-for-Upper-Elementary-School-Students-Based-on-Bayesian-Item-Response-Theory-25-320.jpg)
![Difficulty and appropriateness parameter for the shark
tracking a fish (finite loop, 100 iterations(source))
• Both difficulty levels are high and
somewhat difficult (medians of 0.275 and
0.488 for FY2022 and FY2023,
respectively), indicating that the content is
expected to be studied in the future.
• The overall difficulty level has been
decreasing from FY2021 to
FY2022~2023, and this trend is expected
to become stronger as the study
progresses.
Target(Appropriateness) 2021 2022 2023
Turning to [fish]. 1.607 1.408 1.406
Move [5] steps 1.919 1.665 1.522
Stop other scripts 2.077 1.979 1.772
Set costume to [shark-c] 2.031 1.694 2.255
Say [tired]. 1.612 2.096 2.229
Send [tired] 2.059 2.098 2.230
Target(Difficulty) 2021 2022 2023
Turning to [fish]. 0.721 0.510 0.334
Move [5] steps 0.717 0.342 0.514
Stop other scripts 0.731 0.646 0.689
Set costume to [shark-c] 0.689 0.488 0.545
Say [tired]. 0.951 0.626 0.534
Send [tired] 0.704 0.238 0.541](https://image.slidesharecdn.com/random-250717155233-149f99cc/85/Learning-Tendency-Analysis-of-Scratch-Programming-Course-Entry-Class-for-Upper-Elementary-School-Students-Based-on-Bayesian-Item-Response-Theory-26-320.jpg)
![Difficulty and appropriateness parameter when the
shark eats the fish (conditional branch, when
[eaten] is received (source))
• The appropriateness of the questions
increased significantly in the year
2023, while the level of difficulty was
the highest in the year 2021.
• The difficulty level is slightly higher
and has been increasing since the year
2022.
Target(Appropriateness) 2021 2022 2023
Stopping Other Scripts 1.519 0.538 2.252
Say [Tasty] 0.657 0.478 2.200
Target(Difficulty) 2021 2022 2023
Stopping Other Scripts 1.300 0.161 0.539
Say [Tasty] 0.984 -0.348 0.695](https://image.slidesharecdn.com/random-250717155233-149f99cc/85/Learning-Tendency-Analysis-of-Scratch-Programming-Course-Entry-Class-for-Upper-Elementary-School-Students-Based-on-Bayesian-Item-Response-Theory-27-320.jpg)
![Difficulty and appropriateness parameter for the
opening and closing of the mouth motion (infinite
loop) when the shark is tracking the fish.
• The difficulty level of the opening and
closing of the mouth of the shark is
generally high, but it seems to be
decreasing from 2021 to 2023.
• There are some high appropriateness
problems. The correctness level of
“Wait [0.1] second” remains high.
Target(Appropriateness) 2021 2022 2023
Always 0.818 0.367 1.203
Set costume to [shark-a] 1.422 1.005 2.064
Wait [0.1] seconds 1.877 2.459 2.071
Set costume to [shark-b] 0.961 1.457 0.810
Wait [0.1] seconds 1.939 2.384 1.996
Target(Difficulty) 2021 2022 2023
Always 0.840 0.326 0.158
Set costume to [shark-a] 0.965 0.897 0.539
Wait [0.1] seconds 1.292 0.359 0.724
Set costume to [shark-b] 0.601 0.497 0.236
Wait [0.1] seconds 1.218 0.382 0.713](https://image.slidesharecdn.com/random-250717155233-149f99cc/85/Learning-Tendency-Analysis-of-Scratch-Programming-Course-Entry-Class-for-Upper-Elementary-School-Students-Based-on-Bayesian-Item-Response-Theory-28-320.jpg)

![In this study, we analyzed and compared the data collected from the 2021~2023
school year through the upper elementary school student programming courses.
Parameters calculated based on the item response theory were checked and their
trends were discussed.
=> The results of the comparison of the parameters of learning proficiency from
2021 to 2023 and the level of learning proficiency has been improving year by
year.
=> The Entry Level practice questions are gradually becoming easier, as
demonstrated.
However, the questions ‘Shark chasing the fish (finite loop, repeated 100 times
(source))’, ‘When the shark eats the fish (conditional branch, when [eaten] is
received (source))’, and ‘Opening and closing of the mouth when the shark chases
the fish (infinite loop))’ are still somewhat difficult and the appropriate parameters
are high even in 2023(they are challenging and difficult questions).
30](https://image.slidesharecdn.com/random-250717155233-149f99cc/85/Learning-Tendency-Analysis-of-Scratch-Programming-Course-Entry-Class-for-Upper-Elementary-School-Students-Based-on-Bayesian-Item-Response-Theory-30-320.jpg)

Learning Tendency Analysis of Scratch Programming Course(Entry Class) for Upper Elementary School Students Based on Bayesian Item Response Theory
- 1. Learning Tendency Analysis of Scratch Programming Course(Entry Class) for Upper Elementary School Students Based on Bayesian Item Response Theory Ryota Kozakai1,2 AKKODiS Consulting .Ltd1 Nagoya City University, Graduate School of Science2 1
- 2. Background • Programming learning for elementary education has been consciously promoted since the revision of the Courses of Study in 2021 (Ministry of Education, Culture, Sports, Science and Technology 2021.) →Importance of training and supporting programming instructors. • The knowledge of elementary level mathematics, Data science, and AI are the “basic knowledge of digital society” that all university and technical college students should acquire by the year 2025 (FU Ru-De(2024)). → Importance of improving learning environments to acquire Data science and AI human capital. ※ Ministry of Education, Culture, Sports, Science and Technology, Courses of Study ‘The Power to Live’ , https://www.mext.go.jp/a_menu/shotou/new cs/index.html ※ FU Ru-De, A Study on Data Science Education for Arts Students: Based on Model Curricula and Accredited Programs, Bulletin of Kaichi International University, No. 23, pp. 5-24, 2024. 2
- 3. • Our company has been in the IT engineering technical instructor business for a long time. IT and engineering training including data science to improve skills for the temporary staffing business. Organized in-house Python study sessions and external lectures as a data science instructor. • Keep going with the course and do a survey to see how the students are doing and what the trends are. → To acquire information to assist in the development of teaching materials and teaching support . 3 Research Background
- 4. We analyzed the scoring results of program codes created in a Scratch programming course. Programming course was held in following conditions. Used text book : Junior Programming Proficiency Test textbook ↓ Difficulty level : Based on Entry-level examples from the Junior Programming Placement : Nagoya City University Date : July 15, 2021 (18 students), June 30, 2022 (19 students), and July 6, 2023 (20 students). 4 Research Purpose
- 5. • Sato (2023) describes a programming education support method related to Scratch. • Studies by Hideki Mori et al. (2010, 2011) and Makoto Nakazawa et al. (2016) have investigated the practical application of Scratch and its comprehension in order to analyze reasons for misunderstanding throughout the learning process. => This study uses Bayesian item response theory to investigate changes in learning ability and proficiency, as well as the appropriateness and difficulty of entry-level Scratch example problems from 2021. The results reveal upper elementary school students' current learning abilities and their level of understanding of code. ※ Sato Yukari(2023): Analyze JSON data to aid in learning Scratch programming, Shibata Gakuen Research Bulletin Vol.3 No.1, pp.13-24. ※ Hideki Mori, et al. Practical Study on Scratch Programming Lessons for Elementary School Students − Rethinking Programming Education at Elementery School 一 , Journal of the Japan Society for Educational Technology 34(4), pp. 387-394. ※ Hideki Mori(2010), Bringing Scratch Programming to Information Education for Arts Students, Journal of the Japan Society for Educational Technology 34(Suppl.), pp.141- 144. ※ Makoto Nakazawa et al.(2016), Learning Analytics via Visualization System of Edit Record ~ An Analysis of Learner's Thought Patterns for Elementary Programming Education using Scratch ~ , 78th National Convention Lecture Notes 2016(1), pp.531-532. 5 Related Works
- 6. The method of the Training Evaluation Analysis Model 6
- 7. The primary factors of model selection 7 As an analytical model used for training evaluation, we employ a proposed model based on Bayesian Item Response Theory. ✓Item Response Theory (IRT) has long been used as a fair method for test evaluation (Kato et al. (2014)), and it has been applied to English tests such as TOEIC as well as mathematics problems (Tsukihara et al.(2008), Ozaki et al.(2007)). ✓Bayesian IRT modeling enables analysis even with a small sample size (Oishi(2022)). ※Kato et al, Item Response Theory with R, Ohmsha, 2014. ※Tsukihara et al., A small implementation case of the mathematics tests with the Item Response Theory evaluation into an e-learning system, Computer & Education VOL24, pp.70-76, 2008. ※Ozaki et al., Time Trace Analysis of Basic Mathematical Ability Using Item Response Theory, Bulletin of Hachinohe Institute of Technology, Vol. 27, pp.61-67, 2007. ※Nobuhiro Oishi, Year-to-year Comparison of Small-scale Tests by Means of Bayesian IRT and Horizontal Equating, Kumamoto National College of Technology Research Bulletin No. 14, pp.24-27, 2022.
- 8. Proposed Model 8 The model of likelihood is(The number of participants is , The number of questions is .) , is the learning proficiency level, is the appropriateness of the question, and is the difficulty level, . In addition, . This probability show us 4 quadrants as follows. ① The question provides a certain degree of mastery, but it is difficult to obtain a high degree of mastery for the ability to learn (low appropriateness, low difficulty). ② difficult as a question but good for participants with high proficiency (high appropriateness and high difficulty) ③ inappropriate as a question (low appropriateness, high difficulty) ④ appropriate as a question and relatively easy (high appropriateness, low difficulty)
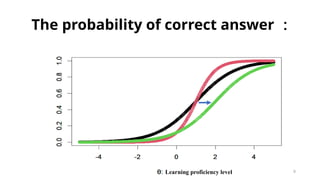
- 9. 9 The probability of correct answer : Learning proficiency level
- 10. Bayesian Modeling 10 Bayesian modeling is applied to this model. The prior distribution is . Therefore, the posterior distribution is obtained in the following form(. ).
- 11. The Method of Parameter Estimation 11 The Metropolis Hasting method was used as the computational algorithm for the analysis. In the Metropolis Hasting method, for a vector of parameters, the posterior sample is (where is the number of updates and k is the number of parameter clusters). Then, introducing the proposed distribution , sampling is performed and the adoption probability is and is adopted according to this probability. Otherwise, remains.
- 12. The Method of Parameter Estimation 12 Therefore, the proposal probabilities are as follows ( as well.). The initial values of , , are uniformly set to 2, 2, and 1, respectively. In the Metropolis Hasting method, the new parameter is replaced by the adoption probability, but this method causes extreme updates, which were seen as extreme as a learning method in the simulation results. Following calculation step improves the value of the logarithm of the posterior distribution better(γ=0.01, update for 20,000 calculations.).
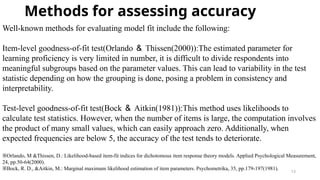
- 13. Methods for assessing accuracy 13 Well-known methods for evaluating model fit include the following: Item-level goodness-of-fit test(Orlando & Thissen(2000)):The estimated parameter for learning proficiency is very limited in number, it is difficult to divide respondents into meaningful subgroups based on the parameter values. This can lead to variability in the test statistic depending on how the grouping is done, posing a problem in consistency and interpretability. Test-level goodness-of-fit test(Bock & Aitkin(1981)):This method uses likelihoods to calculate test statistics. However, when the number of items is large, the computation involves the product of many small values, which can easily approach zero. Additionally, when expected frequencies are below 5, the accuracy of the test tends to deteriorate. ※Orlando, M &Thissen, D.: Likelihood-based item-fit indices for dichotomous item response theory models. Applied Psychological Measurement, 24, pp.50-64(2000). ※Bock, R. D., &Aitkin, M.: Marginal maximum likelihood estimation of item parameters. Psychometrika, 35, pp.179-197(1981).
- 14. Methods for assessing accuracy 14 Accordingly, we evaluated the model using the following methods: => Predictions were made by treating model probabilities of 0.5 or higher as true, and those below 0.5 as false. A confusion matrix was computed, and the data was determined not to be imbalanced. The predictive performance and learning accuracy of the data were evaluated based on the ROC curve and AUC.
- 15. FY2022(AUC : 0.89) FY2021(AUC : 0.96) FY2023 (AUC : 0.95) 15 Model Accuracy(ROC/AUC) FY2021/ 2022/2023 Correct answer (Predict) Incorrect answer (Predict) Correct answer (observed) 147/262/328 24/39/30 Incorrect answer (observed) 21/66/31 312/165/171
- 16. Model Accuracy(Information Function) 16 Evaluate the reliability of parameter . Probability of correct answer is defined by and the amount of item information for the entire test is defined by the information function . The standard error is able to calculate by the equation -1/2 power of The confidence interval of is . where is the 100% level point of the normal distribution. An estimator with a higher amount of item information and smaller confidence intervals is considered to be better. FY2021/2022/2023 Information function Standard Error Maximum 14.85/13.39/16.49 0.53/0.57/0.48 Minimum 3.6/3.1/4.33 0.26/0.27/0.25 The minimum values of information function are not very small, and the maximum values of standard error are small.
- 17. THE UNIDIMENSIONALITY OF THE ITEM RESPONSE THEORY 17 In order to show that only a single representing Scratch programming ability is included in the present study, we obtained a categorical correlation matrix and compared the results in terms of the magnitude of its eigenvalues. The results for the years 2021 to 2023 are as follows. The maximum eigenvalue is very high in comparison to the other eigenvalues. This means the unidimensionality of IRT.
- 18. Results and Discussion ( Learning Proficiency level ) 18
- 19. 19 The mean and median values have increased year by year. Notably, there was a significant improvement from fiscal year 2021 to 2022, which may be related to the introduction of programming as a compulsory subject for upper elementary school students starting in 2021. Trends in Learning Proficiency (Fiscal Years 2021–2023) FY2021 FY2022 FY2023 Median -0.251 0.275 0.488 Mean -0.602 0.281 0.486
- 20. Results and Discussion ( Appropriateness ・ Difficulty ) 20
- 21. Guidelines for Interpreting and Presenting Analytical Results ( Appropriateness ・ Difficulty ) 21 In the following, the results and discussion are presented based on the following 3 elements: • the target, which represents the goal of movement, • the sprite, which is the object that moves, and • the source, which supports behavioral decision-making.
- 22. Difficulty and appropriateness parameters for displaying the fish (initial placement, when the flag is clicked (source)) • The appropriateness of the questions decreased from 2021 to 2023. • The difficulty level of the questions is low throughout the years, indicating that the questions are simplified in terms of their contents. Target(Appropriateness) 2021 2022 2023 Point it to [90] degrees 2.129 0.808 1.062 Set x-coordinate to [200] and y-coordinate to [140] 2.232 2.083 1.050 Set the size to [50]%. 2.303 0.814 1.426 Display 2.172 1.447 1.337 Repeat until 1.270 0.884 1.202 Target(Difficulty) 2021 2022 2023 Point it to [90] degrees -0.947 -0.348 -1.237 Set x-coordinate to [200] and y- coordinate to [140] -1.141 -0.974 -1.249 Set the size to [50]%. -1.129 -0.355 -0.588 Display -0.783 -0.816 -0.621 Repeat until 0.291 -0.757 -0.021
- 23. Difficulty and appropriateness parameter for until the shark eats the fish (conditional loop, repeated until (source)) • Both the difficulty and appropriateness of the conditional statements (corresponding to ‘while’ statements) until a fish is eaten by a shark have similarly decreased toward the year 2023. • In 2022, the difficulty level of target ‘Touched [shark]’ was low, while that of target ‘Go to [mouse pointer]’ tended to be high. Target(Appropriateness) 2021 2022 2023 Touched [shark]. 0.870 1.201 1.323 Go to [mouse pointer] 1.167 1.383 1.414 hide 2.135 1.592 0.857 Send [eaten] 2.144 1.050 0.920 Target(Difficulty) 2021 2022 2023 Touched [shark]. -0.261 -0.902 0.152 Go to [mouse pointer] 0.536 0.978 -0.028 hide 0.473 0.073 -0.561 Send [eaten] 0.462 -0.324 -0.496
- 24. Difficulty and appropriateness parameter for the case when fish escapes (conditional branch, when [Tired] is received (source)) • Regarding the appropriateness of the problem, the target “Stop other scripts” is high only for the year 2023. • As for the difficulty level, it has been decreasing each year. • In the case of the target “Says [I got away]”, both the appropriateness and the difficulty are low throughout the year. Target(Appropriateness) 2021 2022 2023 Stops other scripts 0.970 1.080 2.125 Says [I got away] 1.222 0.430 1.038 Target(Difficulty) 2021 2022 2023 Stops other scripts 0.787 0.514 -0.334 Says [I got away] -0.289 -0.352 -0.451
- 25. Difficulty and appropriateness parameter for shark placement and display (when flag is pressed (source)) The appropriateness of the questions is high throughout the year, and the difficulty level is low, indicating that the questions are easy as a whole. Target(Appropriateness) 2021 2022 2023 Set the rotation method to [Rotate Freely] 2.265 2.062 1.730 Set x-coordinate to [-200] and y-coordinate to [-150] 1.521 1.948 2.161 Set the size to [80]%. 2.319 1.356 2.133 Repeat [100] times <=Initial Setting! 2.140 1.387 1.861 Target(Difficulty) 2021 2022 2023 Set the rotation method to [Rotate Freely] -0.161 -0.521 -0.542 Set x-coordinate to [-200] and y-coordinate to [-150] -0.317 -0.510 -1.035 Set the size to [80]%. -0.161 0.078 -0.317 Repeat [100] times <=Initial Setting! 0.442 0.346 0.040
- 26. Difficulty and appropriateness parameter for the shark tracking a fish (finite loop, 100 iterations(source)) • Both difficulty levels are high and somewhat difficult (medians of 0.275 and 0.488 for FY2022 and FY2023, respectively), indicating that the content is expected to be studied in the future. • The overall difficulty level has been decreasing from FY2021 to FY2022~2023, and this trend is expected to become stronger as the study progresses. Target(Appropriateness) 2021 2022 2023 Turning to [fish]. 1.607 1.408 1.406 Move [5] steps 1.919 1.665 1.522 Stop other scripts 2.077 1.979 1.772 Set costume to [shark-c] 2.031 1.694 2.255 Say [tired]. 1.612 2.096 2.229 Send [tired] 2.059 2.098 2.230 Target(Difficulty) 2021 2022 2023 Turning to [fish]. 0.721 0.510 0.334 Move [5] steps 0.717 0.342 0.514 Stop other scripts 0.731 0.646 0.689 Set costume to [shark-c] 0.689 0.488 0.545 Say [tired]. 0.951 0.626 0.534 Send [tired] 0.704 0.238 0.541
- 27. Difficulty and appropriateness parameter when the shark eats the fish (conditional branch, when [eaten] is received (source)) • The appropriateness of the questions increased significantly in the year 2023, while the level of difficulty was the highest in the year 2021. • The difficulty level is slightly higher and has been increasing since the year 2022. Target(Appropriateness) 2021 2022 2023 Stopping Other Scripts 1.519 0.538 2.252 Say [Tasty] 0.657 0.478 2.200 Target(Difficulty) 2021 2022 2023 Stopping Other Scripts 1.300 0.161 0.539 Say [Tasty] 0.984 -0.348 0.695
- 28. Difficulty and appropriateness parameter for the opening and closing of the mouth motion (infinite loop) when the shark is tracking the fish. • The difficulty level of the opening and closing of the mouth of the shark is generally high, but it seems to be decreasing from 2021 to 2023. • There are some high appropriateness problems. The correctness level of “Wait [0.1] second” remains high. Target(Appropriateness) 2021 2022 2023 Always 0.818 0.367 1.203 Set costume to [shark-a] 1.422 1.005 2.064 Wait [0.1] seconds 1.877 2.459 2.071 Set costume to [shark-b] 0.961 1.457 0.810 Wait [0.1] seconds 1.939 2.384 1.996 Target(Difficulty) 2021 2022 2023 Always 0.840 0.326 0.158 Set costume to [shark-a] 0.965 0.897 0.539 Wait [0.1] seconds 1.292 0.359 0.724 Set costume to [shark-b] 0.601 0.497 0.236 Wait [0.1] seconds 1.218 0.382 0.713
- 29. Conclusion 29
- 30. In this study, we analyzed and compared the data collected from the 2021~2023 school year through the upper elementary school student programming courses. Parameters calculated based on the item response theory were checked and their trends were discussed. => The results of the comparison of the parameters of learning proficiency from 2021 to 2023 and the level of learning proficiency has been improving year by year. => The Entry Level practice questions are gradually becoming easier, as demonstrated. However, the questions ‘Shark chasing the fish (finite loop, repeated 100 times (source))’, ‘When the shark eats the fish (conditional branch, when [eaten] is received (source))’, and ‘Opening and closing of the mouth when the shark chases the fish (infinite loop))’ are still somewhat difficult and the appropriate parameters are high even in 2023(they are challenging and difficult questions). 30
- 31. Thank you for Listening! 31
Editor's Notes
- #1: I believe we’re all here. (みんな揃っていますね) Why don’t we get started? (会議を始めましょう) Hello, Everyone. I am Ryota Kozakai. I would like talk about Learning Tendency Analysis of Scratch Programming Course(Entry Class) for Upper Elementary School Students Based on Bayesian Item Response Theory. I speak English not well. Please engourage my English Speech. Thank you.
- #2: First, I’d like to start with my study background.
- #9: For example, plotted curves are probabilities of correct anwer. Colored Red is the curve where =2, Colored green is the curve where =1, Colored black is the curve where =1, Red curves indicate higher gradients, The green curve is moving to the right.
- #13: 正答が真, 誤答が偽
- #14: 正答が真, 誤答が偽
- #15: Then, I talk about the Model Accuracy. This matrix is the confusion matrix. この値は観測値および予測値が正答である数を表す。 For example, This value represents the number of observations and predictions that are correct answer. 他も同様である。 Other values are in the same manner. The AUC values are 0.96, 0.89, and 0.95 in 2021, 2022, and 2023, respectively. These values are enough accurate and very high. ◾️適合率 Precision モデルが正答と判断し、実際に正答だった割合をいいます。 ◾️再現率 Recall 実際に正答だったもののうち、モデルが正答と判断した割合をいいます。 F1スコアはPrecisionとRecallの調和平均を言います。 特異度はテストでの不正解を正しく不正解と判定できる確率
- #16: The minimum values of information function are not very small, and the maximum values of standard error are small.