SlideShare a Scribd company logo
Logistic
Regression
This course content is being actively
developed by Delta Analytics, a
501(c)3 Bay Area nonprofit that aims
to empower communities to
leverage their data for good.
Please reach out with any questions
or feedback to
inquiry@deltanalytics.org.
Find out more about our mission
here.
Delta Analytics builds technical capacity
around the world.
Quick Review
Regression
Continuous variable
Classificatio
n
Regression & Classification
● ML studies how to automatically learn to make accurate predictions
based on past observations.
● Two types of supervised tasks, regression and classification.
Ordinary Least Squares (OLS)
regression
Logistic regression
● General Steps:
○ Split data into “training” and “test” sets.
○ Use regression/classification results from “training” set to predict“test” set
○ Compare “Predicted Y” to “Actual Y”
● Validation metrics (OLS):
** R^2 ** Adjusted R2 ** MSE
Predicted Y - Actual Y
Model’s Performance and Evaluation
● Ability to generalize to unseen data:
Source: Machine Learning Algorithms for Classification, Schapire (2016)
Module 3:
Logistic Regression
Overview of Logistic Regression:
Task
Model the probability that Y
belongs to a particular category
Performanc
e Measure
Accuracy, Misclassification Rate,
Precision, Recall. ROC Curve,
Confusion Matrix, etc.
Learning
Experience
Supervised
Source: Deep Learning Book -
Task
❏ Logistic Regression
❏ Task
❏ Dilemma using OLS
❏ Odds ratio
❏ Logit link function
❏ Probability thresholds
❏ Learning Experience
❏ Cost function
❏ Optimization process
❏ Performance
❏ Confusion Matrix
❏ ROC and AUC
Module Checklist
● A linear regression with variable(s) matrix X predicting target y is
formulated as:
SUM ( predictors j thru p (columns) of
the matrix X )
Beta (j), coefficient for the predictor
xj , the j th
column in variable matrix X
Beta (zero) intercept
● With linear regression, it is difficult to assign some observation
value x to some category value y.
● Example:
○ Predict college admissions using GRE, GPA, and college
prestige
■ What would our output category value “College
Admissions” be?
Expected value (mean) of y given
variable matrix X
Task
Dilemma
using OLS
Task
Dilemma
using OLS
Houston we have a problema!!
Predicting College admission from gpa,
gre and school prestige
● We have a basic “binary” classification problem
○ 1 = admitted and 0 = rejected
● Keep in mind that the logistic regression is still solving for an
expected value. In the binary classification case this expected value
is the probability of one class:
● In regression syntax we would have:
Task
Dilemma
using OLS
Framing the idea in classification terms
Questions?
● There is a problem with this new equation: we want to estimate a
probability instead of a real number.
○ We need y to fall in the range [-infinity, infinity] for the regression to be
valid!
● Here is where the logit “link function” comes to our rescue!!
Task
Dilemma
using OLS
y to fall in the range [ -infinity, infinity ]
Estimate the probability instead of a real
number!!!
● Logistic regression is a twist on regression for categorical/class
target variables, where instead of solving for the mean of y,
logistic regression solves for the probability of class membership
of y.
● How does it do this? It uses a link function to describe a linear
relationship between the probability and our independent
variables
Task Odds ratio
Probability of class membership….
The link function is a function of the expected value
of the target variable
● What is our link function in the case of logistic regression?
● Our link function will use something called the odds ratio
Task Odds ratio
Modify regression equation…
The odds ratio of a probability p is a measure of how
many times more likely it is than the inverse case.
Questions?
Task Odds ratio
Probabilities of admittance by college prestige
Predicting college admission
Odds ratios of admittance by college prestige
In our example...
● If we put the odds ratio in place of the probability in the
regression equation, the range of odds ratio, our predicted value,
is now restricted to be in the range [0, infinity]
● And graphically will look like this:
Task Odds ratio
….. hmm something is missing ….
Modify regression equation…
● If we take the natural logarithm of a variable that falls between 0
and infinity, we can actually transform it into a variable that falls
between the range negative infinity and infinity.
○ Why? Because taking the logarithm of fractions results in negative
numbers.
● And now our graph looks like:
Task
Logit link
function
… this is how it needs to look..
Modify regression equation…
● The combination of converting the probability to an odds ratio
and taking the logarithm of that is called the logit link function,
and is what regression uses to estimate probability:
● Graphically looks like this:
Task
Logit link
function
Houston we solved the problema!
Modify regression equation…
● Now that we have a probability, how do we actually classify the data?
● Choose a probability depending on the type of the classification problem
we’re solving for:
Task
Probability
thresholds
In this case, 0.5 is the
threshold probability.
Threshold can be adjusted by
model.
● Here is a classification example, where account balance is used to
predict the probability of default.
● Can you guess what is the correct classification method linear
regression (left) and logistic regression (right)?
Let’s check our understanding of
logistic regression
Task
Questions?
Learning Methodology
● Logistic regression, like OLS, is solved by minimizing a loss
function, also called a cost function
● The cost function for OLS was the RSS (residual sum of squares),
but the cost function for logistic regression is:
Cost
function
Learning
Experience
● Let’s break this down. We want to minimize the cost function, J
Cost
function
Learning
Experience
1. For each
classifier we’ve
predicted...
2. Add up the “cost” of the prediction, where
h(x) is the prediction and y is the actual
classification
● The cost function should be higher when our predictions are
wrong and lower when they are right
● The cost function meets our need! When h(x) = 1 and y(0) , then
the cost function is infinite
Cost
function
Learning
Experience
Learning
Methodolog
y
Source: Seeing Theory - Regression
● Like OLS, logistic
regression learns by
gradient descent to
minimize the cost function
● Reminder of gradient
descent from OLS
Optimization of
MSE:
Optimization
process
Questions?
Performance Metrics
Model
evaluation
Performanc
e
Confusion Matrix
Imagine you are going to see your doctor and
you get an incorrect diagnosis
Source: Computing for the Social Sciences, University of Chicago
True Positive ( tp ): The cases in which the model
predicted "yes/positive", and the truth is also
“yes/positive."
True Negatives ( tn ): The cases in which the model
predicted "no/negative", and the truth is also
"no/negative."
False Positives ( fp ): The cases in which the model
predicted "yes/positive", and the truth is
"no/negative".
False Negatives ( fn ): The cases in which the
model predicted "no/negative", and the truth is
"yes/positive".
Model
evaluation
Performanc
e
Using information from the confusion
matrix
Number samples:
n = tp + tn + fp + fn
Accuracy:
In general how often is the classifier correct? => ( tp + tn) / n
Misclassification Rate (Error Rate):
How often is the model wrong => (fp + fn) / n
Precision:
When the model predicts "yes", how often is it correct? => tp / (tp + fp)
Recall (True Positive Rate):
How often the model predicts yes, when it's actually yes => tp / ( tp + fn)
This is so
confusing
Model
evaluation
Example
Performanc
e
Can we predict if a congressmen/women is
a republican or democrat? Let’s use the
1984 United States Congressional Voting Records Database
Assume that we have set and run a logistic regression (gridsearch for hyperamaters),
etc and we got the following output:
Note: In this lecture, we are omitting other factors (class imbalance, how
to gridsearch hyperparameters, etc).
Now, evaluate the model => knowing that if we randomly choose from our dataset, 61
% of the time you will guess /choose democrat (there are 267 democrats and 168
republicans in the dataset)
Hmm?
?
Model
evaluation
Example
Performanc
e
Here is the confusion matrix, let's calculate
some model performance indicators
Number of samples:
n = tp + tn + fp + fn => 49 +78 + 2 + 2 = 131
Accuracy:
In general how often is the classifier correct? => ( tp + tn) / n
=> (49+78) 131 => 0.9694 or 96.94%
Misclassification Rate (Error Rate):
How often is the model wrong => (fp + fn) / n => 4 / 131 => 0.03053 or 3.053%
Precision:
When the model predicts "yes", how often is it correct? => tp / (tp + fp)
=> 49 / (49 + 2) => 97.5%
Recall (True Positive Rate):
How often the model predicts yes, when it's actually yes => tp / ( tp + fn)
=> 49 / (49 + 2) => 97.5%
Now I
get it!
Model
evaluation
Performanc
e
Other thresholds
What if instead of boosting the overall model accuracy, we want to improve a “class-
specific” accuracy?
● This can be the case when we want to increase sensitivity/recall => increase of the true
positive rate (TPR)
■ True Positive Rate = tp / ( tp + fn ) => 49 / (49 + 2) => 97.5%
● On the other hand, if we want to increase specificity we will need to increase the true
negative rate (TNR)
■ False Positive Rate = fp / ( fp + tn) => 2 / (2 + 78) => 2.5%
How do we accomplish this?
● Estimate a better model (achieve higher sensitivity and specificity)
● Use our existing model to meet one of these goals
○ Adjusting a threshold, or the cut-off point for classifying individuals as
Wait..
there is
more?!
Model
evaluation
Performanc
e
ROC Curve
● We can graph across many combinations of thresholds, and then select a threshold
level at a point on which we are comfortable.
● The best approach is having domain knowledge on the benefits and costs of
making/considering a threshold (trade off).
● Receiving Operating Characteristic (ROC) visual way to inspect the performance of a
binary classifier
○ In a nutshell with a ROC curve we're measuring the “trade off” between the rate at
which the model correctly predicts something, with the rate at which the model
predicts something incorrectly.
○ As the class assignment threshold increases for the positive class, the false positive
rate and true positive rate necessarily increase.
How do we
select a
threshold?
Model
evaluation
Performanc
e
ROC Curve Some
examples
por favor?
Source: yhat
Classifier is
making
completely
random
guesses
(50/50
chance)
Worse
than
guessing
, the blue
line is
below
the
dotted
line
Mediocre
classifier,
lines that
show dips
Good Classifier, the
ideal scenario
where there is a
'hump shaped'
curve that is
continually
increasing
A perfect classifier is
the one that shows a
perfect trade-off
between TPR and FPR
=> TPR of one and
FPR of zero
Model
evaluation
Performanc
e
ROC Curve and AUC
ROC and AUC
from
Republican/D
emocrat
case?
There is one more concept we should
know:
● Area under the curve or AUC, is
the amount of space underneath
the ROC curve.
● AUC shows how well the TPR and
FPR is looking in the aggregate.
● The greater the area under the
curve, shows the higher quality of
the model.
● The greater the area under the
curve, the higher the ratio of true
positives to false positives as the
threshold becomes more lenient
○ AUC = 0 => BAD
○ AUC = 1 => GOOD
✓ Logistic Regression
✓ Task
✓ Dilemma using OLS
✓ Odds ratio
✓ Logit link function
✓ Probability thresholds
✓ Learning Experience
✓ Cost function
✓ Optimization process
✓ Performance
✓ Confusion Matrix
✓ ROC and AUC
Module Checklist
Advanced
resources
● Textbooks
○ An Introduction to Statistical Learning with Applications in R (James, Witten, Hastie
and Tibshirani): Chapters 4.1, 4.2 4.3
● Online resources
○ Statistical learning: logistic regression - MACS 30100 - Perspectives on Computational
Modeling
○ Simple guide to confusion matrix terminology
○ A Simple Logistic Regression Implementation
● If you are interested in gridsearch of hyperparameters:
○ Tuning the hyper-parameters of an estimator
○ LogisticRegression (sklearn.linear_model)
Want to take this further? Here are some
resources we recommend:
Congrats! You finished the module!
Find out more about Delta’s machine learning
for good mission here.

More Related Content

Similar to Lecture 3.1_ Logistic Regression powerpoint (20)

PDF
Explore ml day 2
preetikumara
 
PPTX
Supervised learning
Johnson Ubah
 
PDF
Machine Learning with Python- Machine Learning Algorithms- Logistic Regressio...
KalighatOkira
 
PDF
Machine learning4dummies
Michael Winer
 
PDF
Machine Learning and Deep Learning 4 dummies
Dori Waldman
 
PPTX
Application of Machine Learning in Agriculture
Aman Vasisht
 
PPTX
Regresión
Ramiro Aduviri Velasco
 
PPTX
Py data19 final
Maria Navarro Jiménez
 
PDF
Logistic regression
Rupak Roy
 
PDF
L1 intro2 supervised_learning
Yogendra Singh
 
PPTX
Logistical Regression.pptx
Ramakrishna Reddy Bijjam
 
PPT
INTRODUCTION TO BOOSTING.ppt
BharatDaiyaBharat
 
PDF
Supervised Learning.pdf
gadissaassefa
 
PPTX
Linear regression in machine learning
Shajun Nisha
 
PDF
Machine learning in credit risk modeling : a James white paper
James by CrowdProcess
 
PDF
Linear logisticregression
kongara
 
PDF
Model Selection and Validation
gmorishita
 
PDF
Understanding Blackbox Prediction via Influence Functions
SEMINARGROOT
 
PPTX
MACHINE LEARNING Unit -2 Algorithm.pptx
ARVIND SARDAR
 
PPTX
When Models Meet Data: From ancient science to todays Artificial Intelligence...
ssuserbbbef4
 
Explore ml day 2
preetikumara
 
Supervised learning
Johnson Ubah
 
Machine Learning with Python- Machine Learning Algorithms- Logistic Regressio...
KalighatOkira
 
Machine learning4dummies
Michael Winer
 
Machine Learning and Deep Learning 4 dummies
Dori Waldman
 
Application of Machine Learning in Agriculture
Aman Vasisht
 
Py data19 final
Maria Navarro Jiménez
 
Logistic regression
Rupak Roy
 
L1 intro2 supervised_learning
Yogendra Singh
 
Logistical Regression.pptx
Ramakrishna Reddy Bijjam
 
INTRODUCTION TO BOOSTING.ppt
BharatDaiyaBharat
 
Supervised Learning.pdf
gadissaassefa
 
Linear regression in machine learning
Shajun Nisha
 
Machine learning in credit risk modeling : a James white paper
James by CrowdProcess
 
Linear logisticregression
kongara
 
Model Selection and Validation
gmorishita
 
Understanding Blackbox Prediction via Influence Functions
SEMINARGROOT
 
MACHINE LEARNING Unit -2 Algorithm.pptx
ARVIND SARDAR
 
When Models Meet Data: From ancient science to todays Artificial Intelligence...
ssuserbbbef4
 

Recently uploaded (20)

PPTX
artificial intelligence applications in Geomatics
NawrasShatnawi1
 
PPTX
Thermal runway and thermal stability.pptx
godow93766
 
PPTX
Hashing Introduction , hash functions and techniques
sailajam21
 
PDF
Design Thinking basics for Engineers.pdf
CMR University
 
PDF
Reasons for the succes of MENARD PRESSUREMETER.pdf
majdiamz
 
PPTX
VITEEE 2026 Exam Details , Important Dates
SonaliSingh127098
 
PPTX
Evaluation and thermal analysis of shell and tube heat exchanger as per requi...
shahveer210504
 
PDF
Zilliz Cloud Demo for performance and scale
Zilliz
 
PPTX
Day2 B2 Best.pptx
helenjenefa1
 
DOC
MRRS Strength and Durability of Concrete
CivilMythili
 
PPTX
The Role of Information Technology in Environmental Protectio....pptx
nallamillisriram
 
PPTX
Types of Bearing_Specifications_PPT.pptx
PranjulAgrahariAkash
 
PPTX
Lecture 1 Shell and Tube Heat exchanger-1.pptx
mailforillegalwork
 
PDF
Biomechanics of Gait: Engineering Solutions for Rehabilitation (www.kiu.ac.ug)
publication11
 
DOCX
8th International Conference on Electrical Engineering (ELEN 2025)
elelijjournal653
 
PPTX
Worm gear strength and wear calculation as per standard VB Bhandari Databook.
shahveer210504
 
PDF
Set Relation Function Practice session 24.05.2025.pdf
DrStephenStrange4
 
PDF
International Journal of Information Technology Convergence and services (IJI...
ijitcsjournal4
 
PDF
MAD Unit - 1 Introduction of Android IT Department
JappanMavani
 
PPTX
GitOps_Repo_Structure for begeinner(Scaffolindg)
DanialHabibi2
 
artificial intelligence applications in Geomatics
NawrasShatnawi1
 
Thermal runway and thermal stability.pptx
godow93766
 
Hashing Introduction , hash functions and techniques
sailajam21
 
Design Thinking basics for Engineers.pdf
CMR University
 
Reasons for the succes of MENARD PRESSUREMETER.pdf
majdiamz
 
VITEEE 2026 Exam Details , Important Dates
SonaliSingh127098
 
Evaluation and thermal analysis of shell and tube heat exchanger as per requi...
shahveer210504
 
Zilliz Cloud Demo for performance and scale
Zilliz
 
Day2 B2 Best.pptx
helenjenefa1
 
MRRS Strength and Durability of Concrete
CivilMythili
 
The Role of Information Technology in Environmental Protectio....pptx
nallamillisriram
 
Types of Bearing_Specifications_PPT.pptx
PranjulAgrahariAkash
 
Lecture 1 Shell and Tube Heat exchanger-1.pptx
mailforillegalwork
 
Biomechanics of Gait: Engineering Solutions for Rehabilitation (www.kiu.ac.ug)
publication11
 
8th International Conference on Electrical Engineering (ELEN 2025)
elelijjournal653
 
Worm gear strength and wear calculation as per standard VB Bhandari Databook.
shahveer210504
 
Set Relation Function Practice session 24.05.2025.pdf
DrStephenStrange4
 
International Journal of Information Technology Convergence and services (IJI...
ijitcsjournal4
 
MAD Unit - 1 Introduction of Android IT Department
JappanMavani
 
GitOps_Repo_Structure for begeinner(Scaffolindg)
DanialHabibi2
 
Ad

Lecture 3.1_ Logistic Regression powerpoint

  • 2. This course content is being actively developed by Delta Analytics, a 501(c)3 Bay Area nonprofit that aims to empower communities to leverage their data for good. Please reach out with any questions or feedback to [email protected]. Find out more about our mission here. Delta Analytics builds technical capacity around the world.
  • 4. Regression Continuous variable Classificatio n Regression & Classification ● ML studies how to automatically learn to make accurate predictions based on past observations. ● Two types of supervised tasks, regression and classification. Ordinary Least Squares (OLS) regression Logistic regression
  • 5. ● General Steps: ○ Split data into “training” and “test” sets. ○ Use regression/classification results from “training” set to predict“test” set ○ Compare “Predicted Y” to “Actual Y” ● Validation metrics (OLS): ** R^2 ** Adjusted R2 ** MSE Predicted Y - Actual Y Model’s Performance and Evaluation ● Ability to generalize to unseen data: Source: Machine Learning Algorithms for Classification, Schapire (2016)
  • 7. Overview of Logistic Regression: Task Model the probability that Y belongs to a particular category Performanc e Measure Accuracy, Misclassification Rate, Precision, Recall. ROC Curve, Confusion Matrix, etc. Learning Experience Supervised Source: Deep Learning Book -
  • 9. ❏ Logistic Regression ❏ Task ❏ Dilemma using OLS ❏ Odds ratio ❏ Logit link function ❏ Probability thresholds ❏ Learning Experience ❏ Cost function ❏ Optimization process ❏ Performance ❏ Confusion Matrix ❏ ROC and AUC Module Checklist
  • 10. ● A linear regression with variable(s) matrix X predicting target y is formulated as: SUM ( predictors j thru p (columns) of the matrix X ) Beta (j), coefficient for the predictor xj , the j th column in variable matrix X Beta (zero) intercept ● With linear regression, it is difficult to assign some observation value x to some category value y. ● Example: ○ Predict college admissions using GRE, GPA, and college prestige ■ What would our output category value “College Admissions” be? Expected value (mean) of y given variable matrix X Task Dilemma using OLS
  • 11. Task Dilemma using OLS Houston we have a problema!! Predicting College admission from gpa, gre and school prestige
  • 12. ● We have a basic “binary” classification problem ○ 1 = admitted and 0 = rejected ● Keep in mind that the logistic regression is still solving for an expected value. In the binary classification case this expected value is the probability of one class: ● In regression syntax we would have: Task Dilemma using OLS Framing the idea in classification terms Questions?
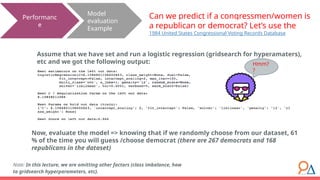
  • 13. ● There is a problem with this new equation: we want to estimate a probability instead of a real number. ○ We need y to fall in the range [-infinity, infinity] for the regression to be valid! ● Here is where the logit “link function” comes to our rescue!! Task Dilemma using OLS y to fall in the range [ -infinity, infinity ] Estimate the probability instead of a real number!!!
  • 14. ● Logistic regression is a twist on regression for categorical/class target variables, where instead of solving for the mean of y, logistic regression solves for the probability of class membership of y. ● How does it do this? It uses a link function to describe a linear relationship between the probability and our independent variables Task Odds ratio Probability of class membership…. The link function is a function of the expected value of the target variable
  • 15. ● What is our link function in the case of logistic regression? ● Our link function will use something called the odds ratio Task Odds ratio Modify regression equation… The odds ratio of a probability p is a measure of how many times more likely it is than the inverse case. Questions?
  • 16. Task Odds ratio Probabilities of admittance by college prestige Predicting college admission Odds ratios of admittance by college prestige In our example...
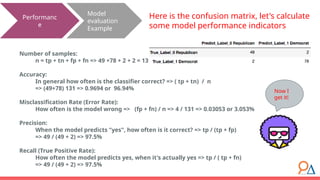
  • 17. ● If we put the odds ratio in place of the probability in the regression equation, the range of odds ratio, our predicted value, is now restricted to be in the range [0, infinity] ● And graphically will look like this: Task Odds ratio ….. hmm something is missing …. Modify regression equation…
  • 18. ● If we take the natural logarithm of a variable that falls between 0 and infinity, we can actually transform it into a variable that falls between the range negative infinity and infinity. ○ Why? Because taking the logarithm of fractions results in negative numbers. ● And now our graph looks like: Task Logit link function … this is how it needs to look.. Modify regression equation…
  • 19. ● The combination of converting the probability to an odds ratio and taking the logarithm of that is called the logit link function, and is what regression uses to estimate probability: ● Graphically looks like this: Task Logit link function Houston we solved the problema! Modify regression equation…
  • 20. ● Now that we have a probability, how do we actually classify the data? ● Choose a probability depending on the type of the classification problem we’re solving for: Task Probability thresholds In this case, 0.5 is the threshold probability. Threshold can be adjusted by model.
  • 21. ● Here is a classification example, where account balance is used to predict the probability of default. ● Can you guess what is the correct classification method linear regression (left) and logistic regression (right)? Let’s check our understanding of logistic regression Task Questions?
  • 23. ● Logistic regression, like OLS, is solved by minimizing a loss function, also called a cost function ● The cost function for OLS was the RSS (residual sum of squares), but the cost function for logistic regression is: Cost function Learning Experience
  • 24. ● Let’s break this down. We want to minimize the cost function, J Cost function Learning Experience 1. For each classifier we’ve predicted... 2. Add up the “cost” of the prediction, where h(x) is the prediction and y is the actual classification
  • 25. ● The cost function should be higher when our predictions are wrong and lower when they are right ● The cost function meets our need! When h(x) = 1 and y(0) , then the cost function is infinite Cost function Learning Experience
  • 26. Learning Methodolog y Source: Seeing Theory - Regression ● Like OLS, logistic regression learns by gradient descent to minimize the cost function ● Reminder of gradient descent from OLS Optimization of MSE: Optimization process Questions?
  • 28. Model evaluation Performanc e Confusion Matrix Imagine you are going to see your doctor and you get an incorrect diagnosis Source: Computing for the Social Sciences, University of Chicago True Positive ( tp ): The cases in which the model predicted "yes/positive", and the truth is also “yes/positive." True Negatives ( tn ): The cases in which the model predicted "no/negative", and the truth is also "no/negative." False Positives ( fp ): The cases in which the model predicted "yes/positive", and the truth is "no/negative". False Negatives ( fn ): The cases in which the model predicted "no/negative", and the truth is "yes/positive".
  • 29. Model evaluation Performanc e Using information from the confusion matrix Number samples: n = tp + tn + fp + fn Accuracy: In general how often is the classifier correct? => ( tp + tn) / n Misclassification Rate (Error Rate): How often is the model wrong => (fp + fn) / n Precision: When the model predicts "yes", how often is it correct? => tp / (tp + fp) Recall (True Positive Rate): How often the model predicts yes, when it's actually yes => tp / ( tp + fn) This is so confusing
  • 30. Model evaluation Example Performanc e Can we predict if a congressmen/women is a republican or democrat? Let’s use the 1984 United States Congressional Voting Records Database Assume that we have set and run a logistic regression (gridsearch for hyperamaters), etc and we got the following output: Note: In this lecture, we are omitting other factors (class imbalance, how to gridsearch hyperparameters, etc). Now, evaluate the model => knowing that if we randomly choose from our dataset, 61 % of the time you will guess /choose democrat (there are 267 democrats and 168 republicans in the dataset) Hmm? ?
  • 31. Model evaluation Example Performanc e Here is the confusion matrix, let's calculate some model performance indicators Number of samples: n = tp + tn + fp + fn => 49 +78 + 2 + 2 = 131 Accuracy: In general how often is the classifier correct? => ( tp + tn) / n => (49+78) 131 => 0.9694 or 96.94% Misclassification Rate (Error Rate): How often is the model wrong => (fp + fn) / n => 4 / 131 => 0.03053 or 3.053% Precision: When the model predicts "yes", how often is it correct? => tp / (tp + fp) => 49 / (49 + 2) => 97.5% Recall (True Positive Rate): How often the model predicts yes, when it's actually yes => tp / ( tp + fn) => 49 / (49 + 2) => 97.5% Now I get it!
  • 32. Model evaluation Performanc e Other thresholds What if instead of boosting the overall model accuracy, we want to improve a “class- specific” accuracy? ● This can be the case when we want to increase sensitivity/recall => increase of the true positive rate (TPR) ■ True Positive Rate = tp / ( tp + fn ) => 49 / (49 + 2) => 97.5% ● On the other hand, if we want to increase specificity we will need to increase the true negative rate (TNR) ■ False Positive Rate = fp / ( fp + tn) => 2 / (2 + 78) => 2.5% How do we accomplish this? ● Estimate a better model (achieve higher sensitivity and specificity) ● Use our existing model to meet one of these goals ○ Adjusting a threshold, or the cut-off point for classifying individuals as Wait.. there is more?!
  • 33. Model evaluation Performanc e ROC Curve ● We can graph across many combinations of thresholds, and then select a threshold level at a point on which we are comfortable. ● The best approach is having domain knowledge on the benefits and costs of making/considering a threshold (trade off). ● Receiving Operating Characteristic (ROC) visual way to inspect the performance of a binary classifier ○ In a nutshell with a ROC curve we're measuring the “trade off” between the rate at which the model correctly predicts something, with the rate at which the model predicts something incorrectly. ○ As the class assignment threshold increases for the positive class, the false positive rate and true positive rate necessarily increase. How do we select a threshold?
  • 34. Model evaluation Performanc e ROC Curve Some examples por favor? Source: yhat Classifier is making completely random guesses (50/50 chance) Worse than guessing , the blue line is below the dotted line Mediocre classifier, lines that show dips Good Classifier, the ideal scenario where there is a 'hump shaped' curve that is continually increasing A perfect classifier is the one that shows a perfect trade-off between TPR and FPR => TPR of one and FPR of zero
  • 35. Model evaluation Performanc e ROC Curve and AUC ROC and AUC from Republican/D emocrat case? There is one more concept we should know: ● Area under the curve or AUC, is the amount of space underneath the ROC curve. ● AUC shows how well the TPR and FPR is looking in the aggregate. ● The greater the area under the curve, shows the higher quality of the model. ● The greater the area under the curve, the higher the ratio of true positives to false positives as the threshold becomes more lenient ○ AUC = 0 => BAD ○ AUC = 1 => GOOD
  • 36. ✓ Logistic Regression ✓ Task ✓ Dilemma using OLS ✓ Odds ratio ✓ Logit link function ✓ Probability thresholds ✓ Learning Experience ✓ Cost function ✓ Optimization process ✓ Performance ✓ Confusion Matrix ✓ ROC and AUC Module Checklist
  • 38. ● Textbooks ○ An Introduction to Statistical Learning with Applications in R (James, Witten, Hastie and Tibshirani): Chapters 4.1, 4.2 4.3 ● Online resources ○ Statistical learning: logistic regression - MACS 30100 - Perspectives on Computational Modeling ○ Simple guide to confusion matrix terminology ○ A Simple Logistic Regression Implementation ● If you are interested in gridsearch of hyperparameters: ○ Tuning the hyper-parameters of an estimator ○ LogisticRegression (sklearn.linear_model) Want to take this further? Here are some resources we recommend:
  • 39. Congrats! You finished the module! Find out more about Delta’s machine learning for good mission here.

Editor's Notes

  • #5: R^2 := R-Squared Statistical Measure Adjusted R^2 := Corrective R^2 Statistical Measure MSE := Mean Squared Error
  • #10: When we say “Category Value”, we mean non-numerical value (real integer or category) (e.g. 1,2,3 or “Cat”, “Dog”, “Dog”) Note: We do not use the x_i or y_i notation, but rather use term “some” value.
  • #11: College Admission is target (column) “admit”
  • #14: Let’s all do the Twist Logit Function
  • #15: Example Calculation For p=0.40, odds ratio(.40) = odds ratio(4/10) = (4/10) / (1- (4/10)) = (4/10) / (10/10-4/10) = (4/10) / (6/10) = 4/6 = ⅔ = .66...
  • #18: Logarithm of fractions examples Video
  • #21: Source: An Introduction to Statistical Learning