SlideShare a Scribd company logo
Python Toolboxes for
Data Scientists
BY
UBAH JOHNSON C
Introduction
The toolbox of any data scientist, as for any kind of programmer, is an
essential ingredient for success and enhanced performance. Choosing the
right tools can save a lot of time and thereby allow us to focus on data
analysis.
Python is a programming language with excellent properties for new
programmers making it ideal for people who have never programmed
before.
Python Properties
Easy to read codes
Suppression of non-mandatory delimiters
Dynamic typing
Dynamic memory usage
It is an interpreted language
Python libraries for data scientists
The most popular python toolboxes for any data scientist are
Numpy
Scipy
Pandas and
Scikit-Learn
Scikit-learn:
Scikit-learn is a machine learning library built from Numpy, Scipy and
Matplotlib.
It offers simple and efficient tools for data analysis such as
classification, regression, clustering, dimensionality reduction, model
selection and preprocessing.
Pandas: Python data analysis library
Pandas provides high-performance data structure and data analysis tools.
Its main feature is a fast and efficient Dataframe object for data manipulation with
integrated indexing.
DataFrame acts as a spreadsheet. It provides functions for aggregating, merging, and
joining dataset.
it also has tools for exporting and importing different file formats. Such as CSV, text
files, Microsoft excel, SQL databases, and fast HDF5 formats.
In many situations, the data you have in such formats will
not be complete or totally structured. For such cases,
Pandas offers handling of missing data and intelligent data
alignment. Furthermore, Pandas provides a convenient
Matplotlib interface.
Installations for Data sciences
We have two options for installation after choosing which python version
(Python 2.X and Python 3.X) to work with. They are;
Installing the data scientist python ecosystem by individual tool boxes or
To perform a bundle installation with all the needed toolboxes
For newbies, the second option is recommended, hence Anaconda python
distribution is a good option.
The Anaconda distribution provides integration of all the Python toolboxes and
applications needed for data scientists into a single directory without mixing it with
other Python toolboxes installed on the machine.
It contains, of course, the core toolboxes and applications such as NumPy, Pandas,
SciPy, Matplotlib, Scikit-learn, IPython, Spyder, etc., but also more specific tools for
other related tasks such as data visualization, code optimization, and big data
processing.
Integrated Development Environment for
python
The integrated development environment (IDE) is an essential tool for programmers
and data scientists.
Spyder (Scientific Python Development EnviRonment) is an IDE customized with the
task of the data scientist in mind.
Web Integrated Development Environment (WIDE): Jupyter.
Jupyter (for Julia, Python and R) aims to reuse the same WIDE for all these interpreted
languages and not just Python
Jupyter Notebook
It will take you through the jupyter notebook opening process
If we chose the bundle installation, we can start the Jupyter notebook platform by clicking on
the Jupyter Notebook icon installed by Anaconda in the start menu or on the desktop.
The browser will immediately be launched displaying the Jupyter notebook homepage, whose
URL is http://localhost:8888/tree.
So we need to press the new button at the top right of the homepage.
Then rename the notebook
Jupyter notebook
Let us begin by importing those toolboxes that we will need for our program.
To execute just one cell, we press the button or click on Cell Run or press the keys
Ctrl+Enter.
The DataFrame Data Structure
The key data structure in Pandas is the DataFrameobject.
A DataFrame is basically a tabular data structure, with rows and columns. Rows have a
specific index to access them, which can be any name or value. In Pandas, the columns
are called Series, a special type of data, which in essence consists of a list of several
values, where each value has an index.
Therefore, the DataFrame data structure can be seen as a spreadsheet, but it is much
more flexible
Dataframe
we will create a new cell by clicking Insert, Insert Cell Below or pressing the keysCtrl+B. Then, we
write in the following code:
We use the pandas DataFrame object constructor with a dictionary of lists as
argument. The value of each entry in the dictionary is the name of the column,
and the lists are their values.
The DataFrame columns can be arranged at construction time by entering a
keyword columns with a list of the names of the columns ordered as we want.
If the column keyword is not present in the constructor, the columns will be
arranged in alphabetical order.
Now, if we execute this cell, the result
will be a table like this:
Reading files using Pandas
For files to be read, ensure that the file is stored in the same directory as our notebook
directory.
Output of the file read
The way to read CSV (or any other separated value, providing the
separator character) files in Pandas is by calling the read_csv method.
Besides the name of the file, we add the na_values key argument to this
method along with the character that represents “non available data” in
the file. Normally, CSV files have a header with the names of the columns.
If this is the case, we can use the usecols parameter to select which
columns in the file will be used.
Pandas also has functions for reading files with formats such as Excel, HDF5, tabulated
files, or even the content from the clipboard (read_excel(), read_hdf (), read_table (),
read_clipboard ()).
Whichever function we use, the result of reading a file is stored as a DataFrame
structure.
we can use thehead()method, which shows just the first five rows. If we use a number
as an argument to this method, this will be the number of rows that will be listed:
The head() method
The Tail() method
Describe() method
Used to show a quick statistical information on all the numeric column in a
DataFrame.
The result shows the count, the mean, the standard deviation, the minimum and
maximum, and the percentiles, by default, the 25th, 50th, and 75th, for all the
values in each column or series.
Lecture 3 intro2data
Selecting Data
If we want to select a subset of data from a DataFrame, it is necessary to
indicate this subset using square brackets ([]) after the DataFrame.
Edu[‘value’] for selecting columns
Edu[10:14] for selecting rows
Edu.ix[90:94, [‘time’,’geo’]] for selecting a subset of rows and columns.
Filtering Data
Another way to select a subset of data is by applying Boolean indexing. This
indexing is commonly known as a filter. For instance, if we want to filter those
values less than or equal to 6.5, we can do it like this:
Edu[edu[‘value’]>6.5].tail()
The following Boolean operators can be used for filtering:< (less than),<=(less
than or equal to),>(greater than),>=(greater than or equal to),=(equal to),
and!=(not equal to)
Filtering missing values
Pandas uses the special value NaN(not a number) to represent missing values. In
Python, NaN is a special floating-point value returned by certain operations
when one of their results ends in an undefined value.
A subtle feature of NaN values is that two NaN are never equal. Because of this,
the only safe way to tell whether a value is missing in a DataFrame is by using
the isnull()function. Indeed, this function can be used to filter rows with missing
values
Filtering missing values
List of Aggregation functions
Manipulating Data
We can check the maximum and minimum values using .min(axis=0 or 1) or .max(axis=0
or 1) function.
Print “Pandas max function:”, edu[‘value’].max()
we can apply any binary arithmetical operation (+,-,*,/) to an entire row in a column. E.g
s =edu[‘value’]/100
we apply the sqrt function from the NumPy library to perform the square root of each
value in the Value column. E.g s=edu[‘value’].apply(np.sqrt)
If we need to design a specific function to apply it, we can write an in-line
function, commonly known as a λ-function. A λ-function is a function without a
name. It is only necessary to specify the parameters it receives, between the
lambda keyword and the colon (:). In the next example, only one parameter is
needed, which will be the value of each element in the Value column.
Another basic manipulation operation is to set new values in our DataFrame. This can be done
directly using the assign operator (=) over a DataFrame.
Now, if we want to remove this column from the DataFrame, we can use the drop function; this
removes the indicated rows if axis=0, or the indicated columns if axis=1
Manipulating Data
oEdu.drop(‘valueNorm’, axis=1, inplace =True)
oUse the append function to add a new row at the buttom of the DataFrame.
oEdu =edu.append({“time”:2000, “Value”:5.00,”Geo”:’a’} ignore_index=True)
oDropping a row: edu.drop(max(edu.index).axus=0, inplace=True)
oThe drop function is also used to remove missing values by applying it over the isnull() function
oeduDrop = edu.drop(edu[“value”].isnull(), axis=0)
oeduDrop.head()
Sorting
Another important functionality we will need when inspecting our data is to sort by columns.
For sorting in ascending order we use the code
For sorting in descending order we use this code
Grouping Data
Pandas groupby () function allows us to group data.
To have a proper DataFrame as a result, it is necessary to apply an aggregation
function. Thus, this function will be applied to all the values in the same group.
Rearranging Data
We can transform the arrangement of our data, redistributing the indexes and
columns for better manipulation of our data, which normally leads to better
performance. We can rearrange our data using the pivot_table function. Here,
we can specify which columns will be the new indexes, the new values, and the
new columns.
Now we can use the new index to select specific rows by label, using the ix operator:
Ranking Data
Another useful visualization feature is to rank data. For example, we would like to know
how each country is ranked by year. To see this, we will use the pandas rank function.
But first, we need to clean up our previous pivoted table a bit so that it only has real
countries with real data.
To do this, first we drop the Euro area entries and shorten the Germany name entry,
using there name function and then we drop all the rows containing any NaN, using the
dropna function.
Ranking
Plotting Data
Pandas Dataframes and series can be plotted using the plot() function which
uses the library for graphics, Matplotlib
Plotting Data
It is also possible to plot a DataFrame directly. In this case, each column is
treated as a separated Series. For example, instead of printing the accumulated
value over the years, we can plot the value for each year.
Thanks!

More Related Content

What's hot (20)

PDF
9 python data structure-2
Prof. Dr. K. Adisesha
 
PPTX
Introduction To R Language
Gaurang Dobariya
 
PPTX
Data structures and algorithms
Hoang Nguyen
 
PPTX
Chapter 15 Lists
Praveen M Jigajinni
 
PDF
R training2
Hellen Gakuruh
 
PDF
LectureNotes-05-DSA
Haitham El-Ghareeb
 
PPTX
Arrays in Data Structure and Algorithm
KristinaBorooah
 
PPT
Basic data-structures-v.1.1
BG Java EE Course
 
PDF
Lecture-05-DSA
Haitham El-Ghareeb
 
PPT
R programming by ganesh kavhar
Savitribai Phule Pune University
 
PPTX
Python data type
Jaya Kumari
 
PDF
Data structure using c++
Prof. Dr. K. Adisesha
 
PPT
Ap Power Point Chpt9
dplunkett
 
PPTX
Data Structures (CS8391)
Elavarasi K
 
PPT
Data structure
Muhammad Farhan
 
PPTX
Chapter 17 Tuples
Praveen M Jigajinni
 
PDF
Introduction to Data Structure
Prof Ansari
 
PDF
Elementary data structure
Biswajit Mandal
 
PPT
9781439035665 ppt ch09
Terry Yoast
 
PDF
DATA STRUCTURES USING C -ENGGDIGEST
Swapnil Mishra
 
9 python data structure-2
Prof. Dr. K. Adisesha
 
Introduction To R Language
Gaurang Dobariya
 
Data structures and algorithms
Hoang Nguyen
 
Chapter 15 Lists
Praveen M Jigajinni
 
R training2
Hellen Gakuruh
 
LectureNotes-05-DSA
Haitham El-Ghareeb
 
Arrays in Data Structure and Algorithm
KristinaBorooah
 
Basic data-structures-v.1.1
BG Java EE Course
 
Lecture-05-DSA
Haitham El-Ghareeb
 
R programming by ganesh kavhar
Savitribai Phule Pune University
 
Python data type
Jaya Kumari
 
Data structure using c++
Prof. Dr. K. Adisesha
 
Ap Power Point Chpt9
dplunkett
 
Data Structures (CS8391)
Elavarasi K
 
Data structure
Muhammad Farhan
 
Chapter 17 Tuples
Praveen M Jigajinni
 
Introduction to Data Structure
Prof Ansari
 
Elementary data structure
Biswajit Mandal
 
9781439035665 ppt ch09
Terry Yoast
 
DATA STRUCTURES USING C -ENGGDIGEST
Swapnil Mishra
 

Similar to Lecture 3 intro2data (20)

PPTX
Group B - Pandas Pandas is a powerful Python library that provides high-perfo...
HarshitChauhan88
 
PPTX
Meetup Junio Data Analysis with python 2018
DataLab Community
 
PPTX
Pandas csv
Devashish Kumar
 
PPTX
Lecture 9.pptx
MathewJohnSinoCruz
 
PPTX
interenship.pptx
Naveen316549
 
PPTX
More on Pandas.pptx
VirajPathania1
 
PPTX
Unit 3_Numpy_VP.pptx
vishnupriyapm4
 
PDF
Data Wrangling and Visualization Using Python
MOHITKUMAR1379
 
PPTX
Data Visualization_pandas in hadoop.pptx
Rahul Borate
 
PPTX
python-pandas-For-Data-Analysis-Manipulate.pptx
PLOKESH8
 
PPTX
Pandas-(Ziad).pptx
Sivam Chinna
 
PPTX
Python for data analysis
Savitribai Phule Pune University
 
PPTX
Pythonggggg. Ghhhjj-for-Data-Analysis.pptx
sahilurrahemankhan
 
PPTX
python for data anal gh i o fytysis creation.pptx
Vinod Deenathayalan
 
PPT
Python
Chetan Khanzode
 
PDF
Python-for-Data-Analysis.pdf
ssuser598883
 
PPTX
PPT on Data Science Using Python
NishantKumar1179
 
PPTX
Unit 3_Numpy_Vsp.pptx
prakashvs7
 
PPTX
Unit 1 Ch 2 Data Frames digital vis.pptx
abida451786
 
PPTX
Presentation on the basic of numpy and Pandas
ipazhaniraj
 
Group B - Pandas Pandas is a powerful Python library that provides high-perfo...
HarshitChauhan88
 
Meetup Junio Data Analysis with python 2018
DataLab Community
 
Pandas csv
Devashish Kumar
 
Lecture 9.pptx
MathewJohnSinoCruz
 
interenship.pptx
Naveen316549
 
More on Pandas.pptx
VirajPathania1
 
Unit 3_Numpy_VP.pptx
vishnupriyapm4
 
Data Wrangling and Visualization Using Python
MOHITKUMAR1379
 
Data Visualization_pandas in hadoop.pptx
Rahul Borate
 
python-pandas-For-Data-Analysis-Manipulate.pptx
PLOKESH8
 
Pandas-(Ziad).pptx
Sivam Chinna
 
Python for data analysis
Savitribai Phule Pune University
 
Pythonggggg. Ghhhjj-for-Data-Analysis.pptx
sahilurrahemankhan
 
python for data anal gh i o fytysis creation.pptx
Vinod Deenathayalan
 
Python-for-Data-Analysis.pdf
ssuser598883
 
PPT on Data Science Using Python
NishantKumar1179
 
Unit 3_Numpy_Vsp.pptx
prakashvs7
 
Unit 1 Ch 2 Data Frames digital vis.pptx
abida451786
 
Presentation on the basic of numpy and Pandas
ipazhaniraj
 
Ad

More from Johnson Ubah (7)

PPTX
Supervised learning
Johnson Ubah
 
PPTX
Statistical inference with Python
Johnson Ubah
 
PPTX
IP Addressing
Johnson Ubah
 
PPTX
OSI reference Model
Johnson Ubah
 
PPTX
introduction to data science
Johnson Ubah
 
PPTX
introduction to machine learning
Johnson Ubah
 
PPTX
Network and computer forensics
Johnson Ubah
 
Supervised learning
Johnson Ubah
 
Statistical inference with Python
Johnson Ubah
 
IP Addressing
Johnson Ubah
 
OSI reference Model
Johnson Ubah
 
introduction to data science
Johnson Ubah
 
introduction to machine learning
Johnson Ubah
 
Network and computer forensics
Johnson Ubah
 
Ad

Recently uploaded (20)

PPTX
apidays Munich 2025 - Building an AWS Serverless Application with Terraform, ...
apidays
 
PPTX
apidays Helsinki & North 2025 - API access control strategies beyond JWT bear...
apidays
 
PDF
The European Business Wallet: Why It Matters and How It Powers the EUDI Ecosy...
Lal Chandran
 
PPTX
Aict presentation on dpplppp sjdhfh.pptx
vabaso5932
 
PDF
Development and validation of the Japanese version of the Organizational Matt...
Yoga Tokuyoshi
 
PDF
OPPOTUS - Malaysias on Malaysia 1Q2025.pdf
Oppotus
 
PPTX
apidays Munich 2025 - Building Telco-Aware Apps with Open Gateway APIs, Subhr...
apidays
 
PPTX
apidays Helsinki & North 2025 - From Chaos to Clarity: Designing (AI-Ready) A...
apidays
 
PDF
What does good look like - CRAP Brighton 8 July 2025
Jan Kierzyk
 
PPTX
Exploring Multilingual Embeddings for Italian Semantic Search: A Pretrained a...
Sease
 
PPTX
b6057ea5-8e8c-4415-90c0-ed8e9666ffcd.pptx
Anees487379
 
PPTX
Listify-Intelligent-Voice-to-Catalog-Agent.pptx
nareshkottees
 
PDF
apidays Helsinki & North 2025 - Monetizing AI APIs: The New API Economy, Alla...
apidays
 
PPTX
apidays Singapore 2025 - The Quest for the Greenest LLM , Jean Philippe Ehre...
apidays
 
PDF
OOPs with Java_unit2.pdf. sarthak bookkk
Sarthak964187
 
PDF
Research Methodology Overview Introduction
ayeshagul29594
 
PDF
NIS2 Compliance for MSPs: Roadmap, Benefits & Cybersecurity Trends (2025 Guide)
GRC Kompas
 
PDF
apidays Singapore 2025 - The API Playbook for AI by Shin Wee Chuang (PAND AI)
apidays
 
PDF
apidays Helsinki & North 2025 - API-Powered Journeys: Mobility in an API-Driv...
apidays
 
PPT
tuberculosiship-2106031cyyfuftufufufivifviviv
AkshaiRam
 
apidays Munich 2025 - Building an AWS Serverless Application with Terraform, ...
apidays
 
apidays Helsinki & North 2025 - API access control strategies beyond JWT bear...
apidays
 
The European Business Wallet: Why It Matters and How It Powers the EUDI Ecosy...
Lal Chandran
 
Aict presentation on dpplppp sjdhfh.pptx
vabaso5932
 
Development and validation of the Japanese version of the Organizational Matt...
Yoga Tokuyoshi
 
OPPOTUS - Malaysias on Malaysia 1Q2025.pdf
Oppotus
 
apidays Munich 2025 - Building Telco-Aware Apps with Open Gateway APIs, Subhr...
apidays
 
apidays Helsinki & North 2025 - From Chaos to Clarity: Designing (AI-Ready) A...
apidays
 
What does good look like - CRAP Brighton 8 July 2025
Jan Kierzyk
 
Exploring Multilingual Embeddings for Italian Semantic Search: A Pretrained a...
Sease
 
b6057ea5-8e8c-4415-90c0-ed8e9666ffcd.pptx
Anees487379
 
Listify-Intelligent-Voice-to-Catalog-Agent.pptx
nareshkottees
 
apidays Helsinki & North 2025 - Monetizing AI APIs: The New API Economy, Alla...
apidays
 
apidays Singapore 2025 - The Quest for the Greenest LLM , Jean Philippe Ehre...
apidays
 
OOPs with Java_unit2.pdf. sarthak bookkk
Sarthak964187
 
Research Methodology Overview Introduction
ayeshagul29594
 
NIS2 Compliance for MSPs: Roadmap, Benefits & Cybersecurity Trends (2025 Guide)
GRC Kompas
 
apidays Singapore 2025 - The API Playbook for AI by Shin Wee Chuang (PAND AI)
apidays
 
apidays Helsinki & North 2025 - API-Powered Journeys: Mobility in an API-Driv...
apidays
 
tuberculosiship-2106031cyyfuftufufufivifviviv
AkshaiRam
 

Lecture 3 intro2data

  • 1. Python Toolboxes for Data Scientists BY UBAH JOHNSON C
  • 2. Introduction The toolbox of any data scientist, as for any kind of programmer, is an essential ingredient for success and enhanced performance. Choosing the right tools can save a lot of time and thereby allow us to focus on data analysis. Python is a programming language with excellent properties for new programmers making it ideal for people who have never programmed before.
  • 3. Python Properties Easy to read codes Suppression of non-mandatory delimiters Dynamic typing Dynamic memory usage It is an interpreted language
  • 4. Python libraries for data scientists The most popular python toolboxes for any data scientist are Numpy Scipy Pandas and Scikit-Learn
  • 5. Scikit-learn: Scikit-learn is a machine learning library built from Numpy, Scipy and Matplotlib. It offers simple and efficient tools for data analysis such as classification, regression, clustering, dimensionality reduction, model selection and preprocessing.
  • 6. Pandas: Python data analysis library Pandas provides high-performance data structure and data analysis tools. Its main feature is a fast and efficient Dataframe object for data manipulation with integrated indexing. DataFrame acts as a spreadsheet. It provides functions for aggregating, merging, and joining dataset. it also has tools for exporting and importing different file formats. Such as CSV, text files, Microsoft excel, SQL databases, and fast HDF5 formats.
  • 7. In many situations, the data you have in such formats will not be complete or totally structured. For such cases, Pandas offers handling of missing data and intelligent data alignment. Furthermore, Pandas provides a convenient Matplotlib interface.
  • 8. Installations for Data sciences We have two options for installation after choosing which python version (Python 2.X and Python 3.X) to work with. They are; Installing the data scientist python ecosystem by individual tool boxes or To perform a bundle installation with all the needed toolboxes For newbies, the second option is recommended, hence Anaconda python distribution is a good option.
  • 9. The Anaconda distribution provides integration of all the Python toolboxes and applications needed for data scientists into a single directory without mixing it with other Python toolboxes installed on the machine. It contains, of course, the core toolboxes and applications such as NumPy, Pandas, SciPy, Matplotlib, Scikit-learn, IPython, Spyder, etc., but also more specific tools for other related tasks such as data visualization, code optimization, and big data processing.
  • 10. Integrated Development Environment for python The integrated development environment (IDE) is an essential tool for programmers and data scientists. Spyder (Scientific Python Development EnviRonment) is an IDE customized with the task of the data scientist in mind. Web Integrated Development Environment (WIDE): Jupyter. Jupyter (for Julia, Python and R) aims to reuse the same WIDE for all these interpreted languages and not just Python
  • 11. Jupyter Notebook It will take you through the jupyter notebook opening process If we chose the bundle installation, we can start the Jupyter notebook platform by clicking on the Jupyter Notebook icon installed by Anaconda in the start menu or on the desktop. The browser will immediately be launched displaying the Jupyter notebook homepage, whose URL is http://localhost:8888/tree. So we need to press the new button at the top right of the homepage. Then rename the notebook
  • 12. Jupyter notebook Let us begin by importing those toolboxes that we will need for our program. To execute just one cell, we press the button or click on Cell Run or press the keys Ctrl+Enter.
  • 13. The DataFrame Data Structure The key data structure in Pandas is the DataFrameobject. A DataFrame is basically a tabular data structure, with rows and columns. Rows have a specific index to access them, which can be any name or value. In Pandas, the columns are called Series, a special type of data, which in essence consists of a list of several values, where each value has an index. Therefore, the DataFrame data structure can be seen as a spreadsheet, but it is much more flexible
  • 14. Dataframe we will create a new cell by clicking Insert, Insert Cell Below or pressing the keysCtrl+B. Then, we write in the following code:
  • 15. We use the pandas DataFrame object constructor with a dictionary of lists as argument. The value of each entry in the dictionary is the name of the column, and the lists are their values. The DataFrame columns can be arranged at construction time by entering a keyword columns with a list of the names of the columns ordered as we want. If the column keyword is not present in the constructor, the columns will be arranged in alphabetical order.
  • 16. Now, if we execute this cell, the result will be a table like this:
  • 17. Reading files using Pandas For files to be read, ensure that the file is stored in the same directory as our notebook directory.
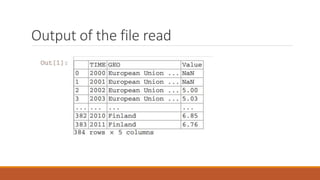
  • 18. Output of the file read
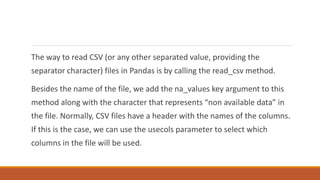
  • 19. The way to read CSV (or any other separated value, providing the separator character) files in Pandas is by calling the read_csv method. Besides the name of the file, we add the na_values key argument to this method along with the character that represents “non available data” in the file. Normally, CSV files have a header with the names of the columns. If this is the case, we can use the usecols parameter to select which columns in the file will be used.
  • 20. Pandas also has functions for reading files with formats such as Excel, HDF5, tabulated files, or even the content from the clipboard (read_excel(), read_hdf (), read_table (), read_clipboard ()). Whichever function we use, the result of reading a file is stored as a DataFrame structure. we can use thehead()method, which shows just the first five rows. If we use a number as an argument to this method, this will be the number of rows that will be listed:
  • 23. Describe() method Used to show a quick statistical information on all the numeric column in a DataFrame. The result shows the count, the mean, the standard deviation, the minimum and maximum, and the percentiles, by default, the 25th, 50th, and 75th, for all the values in each column or series.
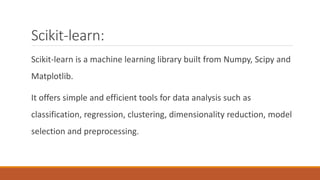
  • 25. Selecting Data If we want to select a subset of data from a DataFrame, it is necessary to indicate this subset using square brackets ([]) after the DataFrame. Edu[‘value’] for selecting columns Edu[10:14] for selecting rows Edu.ix[90:94, [‘time’,’geo’]] for selecting a subset of rows and columns.
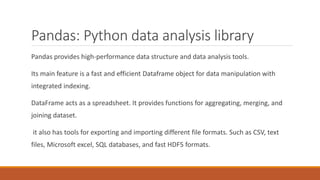
  • 26. Filtering Data Another way to select a subset of data is by applying Boolean indexing. This indexing is commonly known as a filter. For instance, if we want to filter those values less than or equal to 6.5, we can do it like this: Edu[edu[‘value’]>6.5].tail()
  • 27. The following Boolean operators can be used for filtering:< (less than),<=(less than or equal to),>(greater than),>=(greater than or equal to),=(equal to), and!=(not equal to)
  • 28. Filtering missing values Pandas uses the special value NaN(not a number) to represent missing values. In Python, NaN is a special floating-point value returned by certain operations when one of their results ends in an undefined value. A subtle feature of NaN values is that two NaN are never equal. Because of this, the only safe way to tell whether a value is missing in a DataFrame is by using the isnull()function. Indeed, this function can be used to filter rows with missing values
  • 30. List of Aggregation functions
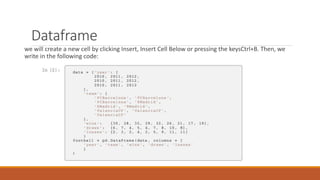
  • 31. Manipulating Data We can check the maximum and minimum values using .min(axis=0 or 1) or .max(axis=0 or 1) function. Print “Pandas max function:”, edu[‘value’].max() we can apply any binary arithmetical operation (+,-,*,/) to an entire row in a column. E.g s =edu[‘value’]/100 we apply the sqrt function from the NumPy library to perform the square root of each value in the Value column. E.g s=edu[‘value’].apply(np.sqrt)
  • 32. If we need to design a specific function to apply it, we can write an in-line function, commonly known as a λ-function. A λ-function is a function without a name. It is only necessary to specify the parameters it receives, between the lambda keyword and the colon (:). In the next example, only one parameter is needed, which will be the value of each element in the Value column.
  • 33. Another basic manipulation operation is to set new values in our DataFrame. This can be done directly using the assign operator (=) over a DataFrame. Now, if we want to remove this column from the DataFrame, we can use the drop function; this removes the indicated rows if axis=0, or the indicated columns if axis=1
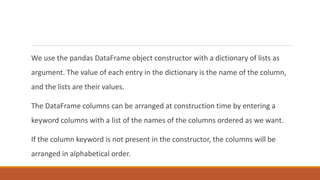
  • 34. Manipulating Data oEdu.drop(‘valueNorm’, axis=1, inplace =True) oUse the append function to add a new row at the buttom of the DataFrame. oEdu =edu.append({“time”:2000, “Value”:5.00,”Geo”:’a’} ignore_index=True) oDropping a row: edu.drop(max(edu.index).axus=0, inplace=True) oThe drop function is also used to remove missing values by applying it over the isnull() function oeduDrop = edu.drop(edu[“value”].isnull(), axis=0) oeduDrop.head()
  • 35. Sorting Another important functionality we will need when inspecting our data is to sort by columns. For sorting in ascending order we use the code For sorting in descending order we use this code
  • 36. Grouping Data Pandas groupby () function allows us to group data. To have a proper DataFrame as a result, it is necessary to apply an aggregation function. Thus, this function will be applied to all the values in the same group.
  • 37. Rearranging Data We can transform the arrangement of our data, redistributing the indexes and columns for better manipulation of our data, which normally leads to better performance. We can rearrange our data using the pivot_table function. Here, we can specify which columns will be the new indexes, the new values, and the new columns.
  • 38. Now we can use the new index to select specific rows by label, using the ix operator:
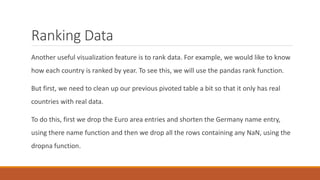
  • 39. Ranking Data Another useful visualization feature is to rank data. For example, we would like to know how each country is ranked by year. To see this, we will use the pandas rank function. But first, we need to clean up our previous pivoted table a bit so that it only has real countries with real data. To do this, first we drop the Euro area entries and shorten the Germany name entry, using there name function and then we drop all the rows containing any NaN, using the dropna function.
  • 41. Plotting Data Pandas Dataframes and series can be plotted using the plot() function which uses the library for graphics, Matplotlib
  • 42. Plotting Data It is also possible to plot a DataFrame directly. In this case, each column is treated as a separated Series. For example, instead of printing the accumulated value over the years, we can plot the value for each year.