SlideShare a Scribd company logo
Linked Data Visualization
3th Keystone Training School - Keyword Search in Big Linked Data
Institute for Software Technology and Interactive Systems, TU Wien, Austria
Laura Po, PhD
Department of Engineering "Enzo Ferrari"
University of Modena and Reggio Emilia
Italy
Linked Open Data Visualization
Goal of the Talk
• To provide practical skills required for exploring LOD sources
• The importance of visualization
• How a Linked Data Visualization Process can be defined
• Practical use of LOD/ RDF browsers and visualization toolkits
Outline
Why is visualization of Linked Data important?
- Large and Dynamic Data
- Efficiently and effectively handle billions of objects within dynamic datsets
- Visual presentation and interaction issues
- Offer ways to easly explore datasets
- Proposing summaries and overviews
- Incremental and progressive techniques
- Variety of Users and Tasks
BOLD – Big Open Linked Data
"The bigger the number, the harder it can be to visualise"
Bratsas et al (2016), Preface on special session “data impact: Big, open, linked data innovations” at 11th International Workshop on Semantic and Social Media Adaptation and Personalization (SMAP) https://doi.org/10.1109/SMAP.2016.7753368
Dwivedi et al, (2017) Driving innovation through big open linked data (BOLD): Exploring antecedents using interpretive structural, Inf Syst Front (2017) 19:197–212 https://link.springer.com/article/10.1007/s10796-016-9675-5
Saxena, (2017) BOLD (Big and Open Linked Data): what’s next?, Library Hi Tech News, Vol. 34 Issue: 5, pp.10-13, https://doi.org/10.1108/LHTN-04-2017-0020
Craig, (2016), BOLD: The power and potential of Big Open Linked Data, Published on 11 Oct 2016 on the Thomson Reuters Blog https://blogs.thomsonreuters.com/answerson/bold-power-potential-big-open-linked-data/
Why visualize data instead of provide statistic
analysis?
http://en.wikipedia.org/wiki/Anscombe's_quartet
• Anscombe's
quartet of datasets
having similar
statistical
properties but
appearing very
different when
plotted
Users
PRODUCERS Consumers
domain expert
Lay-users Technicalexpert
LOD Visualization
• LOD simplifies accessing and integrating data from different sources
• SPARQL makes it easy to select from, and analyse the data
• It's natural to visualise the data as graphs (networks)
… but other forms of visualisation also possible
RDF Graph
Reference for the picture: http://www.obitko.com/tutorials/ontologies-semantic-web/rdf-graph-and-syntax.html
Example of LOD visualization process
Heatmap visualization of The Beatles releases
LOD visualization systems
They can be classified in 6 categories
1. Browsers and Exploratory systems
2. Generic visualization systems
3. Domain vocabulary & device specific systems
4. Graph-based visualization systems
5. Ontology visualization systems
6. Visualization libraries
Bikakis and Sellis, (2016) Exploration and Visualization in the Web of Big Linked Data: A Survey of the State of the Art. Proceedings of
the Workshops of the EDBT/ICDT 2016 Joint Conference, EDBT/ICDT Workshops 2016, Bordeaux, France, March 15, 2016 http://ceur-
ws.org/Vol-1558/paper28.pdf
Evolution over time
Marie and Gandon, (2014) Survey of Linked Data Based Exploration Systems, Proceedings of the 3rd International Workshop on Intelligent Exploration of
Semantic Data (IESD 2014) co-located with the 13th International Semantic Web Conference (ISWC 2014), Riva del Garda, Italy, October 20, 2014
http://ceur-ws.org/Vol-1279/iesd14_8.pdf
Exploratory search
• Exploratory search systems (ESS) forms a special category of seeking
information on the Web with the purpose of revealing related
information to the searcher along with retrievals of what have been
searched for.
Palagi, et al. (2017), A Survey of Definitions and Models of Exploratory Search. Proceedings of the 2017 ACM Workshop on Exploratory Search and
Interactive Data Analytics. ACM, http://doi.acm.org/10.1145/3038462.3038465
Marie,(2015) , Linked data based exploratory search. PhD Thesis, Université Nice Sophia, Antipolis, https://tel.archives-ouvertes.fr/tel-01130622
Classification and Comparisons
Hoefler, Patrick, et al. "Linked Data
Query Wizard: A Novel Interface for
Accessing SPARQL
Endpoints." LDOW. 2014.
http://code-research.eu/
EU project 2012-2014
https://code.know-center.tugraz.at/search
TEST
• Using CODE Linked Data Query Wizard search for "Johann Strauss II"
within the Dbpedia source
• Explore the result
• Add columns that show some property like "birth place", "given
name", "music composer of ", ...
Linked Open Data Visualization
https://linkedjazz.org/network/
TEST
• Navigate the Linked Jazz cloud
• Change the visualization option (fized, similar, gender, dynamic)
LOD live
LodLive project provides a demonstration
of the use of Linked Data standards (RDF,
SPARQL) to browse RDF resources. The
application aims to spread linked data
principles using a simple and friendly
interface with reusable techniques.
http://en.lodlive.it/
http://en.lodlive.it/?http://dbpedia.org/resource/Jules_Verne
Linked Open Data Visualization
TEST
By using LodLive online to explore dbpedia resources, search for Johann
Strauss II http://en.lodlive.it/
- who is he?
- where was he born? where did he died?
- Is he the son of Johann Strauss?
- find which type are associated to him
Linked Open Data Visualization
LODmilla
Micsik, András, Sándor Turbucz, and Zoltán
Tóth. "Exploring publication metadata graphs
with the LODmilla browser and
editor." International Journal on Digital
Libraries 16.1 (2015): 15-24.
Micsik, András, Sándor Turbucz, and Zoltán
Tóth. "Browsing and traversing linked data with
lodmilla." ERCIM News 2014.96 (2014): 35-36.
http://lodmilla.sztaki.hu/lodmilla
TEST
Using LODMilla search and add the following node from Dbpedia:
• Johann Strauss II
• Vienna
• The Blue Danube
• Austria
• Johann Strauss I
• Wolfgang Amadeus Mozart
• Composer
• Musician
• Look at the connections between nodes
LODEX
It is a tool for producing a representative summary of a Linked open Data (LOD)
source starting from scratch, thus supporting users in exploring and
understanding the contents of a dataset.
LODeX extracts statistical indexes that uses to build the representative summary, by
quering the SPARQL endpoint of a LOD source.
• LODeX 2.0 (http://www.dbgroup.unimo.it/lodex2 ) includes the possibility to
compose visual queries by selecting objects from the representative summary of
a LOD source
• LODeX Cluster (http://www.dbgroup.unimo.it/lodex2/testCluster ) provides a
more concise schema for huge datasets
LODeX Architecture
LOD Cloud
SPARQL
Queries
LODeX
Post-
processing
Statistical
Indexes
LODeX
Indexes
Extraction
Endpoint
URLs
Schema
Summary
NoSQL
SPARQL
Queries
Schema
Summary
Query
Orchestrator
Schema
Summary
Visualizzation
Basic
QueryResults
Benedetti, et al. (2015), Exposing the Underlying Schema of LOD Sources. 2015 IEEE/WIC/ACM International Conference on Web Intelligence and Intelligent Agent Technology (WI-IAT)
(IEEE) ISBN: 9781467396189
Benedetti, et al. (2015), Visual Querying LOD sources with LODeX. Proceedings of the 8th International Conference on Knowledge Capture (ACM)
Benedetti, et al. (2015), LODeX: A tool for Visual Querying Linked Open Data. Proceedings of the ISWC 2015 Posters & Demonstrations Track @ (ISWC 2015), n. volume 1486
Benedetti, et al. (2014), A Visual Summary for Linked Open Data sources. ISWC 2014 Posters & Demo Track, Riva del Garda, Italy, ISSN: 1613-0073
Benedetti, et al. (2014), Online Index Extraction from Linked Open Data Sources. Second International Workshop on Linked Data for Information Extraction (LD4IE) @ (ISWC 2014), Riva del
Garda, Italy, ISSN: 1613-0073
A running example
ex:Sector foaf:Organization
owl:Class
ex:sector
“sector”
rdf:type rdf:type
rdf:Propertyrdf:type
owl:ObjectProperty
rdf:type
sector1 organization1ex:sector
dc:title
“Energy”
Extensional
Classes
Extensional
Knowledge
Intensional
Knowledge
ex:activity
“Village electrification
in the Pacific”
organization2 “+41331231”
rdfs:label
rdfs:label
rdfs:domain
rdf:type
ex:sector
rdf:type rdf:type
dbpedia:fax
person1
foaf:Person
ex:activity
“Paolo”
rdf:type
ex:ceo
rdf:type foaf:firstName
foaf:lastName “Rossi”
The information contained in the Intensional knowledge can be incomplete
or absent
Schema Summary – Building a Visual Query
Refinement Panel
TEST
By using Lodex http://www.dbgroup.unimore.it/lodex2/ find, navigate and
explore the following datasets:
• European Television Heritage
• How many classes it has? How many properties it has?
• How many vocabulary are used?
• Nobel Prizes
• How many vocabulary are used?
• Define a query that select person (label, gender,name) that won a Nobel Prize ,
i.e.have an Award (year,label), add also the Category of the Award if it exists
Conclusions
• Analysis of the needs for visualization in the LOD context
• Practical use of some LOD browsers and visualization toolkits
• Navigation and exploration of some datasets and the construction of
different visualizations
Actual limitations and challenges
• Most of the LOD visualization tools are still in-lab prototypes
• Lots tools allow the exploration of a limited list of datasets or have
limitations in terms of size, format (SPARQL endpoint/RDF dumps) of the
datasets they can explore
• SPARQL endpoints might be offline or have bad performance such as taking
long time to respond to some queris.
• For dealing with BOLD, graph simplification is needed:
• reducing size could be possible through filtering or aggregation
RDF Graph
Aggregated View
Schema Summary
My vision
Feel free to contact me at
laura.po@unimore.it
You can find more information on
my research and my group at
www.dbgroup.unimore.it
Slide are available on
http://www.slideshare.net/polaura

More Related Content

What's hot (20)

PPTX
Triple Stores
Stephan Volmer
 
PDF
Trying SPARQL Anything with MEI
Enrico Daga
 
PPTX
Big Linked Data - Creating Training Curricula
EUCLID project
 
PPTX
Querying Linked Data on Android
EUCLID project
 
PDF
20110728 datalift-rpi-troy
François Scharffe
 
PDF
Datalift a-catalyser-for-the-web-of-data-fosdem-05-02-2011
François Scharffe
 
PDF
Linked (Open) Data
Bernhard Haslhofer
 
PDF
Semantic Technologies in ST&DL
Andrea Nuzzolese
 
PPTX
Development of Semantic Web based Disaster Management System
NIT Durgapur
 
PDF
Phd presentation
Fabiana Lanotte
 
PDF
Tutorial "An Introduction to SPARQL and Queries over Linked Data" Chapter 3 (...
Olaf Hartig
 
PPTX
Efficient RDF Interchange (ERI) Format for RDF Data Streams
WU (Vienna University of Economics and Business)
 
PDF
Scaling the (evolving) web data –at low cost-
WU (Vienna University of Economics and Business)
 
PPTX
Alphabet soup: CDM, VRA, CCO, METS, MODS, RDF - Why Metadata Matters
New York University
 
PPTX
RDF-Gen: Generating RDF from streaming and archival data
Giorgos Santipantakis
 
PPT
Introduction | Categories for Description of Works of Art | CDWA-LITE
Kymberly Keeton
 
PDF
Web Data Management with RDF
M. Tamer Özsu
 
PPTX
Hack U Barcelona 2011
Peter Mika
 
PPT
euclid_linkedup WWW tutorial (Besnik Fetahu)
Besnik Fetahu
 
Triple Stores
Stephan Volmer
 
Trying SPARQL Anything with MEI
Enrico Daga
 
Big Linked Data - Creating Training Curricula
EUCLID project
 
Querying Linked Data on Android
EUCLID project
 
20110728 datalift-rpi-troy
François Scharffe
 
Datalift a-catalyser-for-the-web-of-data-fosdem-05-02-2011
François Scharffe
 
Linked (Open) Data
Bernhard Haslhofer
 
Semantic Technologies in ST&DL
Andrea Nuzzolese
 
Development of Semantic Web based Disaster Management System
NIT Durgapur
 
Phd presentation
Fabiana Lanotte
 
Tutorial "An Introduction to SPARQL and Queries over Linked Data" Chapter 3 (...
Olaf Hartig
 
Efficient RDF Interchange (ERI) Format for RDF Data Streams
WU (Vienna University of Economics and Business)
 
Scaling the (evolving) web data –at low cost-
WU (Vienna University of Economics and Business)
 
Alphabet soup: CDM, VRA, CCO, METS, MODS, RDF - Why Metadata Matters
New York University
 
RDF-Gen: Generating RDF from streaming and archival data
Giorgos Santipantakis
 
Introduction | Categories for Description of Works of Art | CDWA-LITE
Kymberly Keeton
 
Web Data Management with RDF
M. Tamer Özsu
 
Hack U Barcelona 2011
Peter Mika
 
euclid_linkedup WWW tutorial (Besnik Fetahu)
Besnik Fetahu
 

Similar to Linked Open Data Visualization (20)

PPTX
Session 1 and 2 "Challenges and Opportunities with Big Linked Data Visualiza...
Laura Po
 
PDF
Session 3 "Challenges and Opportunities with Big Linked Data Visualization" t...
Laura Po
 
PDF
Linked Data
Anja Jentzsch
 
PPTX
4V - WP3 Progress Report (TIN2013-46238)
Nandana Mihindukulasooriya
 
PDF
Creation of visualizations based on Linked Data
Alvaro Graves
 
PPTX
Linked Open Data and Applications
Victor de Boer
 
PPTX
Linked Open Data Utrecht University Library
Ruben Schalk
 
PPTX
LODeX: Schema Summarization and automatic SPARQL query generation for Linked ...
Fabio Benedetti
 
PPTX
The Web of Linked Data and its information
Alberto Nogales
 
PPTX
What Are Links in Linked Open Data? A Characterization and Evaluation of Link...
Armin Haller
 
PDF
Visualize open data with Plone - eea.daviz PLOG 2013
Antonio De Marinis
 
PDF
Linked Data Visualization 1st Edition Laura Po
krruciatanda
 
PDF
Linked Data (1st Linked Data Meetup Malmö)
Anja Jentzsch
 
PPTX
The Future of LOD
Ghislain ATEMEZING
 
PDF
Linked Data Visualization 1st Edition Laura Po
audinogibson
 
PPTX
LOD2: State of Play WP2 - Storing and Querying Very Large Knowledge Bases
LOD2 Creating Knowledge out of Interlinked Data
 
PPTX
A Visual Exploration Workflow as Enabler for the Exploitation of Linked Open ...
Laurens De Vocht
 
PPTX
Linked Data Tutorial (Florianópolis)
Oscar Corcho
 
PPTX
From Big Linked Data to Linked Big Data - DBpedia as a framework for data int...
giuseppe_futia
 
PPTX
Linked Open Data - Masaryk University in Brno 8.11.2016
Martin Necasky
 
Session 1 and 2 "Challenges and Opportunities with Big Linked Data Visualiza...
Laura Po
 
Session 3 "Challenges and Opportunities with Big Linked Data Visualization" t...
Laura Po
 
Linked Data
Anja Jentzsch
 
4V - WP3 Progress Report (TIN2013-46238)
Nandana Mihindukulasooriya
 
Creation of visualizations based on Linked Data
Alvaro Graves
 
Linked Open Data and Applications
Victor de Boer
 
Linked Open Data Utrecht University Library
Ruben Schalk
 
LODeX: Schema Summarization and automatic SPARQL query generation for Linked ...
Fabio Benedetti
 
The Web of Linked Data and its information
Alberto Nogales
 
What Are Links in Linked Open Data? A Characterization and Evaluation of Link...
Armin Haller
 
Visualize open data with Plone - eea.daviz PLOG 2013
Antonio De Marinis
 
Linked Data Visualization 1st Edition Laura Po
krruciatanda
 
Linked Data (1st Linked Data Meetup Malmö)
Anja Jentzsch
 
The Future of LOD
Ghislain ATEMEZING
 
Linked Data Visualization 1st Edition Laura Po
audinogibson
 
LOD2: State of Play WP2 - Storing and Querying Very Large Knowledge Bases
LOD2 Creating Knowledge out of Interlinked Data
 
A Visual Exploration Workflow as Enabler for the Exploitation of Linked Open ...
Laurens De Vocht
 
Linked Data Tutorial (Florianópolis)
Oscar Corcho
 
From Big Linked Data to Linked Big Data - DBpedia as a framework for data int...
giuseppe_futia
 
Linked Open Data - Masaryk University in Brno 8.11.2016
Martin Necasky
 
Ad

More from Laura Po (11)

PPTX
Towards sustainable mobility for citizens and the environment @ AI, HPC and B...
Laura Po
 
PPTX
Big data analytics for smart and sustainable city galway
Laura Po
 
PPTX
TRAFAIR - Premio PA sostenibile 2019 - slide di presentazione
Laura Po
 
PDF
TRAFAIR - Premio PA sostenibile 2019
Laura Po
 
PDF
Building an urban theft map by analyzing newspaper - SMAP 2018
Laura Po
 
PDF
Exploration, visualization and querying of linked open data sources
Laura Po
 
PDF
Introduction to linked data
Laura Po
 
PDF
Comparing topic models for a movie recommendation system webist2014
Laura Po
 
PPTX
An iPad Order Management System for Fashion Trade
Laura Po
 
PPTX
A Non-Intrusive Movie Recommendation System
Laura Po
 
PPTX
A meta language for mdx queries in e log business
Laura Po
 
Towards sustainable mobility for citizens and the environment @ AI, HPC and B...
Laura Po
 
Big data analytics for smart and sustainable city galway
Laura Po
 
TRAFAIR - Premio PA sostenibile 2019 - slide di presentazione
Laura Po
 
TRAFAIR - Premio PA sostenibile 2019
Laura Po
 
Building an urban theft map by analyzing newspaper - SMAP 2018
Laura Po
 
Exploration, visualization and querying of linked open data sources
Laura Po
 
Introduction to linked data
Laura Po
 
Comparing topic models for a movie recommendation system webist2014
Laura Po
 
An iPad Order Management System for Fashion Trade
Laura Po
 
A Non-Intrusive Movie Recommendation System
Laura Po
 
A meta language for mdx queries in e log business
Laura Po
 
Ad

Recently uploaded (20)

PDF
Driving Employee Engagement in a Hybrid World.pdf
Mia scott
 
PDF
Using AI/ML for Space Biology Research
VICTOR MAESTRE RAMIREZ
 
PDF
Technical-Report-GPS_GIS_RS-for-MSF-finalv2.pdf
KPycho
 
PPT
tuberculosiship-2106031cyyfuftufufufivifviviv
AkshaiRam
 
PDF
apidays Singapore 2025 - How APIs can make - or break - trust in your AI by S...
apidays
 
PPTX
03_Ariane BERCKMOES_Ethias.pptx_AIBarometer_release_event
FinTech Belgium
 
PPTX
SHREYAS25 INTERN-I,II,III PPT (1).pptx pre
swapnilherage
 
PPTX
apidays Singapore 2025 - The Quest for the Greenest LLM , Jean Philippe Ehre...
apidays
 
PPTX
apidays Singapore 2025 - Designing for Change, Julie Schiller (Google)
apidays
 
PPTX
apidays Singapore 2025 - Generative AI Landscape Building a Modern Data Strat...
apidays
 
PDF
apidays Singapore 2025 - The API Playbook for AI by Shin Wee Chuang (PAND AI)
apidays
 
PDF
apidays Singapore 2025 - Building a Federated Future, Alex Szomora (GSMA)
apidays
 
PPTX
Powerful Uses of Data Analytics You Should Know
subhashenia
 
PPTX
apidays Helsinki & North 2025 - From Chaos to Clarity: Designing (AI-Ready) A...
apidays
 
PPTX
05_Jelle Baats_Tekst.pptx_AI_Barometer_Release_Event
FinTech Belgium
 
PPTX
BinarySearchTree in datastructures in detail
kichokuttu
 
PPTX
apidays Singapore 2025 - From Data to Insights: Building AI-Powered Data APIs...
apidays
 
PPTX
apidays Helsinki & North 2025 - Agentic AI: A Friend or Foe?, Merja Kajava (A...
apidays
 
PPTX
How to Add Columns and Rows in an R Data Frame
subhashenia
 
PDF
Development and validation of the Japanese version of the Organizational Matt...
Yoga Tokuyoshi
 
Driving Employee Engagement in a Hybrid World.pdf
Mia scott
 
Using AI/ML for Space Biology Research
VICTOR MAESTRE RAMIREZ
 
Technical-Report-GPS_GIS_RS-for-MSF-finalv2.pdf
KPycho
 
tuberculosiship-2106031cyyfuftufufufivifviviv
AkshaiRam
 
apidays Singapore 2025 - How APIs can make - or break - trust in your AI by S...
apidays
 
03_Ariane BERCKMOES_Ethias.pptx_AIBarometer_release_event
FinTech Belgium
 
SHREYAS25 INTERN-I,II,III PPT (1).pptx pre
swapnilherage
 
apidays Singapore 2025 - The Quest for the Greenest LLM , Jean Philippe Ehre...
apidays
 
apidays Singapore 2025 - Designing for Change, Julie Schiller (Google)
apidays
 
apidays Singapore 2025 - Generative AI Landscape Building a Modern Data Strat...
apidays
 
apidays Singapore 2025 - The API Playbook for AI by Shin Wee Chuang (PAND AI)
apidays
 
apidays Singapore 2025 - Building a Federated Future, Alex Szomora (GSMA)
apidays
 
Powerful Uses of Data Analytics You Should Know
subhashenia
 
apidays Helsinki & North 2025 - From Chaos to Clarity: Designing (AI-Ready) A...
apidays
 
05_Jelle Baats_Tekst.pptx_AI_Barometer_Release_Event
FinTech Belgium
 
BinarySearchTree in datastructures in detail
kichokuttu
 
apidays Singapore 2025 - From Data to Insights: Building AI-Powered Data APIs...
apidays
 
apidays Helsinki & North 2025 - Agentic AI: A Friend or Foe?, Merja Kajava (A...
apidays
 
How to Add Columns and Rows in an R Data Frame
subhashenia
 
Development and validation of the Japanese version of the Organizational Matt...
Yoga Tokuyoshi
 

Linked Open Data Visualization

  • 1. Linked Data Visualization 3th Keystone Training School - Keyword Search in Big Linked Data Institute for Software Technology and Interactive Systems, TU Wien, Austria Laura Po, PhD Department of Engineering "Enzo Ferrari" University of Modena and Reggio Emilia Italy
  • 3. Goal of the Talk • To provide practical skills required for exploring LOD sources • The importance of visualization • How a Linked Data Visualization Process can be defined • Practical use of LOD/ RDF browsers and visualization toolkits Outline
  • 4. Why is visualization of Linked Data important? - Large and Dynamic Data - Efficiently and effectively handle billions of objects within dynamic datsets - Visual presentation and interaction issues - Offer ways to easly explore datasets - Proposing summaries and overviews - Incremental and progressive techniques - Variety of Users and Tasks
  • 5. BOLD – Big Open Linked Data "The bigger the number, the harder it can be to visualise" Bratsas et al (2016), Preface on special session “data impact: Big, open, linked data innovations” at 11th International Workshop on Semantic and Social Media Adaptation and Personalization (SMAP) https://doi.org/10.1109/SMAP.2016.7753368 Dwivedi et al, (2017) Driving innovation through big open linked data (BOLD): Exploring antecedents using interpretive structural, Inf Syst Front (2017) 19:197–212 https://link.springer.com/article/10.1007/s10796-016-9675-5 Saxena, (2017) BOLD (Big and Open Linked Data): what’s next?, Library Hi Tech News, Vol. 34 Issue: 5, pp.10-13, https://doi.org/10.1108/LHTN-04-2017-0020 Craig, (2016), BOLD: The power and potential of Big Open Linked Data, Published on 11 Oct 2016 on the Thomson Reuters Blog https://blogs.thomsonreuters.com/answerson/bold-power-potential-big-open-linked-data/
  • 6. Why visualize data instead of provide statistic analysis? http://en.wikipedia.org/wiki/Anscombe's_quartet • Anscombe's quartet of datasets having similar statistical properties but appearing very different when plotted
  • 8. LOD Visualization • LOD simplifies accessing and integrating data from different sources • SPARQL makes it easy to select from, and analyse the data • It's natural to visualise the data as graphs (networks) … but other forms of visualisation also possible
  • 9. RDF Graph Reference for the picture: http://www.obitko.com/tutorials/ontologies-semantic-web/rdf-graph-and-syntax.html
  • 10. Example of LOD visualization process
  • 11. Heatmap visualization of The Beatles releases
  • 12. LOD visualization systems They can be classified in 6 categories 1. Browsers and Exploratory systems 2. Generic visualization systems 3. Domain vocabulary & device specific systems 4. Graph-based visualization systems 5. Ontology visualization systems 6. Visualization libraries Bikakis and Sellis, (2016) Exploration and Visualization in the Web of Big Linked Data: A Survey of the State of the Art. Proceedings of the Workshops of the EDBT/ICDT 2016 Joint Conference, EDBT/ICDT Workshops 2016, Bordeaux, France, March 15, 2016 http://ceur- ws.org/Vol-1558/paper28.pdf
  • 13. Evolution over time Marie and Gandon, (2014) Survey of Linked Data Based Exploration Systems, Proceedings of the 3rd International Workshop on Intelligent Exploration of Semantic Data (IESD 2014) co-located with the 13th International Semantic Web Conference (ISWC 2014), Riva del Garda, Italy, October 20, 2014 http://ceur-ws.org/Vol-1279/iesd14_8.pdf
  • 14. Exploratory search • Exploratory search systems (ESS) forms a special category of seeking information on the Web with the purpose of revealing related information to the searcher along with retrievals of what have been searched for. Palagi, et al. (2017), A Survey of Definitions and Models of Exploratory Search. Proceedings of the 2017 ACM Workshop on Exploratory Search and Interactive Data Analytics. ACM, http://doi.acm.org/10.1145/3038462.3038465 Marie,(2015) , Linked data based exploratory search. PhD Thesis, Université Nice Sophia, Antipolis, https://tel.archives-ouvertes.fr/tel-01130622
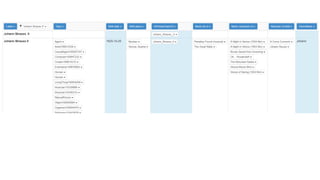
  • 16. Hoefler, Patrick, et al. "Linked Data Query Wizard: A Novel Interface for Accessing SPARQL Endpoints." LDOW. 2014. http://code-research.eu/ EU project 2012-2014 https://code.know-center.tugraz.at/search
  • 17. TEST • Using CODE Linked Data Query Wizard search for "Johann Strauss II" within the Dbpedia source • Explore the result • Add columns that show some property like "birth place", "given name", "music composer of ", ...
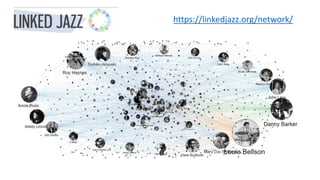
  • 20. TEST • Navigate the Linked Jazz cloud • Change the visualization option (fized, similar, gender, dynamic)
  • 21. LOD live LodLive project provides a demonstration of the use of Linked Data standards (RDF, SPARQL) to browse RDF resources. The application aims to spread linked data principles using a simple and friendly interface with reusable techniques. http://en.lodlive.it/ http://en.lodlive.it/?http://dbpedia.org/resource/Jules_Verne
  • 23. TEST By using LodLive online to explore dbpedia resources, search for Johann Strauss II http://en.lodlive.it/ - who is he? - where was he born? where did he died? - Is he the son of Johann Strauss? - find which type are associated to him
  • 25. LODmilla Micsik, András, Sándor Turbucz, and Zoltán Tóth. "Exploring publication metadata graphs with the LODmilla browser and editor." International Journal on Digital Libraries 16.1 (2015): 15-24. Micsik, András, Sándor Turbucz, and Zoltán Tóth. "Browsing and traversing linked data with lodmilla." ERCIM News 2014.96 (2014): 35-36. http://lodmilla.sztaki.hu/lodmilla
  • 26. TEST Using LODMilla search and add the following node from Dbpedia: • Johann Strauss II • Vienna • The Blue Danube • Austria • Johann Strauss I • Wolfgang Amadeus Mozart • Composer • Musician • Look at the connections between nodes
  • 27. LODEX It is a tool for producing a representative summary of a Linked open Data (LOD) source starting from scratch, thus supporting users in exploring and understanding the contents of a dataset. LODeX extracts statistical indexes that uses to build the representative summary, by quering the SPARQL endpoint of a LOD source. • LODeX 2.0 (http://www.dbgroup.unimo.it/lodex2 ) includes the possibility to compose visual queries by selecting objects from the representative summary of a LOD source • LODeX Cluster (http://www.dbgroup.unimo.it/lodex2/testCluster ) provides a more concise schema for huge datasets
  • 28. LODeX Architecture LOD Cloud SPARQL Queries LODeX Post- processing Statistical Indexes LODeX Indexes Extraction Endpoint URLs Schema Summary NoSQL SPARQL Queries Schema Summary Query Orchestrator Schema Summary Visualizzation Basic QueryResults Benedetti, et al. (2015), Exposing the Underlying Schema of LOD Sources. 2015 IEEE/WIC/ACM International Conference on Web Intelligence and Intelligent Agent Technology (WI-IAT) (IEEE) ISBN: 9781467396189 Benedetti, et al. (2015), Visual Querying LOD sources with LODeX. Proceedings of the 8th International Conference on Knowledge Capture (ACM) Benedetti, et al. (2015), LODeX: A tool for Visual Querying Linked Open Data. Proceedings of the ISWC 2015 Posters & Demonstrations Track @ (ISWC 2015), n. volume 1486 Benedetti, et al. (2014), A Visual Summary for Linked Open Data sources. ISWC 2014 Posters & Demo Track, Riva del Garda, Italy, ISSN: 1613-0073 Benedetti, et al. (2014), Online Index Extraction from Linked Open Data Sources. Second International Workshop on Linked Data for Information Extraction (LD4IE) @ (ISWC 2014), Riva del Garda, Italy, ISSN: 1613-0073
  • 29. A running example ex:Sector foaf:Organization owl:Class ex:sector “sector” rdf:type rdf:type rdf:Propertyrdf:type owl:ObjectProperty rdf:type sector1 organization1ex:sector dc:title “Energy” Extensional Classes Extensional Knowledge Intensional Knowledge ex:activity “Village electrification in the Pacific” organization2 “+41331231” rdfs:label rdfs:label rdfs:domain rdf:type ex:sector rdf:type rdf:type dbpedia:fax person1 foaf:Person ex:activity “Paolo” rdf:type ex:ceo rdf:type foaf:firstName foaf:lastName “Rossi” The information contained in the Intensional knowledge can be incomplete or absent
  • 30. Schema Summary – Building a Visual Query
  • 32. TEST By using Lodex http://www.dbgroup.unimore.it/lodex2/ find, navigate and explore the following datasets: • European Television Heritage • How many classes it has? How many properties it has? • How many vocabulary are used? • Nobel Prizes • How many vocabulary are used? • Define a query that select person (label, gender,name) that won a Nobel Prize , i.e.have an Award (year,label), add also the Category of the Award if it exists
  • 33. Conclusions • Analysis of the needs for visualization in the LOD context • Practical use of some LOD browsers and visualization toolkits • Navigation and exploration of some datasets and the construction of different visualizations
  • 34. Actual limitations and challenges • Most of the LOD visualization tools are still in-lab prototypes • Lots tools allow the exploration of a limited list of datasets or have limitations in terms of size, format (SPARQL endpoint/RDF dumps) of the datasets they can explore • SPARQL endpoints might be offline or have bad performance such as taking long time to respond to some queris. • For dealing with BOLD, graph simplification is needed: • reducing size could be possible through filtering or aggregation
  • 35. RDF Graph Aggregated View Schema Summary My vision
  • 36. Feel free to contact me at [email protected] You can find more information on my research and my group at www.dbgroup.unimore.it Slide are available on http://www.slideshare.net/polaura