Machine Learning in Static Analysis of Program Source Code
0 likes63 views

The document discusses the application of machine learning in static analysis of program source code, focusing on its potential benefits and limitations. It reviews various machine learning-based static analyzers like DeepCode, Infer, and CodeGuru, highlighting their capabilities and challenges in accurately identifying bugs and vulnerabilities. Despite the enthusiasm for machine learning, the authors convey skepticism about its practicality and reliability for certain diagnostic tasks compared to traditional analysis methods.


![1. Those which manually teach a static analyzer to search for various problems, using synthetic and
real code examples;
2. Those which teach algorithms on a large number of open source code and revision history (GitHub),
after which the analyzer will begin to detect bugs and even offer edits.
We will talk about each direction separately, as they have different drawbacks. After that, I think, readers
will get why we don't deny the possibilities of machine learning, but still don't share the enthusiasm.
Note. We look from the perspective of developing a universal static general purpose analyzer. We are
focused on developing the analyzer, which any team will be able to use, not the one focused on a specific
code base.
Manual Teaching of a Static Analyzer
Let's say we want to use ML to start looking for the following kinds of flaws in the code:
if (A == A)
It is strange to compare a variable with itself. We can write many examples of correct and incorrect code
and teach the analyzer to search for such errors. Additionally, you can add real examples of already found
bugs to the tests. Well, the question is where to find such examples. Ok, let's assume it's possible. For
example, we have a number of examples of such errors: V501, V3001, V6001.
So is it possible to identify such defects in code by using the ML algorithms? Yes, it is. The thing is - why do
we need it?
See, to teach the analyzer we'll need to spend a lot of efforts on preparing the examples for teaching.
Another option is to mark the code of real applications, indicating the fragments where the analyzer has to
issue a warning. In any case, a lot of work will need to be done, as there should be thousands of examples
for learning. Or tens of thousands.
After all, we want to detect not only (A == A) cases, but also:
• if (X && A == A)
• if (A + 1 == A + 1)
• if (A[i] == A[i])
• if ((A) == (A))
• and so on.](https://image.slidesharecdn.com/0706mlinstaticanalysis-210316191655/85/Machine-Learning-in-Static-Analysis-of-Program-Source-Code-12-320.jpg)
![Let's look at the potential implementation of such a simple diagnostic in PVS-Studio:
void RulePrototype_V501(VivaWalker &walker,
const Ptree *left, const Ptree *right, const Ptree *operation)
{
if (SafeEq(operation, "==") && SafeEqual(left, right))
{
walker.AddError("Oh boy! Holy cow!", left, 501, Level_1, "CWE-571");
}
}
And that's it! You don't need any base of examples for ML!
In the future, the diagnostic has to learn to take into account a number of exceptions and issue warnings for
(A[0] == A[1-1]). As we know, it can be easily programmed. On the contrary, in this case, things are going to
be bad with the base of examples.
Note that in both cases we'll need a system of testing, documentation and so on. As for labor contribution
on creating a new diagnostic, the classic approach, where the rule is rigidly programmed in the code, takes
the lead.
Ok, it's time for another rule. For example, the one where the result of some functions must be used. There
is no point in calling them and not using their result. Here are some of such functions:
• malloc
• memcmp
• string::empty
This is what the PVS-Studio V530 diagnostic does.
So what we want is to detect calls to such functions, whose result isn't used. To do this, you can generate a
lot of tests. And we think everything will work well. But again it is not clear why it is needed.](https://image.slidesharecdn.com/0706mlinstaticanalysis-210316191655/85/Machine-Learning-in-Static-Analysis-of-Program-Source-Code-13-320.jpg)
![The V530 diagnostic implementation with all exceptions took 258 lines of code in the PVS-Studio analyzer,
64 of which are comments. There is also a table with functions annotations, where it's noted that their
result must be used. It is much easier to top up this table than to create synthetic examples.
Things will get even worse with diagnostics that use data flow analysis. For example, the PVS-Studio
analyzer can track the value of pointers, which allows you to find such a memory leak:
uint32_t* BnNew() {
uint32_t* result = new uint32_t[kBigIntSize];
memset(result, 0, kBigIntSize * sizeof(uint32_t));
return result;
}
std::string AndroidRSAPublicKey(crypto::RSAPrivateKey* key) {
....
uint32_t* n = BnNew();
....
RSAPublicKey pkey;
pkey.len = kRSANumWords;
pkey.exponent = 65537; // Fixed public exponent
pkey.n0inv = 0 - ModInverse(n0, 0x100000000LL);
if (pkey.n0inv == 0)
return kDummyRSAPublicKey; // <=
....
}
The example is taken from the article "Chromium: Memory Leaks". If the condition (pkey.n0inv == 0) is true,
the function exits without freeing the buffer, the pointer to which is stored in the n variable.
From the PVS-Studio's point of view, there is nothing complicated here. The analyzer has studied the BnNew
function and remembered that it returned a pointer to the allocated memory block. In another function, it
noticed that the buffer might not free and the pointer to it gets lost at the moment of exiting the function.
It's a common algorithm of tracking values working. It doesn't matter how the code is written. It doesn't
matter what else is in the function that doesn't relate to the pointer work. The algorithm is universal and
the V773 diagnostic finds a lot of errors in various projects. See how different the code fragments with
detected errors are!
We aren't experts in ML, but we have a feeling that big problems are right around the corner here. There is
an incredible number of ways you can write code with memory leaks. Even if the machine learned well how
to track values of variables, it would need to understand that there are calls to functions as well.](https://image.slidesharecdn.com/0706mlinstaticanalysis-210316191655/85/Machine-Learning-in-Static-Analysis-of-Program-Source-Code-14-320.jpg)


![Take for example a function, such as _fread_nolock . Of course, it is used less frequently than fread. But
when you use it, you can make the same mistakes. For example, the buffer should be large enough. This size
should be no less than the result of multiplying the second and third argument. That is, you want to find
such incorrect code:
int buffer[10];
size_t n = _fread_nolock(buffer, size_of(int), 100, stream);
Here's what the annotation of this function looks like in PVS-Studio:
C_"size_t _fread_nolock"
"(void * _DstBuf, size_t _ElementSize, size_t _Count, FILE * _File);"
ADD(HAVE_STATE | RET_SKIP | F_MODIFY_PTR_1,
nullptr, nullptr, "_fread_nolock", POINTER_1, BYTE_COUNT, COUNT,
POINTER_2).
Add_Read(from_2_3, to_return, buf_1).
Add_DataSafetyStatusRelations(0, 3);
At first glance, such annotation may look difficult, but in fact, when you start writing them, it becomes
simple. Plus, it's write-only code. Wrote and forgot. Annotations change rarely.
Now let's talk about this function from the point of view of ML. GitHub won't help us. There are about
15,000 mentions of this function. There's even less good code. A significant part of the search results takes
up the following:
#define fread_unlocked _fread_nolock
What are the options?
1. Don't do anything. It's a way to nowhere.
2. Just imagine, teach the analyzer by writing hundreds of examples just for one function so that the
analyzer understands the interconnection between the buffer and oher arguments. Yes, you can do
that, but it's economically irrational. It's a dead-end street.
3. You can come up with a way similar to ours when the annotations to functions will be set manually.
It's a good, sensible way. That's just ML, which has nothing to do with it :). This is a throwback to the
classic way of writing static analyzers.
As you can see, ML and the long tail of the rarely used features don't go together.
At this point, there were people related to ML who objected and said that we hadn't taken into account the
option when the analyzer would learn all functions and make conclusions of what they were doing. Here,
apparently, either we don't understand the experts, or they don't get our point.
Bodies of functions may be unknown. For example, it could be a WinAPI-related function. If this is a rarely
used function, how will the analyzer understand what it is doing? We can fantasize that the analyzer will use
Google itself, find a description of the function, read and understand it. Moreover, it would have to draw
high-level conclusions from the documentation. The _fread_nolock description tells nothing about the
interconnection between the buffer, the second and the third argument. This comparison should be
deduced by artificial intelligence on its own, based on an understanding of the general principles of
programming and how the C++ language works. I think we should think about all this seriously in 20 years.
Bodies of functions may be available, but there may be no use from this. Let's look at a function, such as
memmove. It is often implemented in something like this:](https://image.slidesharecdn.com/0706mlinstaticanalysis-210316191655/85/Machine-Learning-in-Static-Analysis-of-Program-Source-Code-24-320.jpg)


Machine Learning in Static Analysis of Program Source Code
- 1. Machine Learning in Static Analysis of Program Source Code Author: Andrey Karpov, Victoria Khanieva Date: 16.01.2020 Tags: Knowledge, StaticAnalysis Machine learning has firmly entrenched in a variety of human fields, from speech recognition to medical diagnosing. The popularity of this approach is so great that people try to use it wherever they can. Some attempts to replace classical approaches with neural networks turn up unsuccessful. This time we'll consider machine learning in terms of creating effective static code analyzers for finding bugs and potential vulnerabilities. The PVS-Studio team is often asked if we want to start using machine learning to find bugs in the software source code. The short answer is yes, but to a limited extent. We believe that with machine learning, there are many pitfalls lurking in code analysis tasks. In the second part of the article, we will tell about them. Let's start with a review of new solutions and ideas.
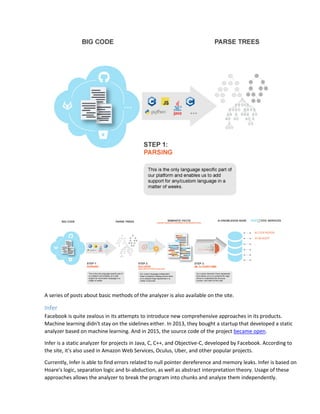
- 2. New Approaches Nowadays there are many static analyzers based on or using machine learning, including deep learning and NLP for error detection. Not only did enthusiasts double down on machine learning potential, but also large companies, for example, Facebook, Amazon, or Mozilla. Some projects aren't full-fledged static analyzers, as they only find some certain errors in commits. Interestingly, almost all of them are positioned as game changer products that will make a breakthrough in the development process due to artificial intelligence. Let's look at some of the well-known examples: 1. DeepCode 2. Infer, Sapienz, SapFix 3. Embold 4. Source{d} 5. Clever-Commit, Commit Assistant 6. CodeGuru DeepCode Deep Code is a vulnerability-searching tool for Java, JavaScript, TypeScript, and Python software code that features machine learning as a component. According to Boris Paskalev, more than 250,000 rules are already in place. This tool learns from changes, made by developers in the source code of open source projects (a million of repositories). The company itself says that their project is some kind of Grammarly for developers.
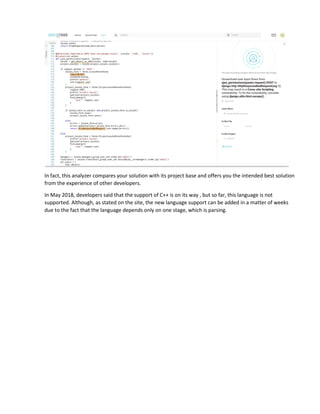
- 3. In fact, this analyzer compares your solution with its project base and offers you the intended best solution from the experience of other developers. In May 2018, developers said that the support of C++ is on its way , but so far, this language is not supported. Although, as stated on the site, the new language support can be added in a matter of weeks due to the fact that the language depends only on one stage, which is parsing.
- 4. A series of posts about basic methods of the analyzer is also available on the site. Infer Facebook is quite zealous in its attempts to introduce new comprehensive approaches in its products. Machine learning didn't stay on the sidelines either. In 2013, they bought a startup that developed a static analyzer based on machine learning. And in 2015, the source code of the project became open. Infer is a static analyzer for projects in Java, C, C++, and Objective-C, developed by Facebook. According to the site, it's also used in Amazon Web Services, Oculus, Uber, and other popular projects. Currently, Infer is able to find errors related to null pointer dereference and memory leaks. Infer is based on Hoare's logic, separation logic and bi-abduction, as well as abstract interpretation theory. Usage of these approaches allows the analyzer to break the program into chunks and analyze them independently.
- 5. You can try using Infer on your projects, but developers warn that while with Facebook projects it generates about 80% of useful warnings, a low number of false positives isn't guaranteed on other projects. Here are some errors that Infer can't detect so far, but developers are working on implementing these warnings: • array index out of bounds; • type casting exceptions; • unverified data leaks; • race condition. SapFix SapFix is an automated editing tool. It receives information from Sapienz, a testing automation tool, and the Infer static analyzer. Based on recent changes and messages, Infer selects one of several strategies to fix bugs. In some cases, SapFix rolls back all changes or parts of them. In other cases, it tries to solve the problem by generating a patch from its set of fixing patterns. This set is formed from patterns of fixes collected by programmers themselves from a set of fixes that were already made. If such a pattern doesn't fix an error, SapFix tries to adjust it to the situation by making small modifications in an abstract syntax tree until the potential solution is found. But one potential solution is not enough, so SapFix collects several solutions' on the grounds of a couple of points: whether there are compilation errors, whether it crashes, whether it introduces new crashes. Once the edits are fully tested, patches are reviewed by a programmer, who will decide which of the edits best solves the problem. Embold Embold is a start-up platform for static analysis of software source code that was called Gamma before the renaming. Static analyzer works based on the tool's own diagnostics, as well as using built-in analyzers, such as Cppcheck, SpotBugs, SQL Check and others.
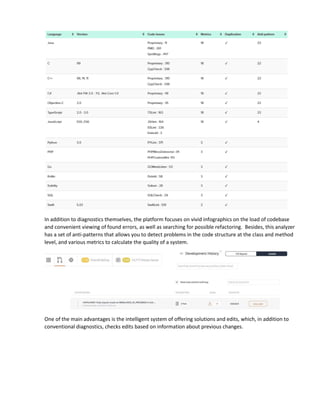
- 6. In addition to diagnostics themselves, the platform focuses on vivid infographics on the load of codebase and convenient viewing of found errors, as well as searching for possible refactoring. Besides, this analyzer has a set of anti-patterns that allows you to detect problems in the code structure at the class and method level, and various metrics to calculate the quality of a system. One of the main advantages is the intelligent system of offering solutions and edits, which, in addition to conventional diagnostics, checks edits based on information about previous changes.
- 7. With NLP, Embold breaks the code apart and searches for interconnections and dependencies between functions and methods, saving refactoring time. In this way, Embold basically offers convenient visualization of your source code analysis results by various analyzers, as well as by its own diagnostics, some of which are based on machine learning.
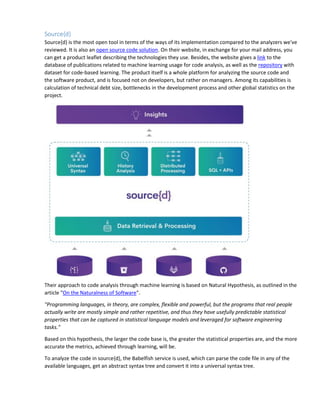
- 8. Source{d} Source{d} is the most open tool in terms of the ways of its implementation compared to the analyzers we've reviewed. It is also an open source code solution. On their website, in exchange for your mail address, you can get a product leaflet describing the technologies they use. Besides, the website gives a link to the database of publications related to machine learning usage for code analysis, as well as the repository with dataset for code-based learning. The product itself is a whole platform for analyzing the source code and the software product, and is focused not on developers, but rather on managers. Among its capabilities is calculation of technical debt size, bottlenecks in the development process and other global statistics on the project. Their approach to code analysis through machine learning is based on Natural Hypothesis, as outlined in the article "On the Naturalness of Software". "Programming languages, in theory, are complex, flexible and powerful, but the programs that real people actually write are mostly simple and rather repetitive, and thus they have usefully predictable statistical properties that can be captured in statistical language models and leveraged for software engineering tasks." Based on this hypothesis, the larger the code base is, the greater the statistical properties are, and the more accurate the metrics, achieved through learning, will be. To analyze the code in source{d}, the Babelfish service is used, which can parse the code file in any of the available languages, get an abstract syntax tree and convert it into a universal syntax tree.
- 9. However, source{d} doesn't search for errors in code. Based on the tree using ML on the entire project, source{d} detects code formatting, style applied in the project and in a commit. If the new code doesn't correspond to the project code style, it makes some edits.
- 10. Learning focuses on several basic elements: spaces, tabulation, line breaks, etc. Read more about this in their publication: "STYLE-ANALYZER: fixing code style inconsistencies with interpretable unsupervised algorithms". All in all, source{d} is a wide platform for collecting diverse statistics on the source code and the project development process: from efficiency calculations of developers to time costs for code review. Clever-Commit Clever-Commit is an analyzer created by Mozilla in collaboration with Ubisoft. It's based on a CLEVER (Combining Levels of Bug Prevention and Resolution Techniques) study by Ubisoft and its child product Commit Assistant, which detects suspicious commits that are likely to contain an error. Since CLEVER is based on code comparison, it can both point at dangerous code and make suggestions for possible edits. According to the description, in 60-70% of cases Clever-Commit finds problem places and offers correct edits with the same probability. In general, there is little information about this project and about the errors it is able to find. CodeGuru Recently CodeGuru, which is a product from Amazon, has fallen into line with analyzers using machine learning. It is a machine learning service that allows you to find errors in the code, as well as identify costly areas in it. The analysis is available only for Java code so far, but authors promise to support other languages in future. Although it was announced quite recently, Andy Jassy, CEO AWS (Amazon Web Services) says it has been used in Amazon for a long time. The website says that CodeGuru was learning on the Amazon code base, as well as on more than 10 000 open source projects. Basically, the service is divided into two parts: CodeGuru Reviewer, taught using the search for associative rules and looking for errors in code, and CodeGuru Profiler, monitoring performance of applications.
- 11. In general, there is not much available information about this project. As the website states, the Reviewer analyzes Amazon code bases and searches for pull requests, containing API AWS calls in order to learn how to catch deviations from "best practices". Next, it looks at the changes made and compares them to data from the documentation, which is analyzed at the same time. The result is a "best practices" model. It is also said that recommendations for user's code tend to improve after receiving feedback on them. The list of errors that Reviewer responds to is fairly blurred, as no specific error documentation has been published: • "Best Practices" AWS • Concurrency • Resource leaks • Leak of confidential information • General "best practices" of coding Our Skepticism Now let's consider error searching from the point of view of our team, which has been developing static analyzers for many years. We see a number of high-level problems of learning method application, which we'd like to cover. To begin with, we'll divide all ML approaches into two types:
- 12. 1. Those which manually teach a static analyzer to search for various problems, using synthetic and real code examples; 2. Those which teach algorithms on a large number of open source code and revision history (GitHub), after which the analyzer will begin to detect bugs and even offer edits. We will talk about each direction separately, as they have different drawbacks. After that, I think, readers will get why we don't deny the possibilities of machine learning, but still don't share the enthusiasm. Note. We look from the perspective of developing a universal static general purpose analyzer. We are focused on developing the analyzer, which any team will be able to use, not the one focused on a specific code base. Manual Teaching of a Static Analyzer Let's say we want to use ML to start looking for the following kinds of flaws in the code: if (A == A) It is strange to compare a variable with itself. We can write many examples of correct and incorrect code and teach the analyzer to search for such errors. Additionally, you can add real examples of already found bugs to the tests. Well, the question is where to find such examples. Ok, let's assume it's possible. For example, we have a number of examples of such errors: V501, V3001, V6001. So is it possible to identify such defects in code by using the ML algorithms? Yes, it is. The thing is - why do we need it? See, to teach the analyzer we'll need to spend a lot of efforts on preparing the examples for teaching. Another option is to mark the code of real applications, indicating the fragments where the analyzer has to issue a warning. In any case, a lot of work will need to be done, as there should be thousands of examples for learning. Or tens of thousands. After all, we want to detect not only (A == A) cases, but also: • if (X && A == A) • if (A + 1 == A + 1) • if (A[i] == A[i]) • if ((A) == (A)) • and so on.
- 13. Let's look at the potential implementation of such a simple diagnostic in PVS-Studio: void RulePrototype_V501(VivaWalker &walker, const Ptree *left, const Ptree *right, const Ptree *operation) { if (SafeEq(operation, "==") && SafeEqual(left, right)) { walker.AddError("Oh boy! Holy cow!", left, 501, Level_1, "CWE-571"); } } And that's it! You don't need any base of examples for ML! In the future, the diagnostic has to learn to take into account a number of exceptions and issue warnings for (A[0] == A[1-1]). As we know, it can be easily programmed. On the contrary, in this case, things are going to be bad with the base of examples. Note that in both cases we'll need a system of testing, documentation and so on. As for labor contribution on creating a new diagnostic, the classic approach, where the rule is rigidly programmed in the code, takes the lead. Ok, it's time for another rule. For example, the one where the result of some functions must be used. There is no point in calling them and not using their result. Here are some of such functions: • malloc • memcmp • string::empty This is what the PVS-Studio V530 diagnostic does. So what we want is to detect calls to such functions, whose result isn't used. To do this, you can generate a lot of tests. And we think everything will work well. But again it is not clear why it is needed.
- 14. The V530 diagnostic implementation with all exceptions took 258 lines of code in the PVS-Studio analyzer, 64 of which are comments. There is also a table with functions annotations, where it's noted that their result must be used. It is much easier to top up this table than to create synthetic examples. Things will get even worse with diagnostics that use data flow analysis. For example, the PVS-Studio analyzer can track the value of pointers, which allows you to find such a memory leak: uint32_t* BnNew() { uint32_t* result = new uint32_t[kBigIntSize]; memset(result, 0, kBigIntSize * sizeof(uint32_t)); return result; } std::string AndroidRSAPublicKey(crypto::RSAPrivateKey* key) { .... uint32_t* n = BnNew(); .... RSAPublicKey pkey; pkey.len = kRSANumWords; pkey.exponent = 65537; // Fixed public exponent pkey.n0inv = 0 - ModInverse(n0, 0x100000000LL); if (pkey.n0inv == 0) return kDummyRSAPublicKey; // <= .... } The example is taken from the article "Chromium: Memory Leaks". If the condition (pkey.n0inv == 0) is true, the function exits without freeing the buffer, the pointer to which is stored in the n variable. From the PVS-Studio's point of view, there is nothing complicated here. The analyzer has studied the BnNew function and remembered that it returned a pointer to the allocated memory block. In another function, it noticed that the buffer might not free and the pointer to it gets lost at the moment of exiting the function. It's a common algorithm of tracking values working. It doesn't matter how the code is written. It doesn't matter what else is in the function that doesn't relate to the pointer work. The algorithm is universal and the V773 diagnostic finds a lot of errors in various projects. See how different the code fragments with detected errors are! We aren't experts in ML, but we have a feeling that big problems are right around the corner here. There is an incredible number of ways you can write code with memory leaks. Even if the machine learned well how to track values of variables, it would need to understand that there are calls to functions as well.
- 15. We suspect it would require so many examples for learning that the task becomes ungraspable. We're not saying it's unrealistic. We doubt that the cost of creating the analyzer will pay off. Analogy. What comes to my mind is the analogy with a calculator, where instead of diagnostics, one has to program arithmetic actions. We are sure, that you can teach an ML based calculator to sum up numbers well by feeding it the results of operations 1+1=2, 1+2=3, 2+1=3, 100+200=300 and so on. As you understand, the feasibility of developing such a calculator is a big question (unless it is allocated a grant :). A much simpler, faster, more accurate and reliable calculator can be written using the simple operation "+" in the code. Conclusion Well, this way will work out. But using it, in our opinion, doesn't make practical sense. Development will be more time-consuming, but the result - less reliable and accurate, especially when it comes to implementing complex diagnostics based on data flow analysis. Learning on Large Amount of Open Source Code Okay, we've sorted out with manual synthetic examples, but there's also GitHub. You can track commit history and deduce code changing/fixing patterns. Then you can point not only at fragments of suspicious code, but even suggest a way to fix the code. If you stop at this detail level, everything looks good. The devil, as always, is in the details. So let's talk right about these details. The first nuance. Data source. GitHub edits are quite random and diverse. People are often lazy to make atomic commits and make several edits in the code at the same time. You know how it happens: you would fix the bug, and at the same time refactor it a bit ("And here I will add handling of such a case ..."). Even a person may then be incomprehensible, whether these fixed are related to each other, or not. The challenge is how to distinguish actual errors from adding new functionality or something else. You can, of course, get 1000 people who will manually mark the commits. People will have to point out: here an error was fixed, here is refactoring, here is some new functionality, here the requirements have changed and so on. Is such a markup possible? Yep! But notice how quickly the spoofing happens. Instead of "the algorithm learns itself on the basis of GitHub" we are already discussing how to puzzle hundreds of people for a long time. The work and cost of creating the tool is increasing dramatically. You can try to identify automatically where the bugs were fixed. To do this, you should analyze the comments to the commits, pay attention to small local edits, which most likely are those very bug fixes. It's hard to tell how well you can automatically search for error fixes. In any case, this is a big task that requires separate research and programming. So, we haven't even got to learning yet, and there are already nuances :). The second nuance. A lag in development. Analyzers that will learn based on such platforms, as GitHub will always be subject to such a syndrome, as "mental retardation delay". This is because programming languages change over time.
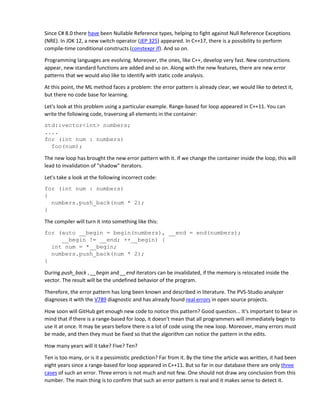
- 16. Since C# 8.0 there have been Nullable Reference types, helping to fight against Null Reference Exceptions (NRE). In JDK 12, a new switch operator (JEP 325) appeared. In C++17, there is a possibility to perform compile-time conditional constructs (constexpr if). And so on. Programming languages are evolving. Moreover, the ones, like C++, develop very fast. New constructions appear, new standard functions are added and so on. Along with the new features, there are new error patterns that we would also like to identify with static code analysis. At this point, the ML method faces a problem: the error pattern is already clear, we would like to detect it, but there no code base for learning. Let's look at this problem using a particular example. Range-based for loop appeared in C++11. You can write the following code, traversing all elements in the container: std::vector<int> numbers; .... for (int num : numbers) foo(num); The new loop has brought the new error pattern with it. If we change the container inside the loop, this will lead to invalidation of "shadow" iterators. Let's take a look at the following incorrect code: for (int num : numbers) { numbers.push_back(num * 2); } The compiler will turn it into something like this: for (auto __begin = begin(numbers), __end = end(numbers); __begin != __end; ++__begin) { int num = *__begin; numbers.push_back(num * 2); } During push_back , __begin and __end iterators can be invalidated, if the memory is relocated inside the vector. The result will be the undefined behavior of the program. Therefore, the error pattern has long been known and described in literature. The PVS-Studio analyzer diagnoses it with the V789 diagnostic and has already found real errors in open source projects. How soon will GitHub get enough new code to notice this pattern? Good question... It's important to bear in mind that if there is a range-based for loop, it doesn't mean that all programmers will immediately begin to use it at once. It may be years before there is a lot of code using the new loop. Moreover, many errors must be made, and then they must be fixed so that the algorithm can notice the pattern in the edits. How many years will it take? Five? Ten? Ten is too many, or is it a pessimistic prediction? Far from it. By the time the article was written, it had been eight years since a range-based for loop appeared in C++11. But so far in our database there are only three cases of such an error. Three errors is not much and not few. One should not draw any conclusion from this number. The main thing is to confirm that such an error pattern is real and it makes sense to detect it.
- 17. Now compare this number, for example, with this error pattern: pointer gets dereferenced before the check. In total, we have already identified 1,716 such cases when checking open-source projects. Perhaps we shouldn't look for errors in range-based for loops at all? No. It's just that programmers are inertial, and this operator is becoming popular very slowly. Gradually, there will be both more code with it and errors, respectively. This is likely to happen only 10-15 years after the C++11 appeared. This leads to a philosophical question. Suppose we already know the error pattern, we'll just wait for many years until we have many errors in open source projects. Will it be so? If "yes", it is safe to diagnose "mental development delay" for all ML based analyzers. If "no", what should we do? There are no examples. Write them manually? But in this way, we get back to the previous chapter, where we've given a detailed description of the option when people would write a whole pack of examples for learning. This can be done, but the question of expediency arises again. The implementation of the V789 diagnostic with all exceptions in the PVS-Studio analyzer takes only 118 lines of code, of which 13 lines are comments. That is, it is a very simple diagnostic, which can be easily programmed in a classic way. The situation will be similar to any other innovations that appear in any other languages. As they say, there is something to think about. The third nuance. Documentation. An important component of any static analyzer is the documentation describing each diagnostic. Without it, it will be extremely difficult or impossible to use the analyzer. In PVS-Studio documentation, we have a description of each diagnostic, which gives an example of erroneous code and how to fix it. We also give the link to CWE, where one can read an alternative problem description. And still, sometimes users don't understand something, and they ask us clarifying questions. In the case of ML based static analyzers, the documentation issue is somehow hushed up. It is assumed that the analyzer will simply point to a place that seems suspicious to it and may even suggest how to fix it. The decision to make an edit or not is up to the person. That's where the trouble begins... It is not easy to make a decision without being able to read, which makes the analyzer seem suspicious of a particular place in the code. Of course, in some cases, everything will be obvious. Suppose the analyzer points to this code: char *p = (char *)malloc(strlen(src + 1)); strcpy(p, src); And suggest that we replace it with: char *p = (char *)malloc(strlen(src) + 1); strcpy(p, src); It is immediately clear that the programmer made a typo and added 1 in the wrong place. As a result, less memory will be allocated than necessary. Here it's all clear even without documentation. However, this will not always be the case. Imagine that the analyzer "silently" points to this code:
- 18. char check(const uint8 *hash_stage2) { .... return memcmp(hash_stage2, hash_stage2_reassured, SHA1_HASH_SIZE); } And suggests that we change the char type of the return value for int: int check(const uint8 *hash_stage2) { .... return memcmp(hash_stage2, hash_stage2_reassured, SHA1_HASH_SIZE); } There is no documentation for the warning. Apparently, there won't be any text in the warning's message either, if we're talking about a completely independent analyzer. What shall we do? What's the difference? Is it worth making such a replacement? Actually, I could take a chance and agree to fix the code. Although agreeing to fixes without understanding them is a cruddy practice... :) You can look into the description of the memcmp function and find out that the function really returns values like int: 0, more than zero and less than zero. But it may still be unclear why make edits, if the code is already working well. Now, if you don't know what the edit is, check out the description of the V642 diagnostic. It immediately becomes clear that this is a real bug. Moreover, it can cause a vulnerability. Perhaps, the example seemed unconvincing. After all, the analyzer suggested a code that is likely to be better. Ok. Let's look at another example of pseudocode, this time, for a change, in Java. ObjectOutputStream out = new ObjectOutputStream(....); SerializedObject obj = new SerializedObject(); obj.state = 100; out.writeObject(obj); obj.state = 200; out.writeObject(obj); out.close(); There's an object. It's serializing. Then the state of the object changes, and it re-serializes. It looks fine. Now imagine that, all of a sudden, the analyzer doesn't like the code and it wants to replace it with the following: ObjectOutputStream out = new ObjectOutputStream(....); SerializedObject obj = new SerializedObject(); obj.state = 100; out.writeObject(obj); obj = new SerializedObject(); // The line is added obj.state = 200; out.writeObject(obj); out.close(); Instead of changing the object and rewriting it, a new object is created and it will be serialized. There is no description of the problem. No documentation. The code has become longer. For some reason, a new object is created. Are you ready to make such an edit in your code?
- 19. You'll say it's not clear. Indeed, it is incomprehensible. And it will be so all the time. Working with such a "silent" analyzer will be an endless study in an attempt to understand why the analyzer doesn't like anything. If there is documentation, everything becomes transparent. The class java.io.ObjectOuputStream that is used for serialization, caches the written objects. This means that the same object will not be serialized twice. The class serializes the object once, and the second time just writes in the stream a reference to the same first object. Read more: V6076 - Recurrent serialization will use cached object state from first serialization. We hope we managed to explain the importance of documentation. Here comes the question. How will the documentation for the ML based analyzer appear? When a classic code analyzer is developed, everything is simple and clear. There is a pattern of errors. We describe it in the documentation and implement the diagnostic. In the case of ML, the process is reverse. Yes, the analyzer can notice an anomaly in the code and point to it. But it knows nothing about the essence of the defect. It doesn't understand and won't tell you why you can't write code like that. These are too high-level abstractions. This way, the analyzer should also learn to read and understand documentation for functions. As I said, since the documentation issue is avoided in articles on machine learning, we are not ready to dwell on it further. Just another big nuance that we've spoken out. Note. You could argue that documentation is optional. The analyzer can refer to many examples of fixes on GitHub and the person, looking through the commits and comments to them, will understand what is what. Yes, it is so. But the idea doesn't look attractive. Here the analyzer is the bad dude, which will rather puzzle a programmer than help him. Fourth nuance. Highly specialized languages. The approach described is not applicable to highly specialized languages, for which static analysis can also be extremely useful. The reason is that GitHub and other sources simply don't have a large enough source code base to provide effective learning. Let's look at this using a concrete example. First, let's go to GitHub and search for repositories for the popular Java language. Result: language:"Java": 3,128,884 available repository results Now take the specialized language "1C Enterprise" used in accounting applications produced by the Russian company 1C. Result: language:"1C Enterprise": 551 available repository results Maybe analyzers are not needed for this language? No, they are. There is a practical need to analyze such programs and there are already appropriate analyzers. For example, there is SonarQube 1C (BSL) Plugin, produced by the company "Silver Bullet". I think no specific explanations are needed as to why ML approach will be difficult for specialized languages. The fifth nuance. C, C++, #include.
- 20. Articles on ML-based static code analysis are mostly about such languages such as Java, JavaScript, and Python. This is explained by their extreme popularity. As for C and C++, they are kind of ignored, even though you can't call them unpopular. We suggest that it's not about their popularity/promising outlook, but it's about the problems with C and C++ languages. And now we're going to bring one uncomfortable problem out to the light. An abstract c/cpp file can be very difficult to compile. At least you can't load a project from GitHub, choose a random cpp file and just compile it. Now we will explain what all this has to do with ML. So we want to teach the analyzer. We downloaded a project from GitHub. We know the patch and assume it fixes the bug. We want this edit to be one example for learning. In other words, we have a .cpp file before and after editing. That's where the problem begins. It's not enough just to study the fixes. Full context is also required. You need to know the declaration of the classes used, you need to know the prototypes of the functions used, you need to know how macros expand and so on. And to do this, you need to perform full file preprocessing. Let's look at the example. At first, the code looked like this: bool Class::IsMagicWord() { return m_name == "ML"; } It was fixed in this way: bool Class::IsMagicWord() { return strcmp(m_name, "ML") == 0; } Should the analyzer start learning in order to suggest (x == "y") replacement for strcmp(x, "y")? You can't answer that question without knowing how the m_name member is declared in the class. There might be, for example, such options: class Class { .... char *m_name; }; class Class { .... std::string m_name; }; Edits will be made in case if we're talking about an ordinary pointer. If we don't take into account the variable type, the analyzer might learn to issue both good and bad warnings (for the case with std::string). Class declarations are usually located in header files. Here were face the need to perform preprocessing to have all necessary information. It's extremely important for C and C++.
- 21. If someone says that it is possible to do without preprocessing, he is either a fraud, or is just unfamiliar with C or C++ languages. To gather all the necessary information, you need correct preprocessing. To do this, you need to know where and what header files are located, which macros are set during the build process. You also need to know how a particular cpp file is compiled. That's the problem. One doesn't simply compile the file (or, rather, specify the key to the compiler so that it generates a preprocess file). We need to figure out how this file is compiled. This information is in the build scripts, but the question is how to get it from there. In general, the task is complicated. Moreover, many projects on GitHub are a mess. If you take an abstract project from there, you often have to tinker to compile it. One day you lack a library and you need to find and download it manually. Another day some kind of a self-written build system is used, which has to be dealt with. It could be anything. Sometimes the downloaded project simply refuses to build and it needs to be somehow tweaked. You can't just take and automatically get preprocessed (.i) representation for .cpp files. It can be tricky even when doing it manually. We can say, well, the problem with non-building projects is understandable, but not crucial. Let's only work with projects that can be built. There is still the task of preprocessing a particular file. Not to mention the cases when we deal with some specialized compilers, for example, for embedded systems. After all, the problem described is not insurmountable. However, all this is very difficult and labor-intensive. In case of C and C++, source code located on GitHub does nothing. There's a lot of work to be done to learn how to automatically run compilers. Note. If the reader still doesn't get the depth of the problem, we invite you to take part in the following experiment. Take ten mid-sized random projects from GitHub and try to compile them and then get their preprocessed version for .cpp files. After that, the question about the laboriousness of this task will disappear :).
- 22. There may be similar problems with other languages, but they are particularly obvious in C and C++. Sixth nuance. The price of eliminating false positives. Static analyzers are prone to generating false positives and we have to constantly refine diagnostics to reduce the number of false warnings. Now we'll get back to the previously considered V789 diagnostic, detecting container changes inside the range-based for loop. Let's say we weren't careful enough when writing it, and the client reports a false positive. He writes that the analyzer doesn't take into account the scenario when the loop ends after the container is changed, and therefore there is no problem. Then he gives the following example of code where the analyzer gives a false positive: std::vector<int> numbers; .... for (int num : numbers) { if (num < 5) { numbers.push_back(0); break; // or, for example, return } } Yes, it's a flaw. In a classic analyzer, its elimination is extremely fast and cheap. In PVS-Studio, the implementation of this exception consists of 26 lines of code. This flaw can also be corrected when the analyzer is built on learning algorithms. For sure, it can be taught by collecting dozens or hundreds of examples of code that should be considered correct. Again, the question is not in feasibility, but in practical approach. We suspect that fighting against specific false positives, which bother clients, is far more costly in case of ML. That is, customer support in terms of eliminating false positives will cost more money. Seventh nuance. Rarely used features and long tail. Previously, we've grappled with the problem of highly specialized languages, for which may not be enough source code for learning. A similar problem takes place with rarely used functions (system ones, WinAPI, from popular libraries, etc.). If we're talking about such functions from the C language, as strcmp, then there is actually a base for learning. GitHub, available code results: • strcmp - 40,462,158 • stricmp - 1,256,053 Yes, there are many examples of usage. Perhaps the analyzer will learn to notice, for example, the following patterns: • It is strange if the string is compared with itself. It gets fixed. • It's strange if one of the pointers is NULL. It gets fixed. • It is strange that the result of this function is not used. It gets fixed. • And so on.
- 23. Isn't it cool? No. Here we face the "long tail" problem. Very briefly the point of the "long tail" in the following. It is impractical to sell only the Top50 of the most popular and now-read books in a bookstore. Yes, each such book will be purchased, say, 100 times more often than books not from this list. However, most of the proceeds will be made up of other books that, as they say, find their reader. For example, an online store Amazon.com receives more than half of the profits from what is outside of 130,000 "most popular items". There are popular functions and there are few of them. There are unpopular, but there are many of them. For example, there are the following variations of the string comparison function: • g_ascii_strncasecmp - 35,695 • lstrcmpiA - 27,512 • _wcsicmp_l - 5,737 • _strnicmp_l - 5,848 • _mbscmp_l - 2,458 • and others. As you can see, they are used much less frequently, but when you use them, you can make the same mistakes. There are too few examples to identify patterns. However, these functions can't be ignored. Individually, they are rarely used, but a lot of code is written with their use, which is better be checked. That's where the "long tail" shows itself. At PVS-Studio, we manually annotate features. For example, by the moment about 7,200 functions had been annotated for C and C++. This is what we mark: • WinAPI • Standard C Library , • Standard Template Library (STL), • glibc (GNU C Library) • Qt • MFC • zlib • libpng • OpenSSL • and others. On the one hand, it seems like a dead-end way. You can't annotate everything. On the other hand, it works. Now here is the question. What benefits can ML have? Significant advantages aren't that obvious, but you can see the complexity. You could argue that algorithms built on ML themselves will find patterns with frequently used functions and they don't have to be annotated. Yes, it's true. However, there is no problem to independently annotate such popular functions as strcmp or malloc. Nonetheless, the long tail causes problems. You can teach by making synthetic examples. However, here we go back to the article part, where we were saying that it was easier and faster to write classic diagnostics, rather than generate many examples.
- 24. Take for example a function, such as _fread_nolock . Of course, it is used less frequently than fread. But when you use it, you can make the same mistakes. For example, the buffer should be large enough. This size should be no less than the result of multiplying the second and third argument. That is, you want to find such incorrect code: int buffer[10]; size_t n = _fread_nolock(buffer, size_of(int), 100, stream); Here's what the annotation of this function looks like in PVS-Studio: C_"size_t _fread_nolock" "(void * _DstBuf, size_t _ElementSize, size_t _Count, FILE * _File);" ADD(HAVE_STATE | RET_SKIP | F_MODIFY_PTR_1, nullptr, nullptr, "_fread_nolock", POINTER_1, BYTE_COUNT, COUNT, POINTER_2). Add_Read(from_2_3, to_return, buf_1). Add_DataSafetyStatusRelations(0, 3); At first glance, such annotation may look difficult, but in fact, when you start writing them, it becomes simple. Plus, it's write-only code. Wrote and forgot. Annotations change rarely. Now let's talk about this function from the point of view of ML. GitHub won't help us. There are about 15,000 mentions of this function. There's even less good code. A significant part of the search results takes up the following: #define fread_unlocked _fread_nolock What are the options? 1. Don't do anything. It's a way to nowhere. 2. Just imagine, teach the analyzer by writing hundreds of examples just for one function so that the analyzer understands the interconnection between the buffer and oher arguments. Yes, you can do that, but it's economically irrational. It's a dead-end street. 3. You can come up with a way similar to ours when the annotations to functions will be set manually. It's a good, sensible way. That's just ML, which has nothing to do with it :). This is a throwback to the classic way of writing static analyzers. As you can see, ML and the long tail of the rarely used features don't go together. At this point, there were people related to ML who objected and said that we hadn't taken into account the option when the analyzer would learn all functions and make conclusions of what they were doing. Here, apparently, either we don't understand the experts, or they don't get our point. Bodies of functions may be unknown. For example, it could be a WinAPI-related function. If this is a rarely used function, how will the analyzer understand what it is doing? We can fantasize that the analyzer will use Google itself, find a description of the function, read and understand it. Moreover, it would have to draw high-level conclusions from the documentation. The _fread_nolock description tells nothing about the interconnection between the buffer, the second and the third argument. This comparison should be deduced by artificial intelligence on its own, based on an understanding of the general principles of programming and how the C++ language works. I think we should think about all this seriously in 20 years. Bodies of functions may be available, but there may be no use from this. Let's look at a function, such as memmove. It is often implemented in something like this:
- 25. void *memmove (void *dest, const void *src, size_t len) { return __builtin___memmove_chk(dest, src, len, __builtin_object_size(dest, 0)); } What is __builtin___memmove_chk? This is an intrinsic function that the compiler itself is already implementing. This function doesn't have the source code. Or memmove might look something like this: the first assembly version. You can teach the analyzer to understand different assembly options, but such approach seems wrong. Ok, sometimes bodies of functions are really known. Moreover, we know bodies of functions in user's code as well. It would seem that in this case ML gets enormous advantages by reading and understanding what all these functions do. However, even in this case we are full of pessimism. This task is too complex. It's complicated even for a human. Think of how hard it is for you to understand the code you didn't write. If it is difficult for a person, why should this task be easy for an AI? Actually, AI has a big problem in understanding high-level concepts. If we are talking about understanding the code, we can't do without the ability to abstract from the details of implementation and consider the algorithm at a high level. It seems that this discussion can be postponed for 20 years as well. Other nuances There are other points that should also be taken into account, but we haven't gone deep into them. By the way, the article turns out to be quite long. Therefore, we will briefly list some other nuances, leaving them for reader's reflection. • Outdated recommendations. As mentioned, languages change, and recommendations for their use change, respectively. If the analyzer learns on old source code, it might start issuing outdated recommendations at some point. Example. Formerly, C++ programmers have been recommended using auto_ptr instead of half-done pointers. This smart pointer is now considered obsolete and it is recommended that you use unique_ptr. • Data models. At the very least, C and C++ languages have such a thing as a data model. This means that data types have different number of bits across platforms. If you don't take this into account, you can incorrectly teach the analyzer. For example, in Windows 32/64 the long type always has 32 bits. But in Linux, its size will vary and take 32/64 bits depending on the platform's number of bits. Without taking all this into account, the analyzer can learn to miscalculate the size of the types and structures it forms. But the types also align in different ways. All this, of course, can be taken into account. You can teach the analyzer to know about the size of the types, their alignment and mark the projects (indicate how they are building). However, all this is an additional complexity, which is not mentioned in the research articles. • Behavioral unambiguousness. Since we're talking about ML, the analysis result is more likely to have probabilistic nature. That is, sometimes the erroneous pattern will be recognized, and sometimes not, depending on how the code is written. From our experience, we know that the user is extremely irritated by the ambiguity of the analyzer's behavior. He wants to know exactly which pattern will be considered erroneous and which will not, and why. In the case of the classical analyzer developing approach, this problem is poorly expressed. Only sometimes we need to explain our clients why there is a/there is no analyzer warning and how the algorithm works, what exceptions are handled in it. Algorithms are clear and everything can always be easily explained. An
- 26. example of this kind of communication: "False Positives in PVS-Studio: How Deep the Rabbit Hole Goes". It's not clear how the described problem will be solved in the analyzers built on ML. Conclusions We don't deny the prospects of the ML direction, including its application in terms of static code analysis. ML can be potentially used in typos finding tasks, when filtering false positives, when searching for new (not yet described) error patterns and so on. However, we don't share the optimism that permeates the articles devoted to ML in terms of code analysis. In this article, we've outlined a few issues that one will have to work on if he's going to use ML. The described nuances largely negate the benefits of the new approach. In addition, the old classical approaches of analyzers implementation are more profitable and more economically feasible. Interestingly, the adherents' articles of the ML methodology don't mention these pitfalls. Well, nothing new. ML is provokes certain hype and probably we shouldn't expect balanced assessment from its apologists concerning ML applicability in static code analysis tasks. From our point of view, machine learning will fill a niche in technologies, used in static analyzers along with control flow analysis, symbolic executions and others. The methodology of static analysis may benefit from the introduction of ML, but don't exaggerate the possibilities of this technology. P.S. Since the article is generally critical, some might think that we fear the new and as Luddites turned against ML for fear of losing the market for static analysis tools.
- 27. No, we're not afraid. We just don't see the point in spending money on inefficient approaches in the development of the PVS-Studio code analyzer. In one form or another, we will adopt ML. Moreover, some diagnostics already contain elements of self-learning algorithms. However, we will definitely be very conservative and take only what will clearly have a greater effect than the classic approaches, built on loops and ifs :). After all, we need to create an effective tool, not work off a grant :). The article is written for the reason that more and more questions are asked on the topic and we wanted to have an expository article that puts everything in its place. Thank you for your attention. We invite you to read the article "Why You Should Choose the PVS-Studio Static Analyzer to Integrate into Your Development Process".