SlideShare a Scribd company logo
Clustering
What is Clustering?
K-Means Clustering
Flowchart to understand K-means Clustering
Clustering of cars based on brands
Logistic Regression
What’s in it for you?
What is Logistic Regression?
Logistic Regression Curve & Sigmoid function
Classify whether a tumor is malignant or benign
based on features
Cover/transition slides
will be changed
Clustering
Suppose, we
have a pile of
books of
different genres!
Clustering
Now, we divide them into different groups like
Fiction
Horror
Educational
Well, organizing objects
into groups based on
their similarity is
Clustering!
Well, organizing objects
into groups based on
their similarity is
Clustering!
K-means Clustering
K-Means Clustering is an
example of Unsupervised
learning
K-Means Clustering is an
example of Unsupervised
learning
It is used when you have
unlabeled data!
K-Means Clustering is an
example of Unsupervised
learning
It is used when you have
unlabeled data!
To find clusters in the data
based on feature similarity!
Steps for K-Means
Suppose we have these data
points and we want to assign
them into clusters
STEP 1: Initialize Cluster Centroids
We pick ‘K’ clusters & assign random centroids to clusters
STEP 1: Initialize Cluster Centroids
We pick ‘K’ clusters & assign random centroids to clusters
Then, we compute distance from objects to centroids
STEP 2: Compute Minimum Distance
Now, we form new clusters based on minimum distance and calculate
their centroids
STEP 3: Assign Points to New Clusters
Repeat previous two steps iteratively till the cluster centroids stop
changing their positions and become static
STEP 3: Assign Points to New Clusters
Repeat previous two steps iteratively till the cluster centroids stop
changing their positions and become static
Shall we see a flowchart to
understand?
Flowchart to understand K-Means
Choose K (Elbow Method)
START
Assign random centroids to clusters
Compute distance from objects to centroids
Yes
Form new clusters based on minimum distance and calculate their centroids
Compute distance from objects to new centroids
Repeat until
no
observations
change
groups
Let’s see an example!
K-Means Algorithm
Subject A B
1 1 1
2 1.5 2
3 3 4
4 5 7
5 3.5 5
6 4.5 5
7 3.5 4.5
Suppose, we have this dataset of 7 individuals and their
score on two topics (A and B)
K-Means Algorithm
Now, lets take two farthest-apart points as initial cluster
centroids
Subject A B
1 1 1
2 1.5 2
3 3 4
4 5 7
5 3.5 5
6 4.5 5
7 3.5 4.5
K-Means Algorithm
Now, lets take two farthest-apart points as initial cluster
centroids
K-Means Algorithm
Each point is then assigned to the closest cluster with
respect to their distance from the centroids Cluster 1
Cluster 2
K-Means Algorithm
Now, we again calculate the centroids of each cluster:
Individual
Mean Vector
(centroid)
Cluster 1 1, 2, 3 (1.8, 2.3)
Cluster 2 4, 5, 6, 7 (4.1, 5.4)
Cluster 1
Cluster 2
K-Means Algorithm
We compare each individual’s distance to its own cluster mean and to
that of the opposite cluster. And we find:
Individual
Distance to mean
(centroid) of Cluster
1
Distance to mean
(centroid) of
Cluster 2
1 1.5 5.4
2 0.4 4.3
3 2.1 1.8
4 5.7 1.8
5 3.2 0.7
6 3.8 0.6
7 2.8 1.1
Using Eucledian Distance
between the points and the
mean
Cluster 1
Cluster 2
K-Means Algorithm
Individual
Distance to mean
(centroid) of Cluster
1
Distance to mean
(centroid) of
Cluster 2
1 1.5 5.4
2 0.4 4.3
3 2.1 1.8
4 5.7 1.8
5 3.2 0.7
6 3.8 0.6
7 2.8 1.1
Only individual 3 is nearer to the mean of the opposite cluster (Cluster 2)
than its own (Cluster 1)
Cluster 1
Cluster 2
Moving point 3 to new
cluster
K-Means Algorithm
Thus, individual 3 is relocated to Cluster 2 resulting in the new partition:
Individual
Distance to mean
(centroid) of Cluster
1
Distance to mean
(centroid) of
Cluster 2
1 1.5 5.4
2 0.4 4.3
3 2.1 1.8
4 5.7 1.8
5 3.2 0.7
6 3.8 0.6
7 2.8 1.1
Cluster 1
Cluster 2
K-Means Algorithm
For the new clusters, we will find the actual cluster
centroids:
Individual
Mean Vector
(centroid)
Cluster 1 1, 2, 3 (1.25, 1.5)
Cluster 2 4, 5, 6, 7 (3.9, 5.1)
Cluster 1
Cluster 2
K-Means Algorithm
On comparing the distance of each individual’s distance
to it’s own cluster mean and to that of the opposite cluster,
we find that the data points are stable, hence we have our
final clusters!
Cluster 1
Cluster 2
K-Means Algorithm
To find appropriate number of clusters in a dataset, we use elbow method:
WSS
No . of. clusters
Elbow point
Within sum of squares (WSS) is defined
as the sum of the squared distance
between each member of the cluster and
its centroid
Finding the optimal number of clusters using
the elbow of the graph is called as the Elbow
method
Use Case
Using K-means clustering to cluster cars into brands using the
parameters such as horsepower, cubic inches, make year, etc.
Dataset: Cars data having information about 3 brands of cars namely
Toyota, Honda, Nissan
Use Case
Use Case
Use Case
Use Case
Use Case
Use Case
Use Case
Use Case
Use Case
Clustering
Today, we’ll dive into K-
means Clustering!
Well, organizing objects
into groups based on
their similarity is
Clustering!
Logistic Regression
Logistic Regression
Now, let’s look into
Logistic Regression
Logistic Regression
The Logistic Regression algorithm is the
simplest classification algorithm used for
binary or multi-classification problems
Logistic Regression
To brush up,
y = mx+c
The dependent variable is the
target class variable we are
going to predict
In the previous tutorial, we learnt about Linear Regression, dependent and independent variables
Logistic Regression
In the previous tutorial, we learnt about Linear Regression, dependent and independent variables
The independent variables
(x1…xn) are the features or
attributes we are going to use to
predict the target class
To brush up,
y = mx+c
The dependent variable is the
target class variable we are
going to predict
Logistic Regression
1
0
Marks
No. of hours studied
We know what a
linear regression
looks like, but using
this graph we
cannot divide the
outcome into
categories
100
Logistic Regression
100
0
We know what a
linear regression
looks like, but using
this graph we
cannot divide the
outcome into
categories
For example, a linear regression graph can
tell us that with increase in number of hours
studied, the marks of a student will
increase
But, it will not tell us whether the student
will pass or not!
Marks
No. of hours studied
Logistic Regression
In such cases, where we need the output
as categorical value, we will use logistic
regression! 100
0
No. of hours studied
Marks
Logistic Regression
0
100 1
0
Sigmoid
Curve
Sigmoid Function
y = m*x + c
p =
1
1 + ⅇ
− y
p
ln (
1-p
) = m*x + c
No. of hours studied No. of hours studied
Marks
Marks
Logistic Regression
0
0.2
0.4
0.6
0.8
1
1.2
0 1 2 3 4 5 6 7 8 9
Logistic Regression
Threshold value
Probability > 0.50
Value is rounded off to 1 indicating that the
student will pass
Probability < 0.50 , the value is
rounded off to 0 indicating that the
student will fail
0.30
0.82
Problem statement: To classify whether a
tumor is ‘malignant’ or ‘benign’
Use Case
Use Case
Use Case
Use Case
Use Case
Use Case
Use Case
Use Case
Use Case
Use Case
So, this model is
able to predict the
type of tumor with
91% accuracy!
Finally, let’s discuss the answers to the quiz asked in
Machine Learning Tutorial Part-1
for the instructor
What do you understand from Measures and Dimensions?
Each field from the data source is automatically assigned a
datatype (such as string, integer) and a role (dimension or
measure)
Aggregation applied on measures is ‘Sum’ by default but you
can always change the default aggregation in the settings
Can you tell what’s happening in the
following cases?
A. Grouping documents into different categories based on the
topic and content of each document
“This is an example of Clustering where K-means
clustering can be used to group the documents by
topics using bag-of-words approach”
What do you understand from Measures and Dimensions?
Each field from the data source is automatically assigned a
datatype (such as string, integer) and a role (dimension or
measure)
Aggregation applied on measures is ‘Sum’ by default but you
can always change the default aggregation in the settings
Can you tell what’s happening in the
following cases?
B. Identifying hand-written digits in images correctly
“This is an example of Classification. The traditional
approach to solving this would be to extract digit
dependent features like curvature of different digits,
etc. and then use a classifier like SVM to distinguish
between images”
What do you understand from Measures and Dimensions?
Each field from the data source is automatically assigned a
datatype (such as string, integer) and a role (dimension or
measure)
Aggregation applied on measures is ‘Sum’ by default but you
can always change the default aggregation in the settings
Can you tell what’s happening in the
following cases?
C. Behavior of a website indicating that the site is not working
as designed
“This is an example of Anomaly Detection. In this case,
the algorithm learns what is "normal" and what is "not
normal", usually by observing the logs of the website”
What do you understand from Measures and Dimensions?
Each field from the data source is automatically assigned a
datatype (such as string, integer) and a role (dimension or
measure)
Aggregation applied on measures is ‘Sum’ by default but you
can always change the default aggregation in the settings
Can you tell what’s happening in the
following cases?
D. Predicting salary of an individual based his/her years
of experience
“This is an example of Regression. This problem can
be mathematically defined as a function between
independent (years of experience) and dependent
variable (salary of an individual)”
Summary
What is K-Means Elbow Method to choose K Clustering cars with K-means
Classifying tumor with logisticWhat is logistic regression
Machine Learning Tutorial Part - 2 | Machine Learning Tutorial For Beginners Part - 2 | Simplilearn

More Related Content

What's hot (20)

PPTX
Supervised and Unsupervised Learning In Machine Learning | Machine Learning T...
Simplilearn
 
PPTX
Machine Learning Tutorial | Machine Learning Basics | Machine Learning Algori...
Simplilearn
 
PDF
What is Machine Learning | Introduction to Machine Learning | Machine Learnin...
Simplilearn
 
PDF
Machine learning
Dr Geetha Mohan
 
PPTX
Machine learning
Saurabh Agrawal
 
PPTX
Naive Bayes Classifier | Naive Bayes Algorithm | Naive Bayes Classifier With ...
Simplilearn
 
PDF
Machine Learning: Applications, Process and Techniques
Rui Pedro Paiva
 
PDF
Machine Learning in 10 Minutes | What is Machine Learning? | Edureka
Edureka!
 
PDF
Scikit Learn Tutorial | Machine Learning with Python | Python for Data Scienc...
Edureka!
 
PPTX
Machine learning
eonx_32
 
PPT
Machine Learning
Vivek Garg
 
PDF
Data science
Mohamed Loey
 
PPTX
Logistic Regression | Logistic Regression In Python | Machine Learning Algori...
Simplilearn
 
PPTX
Data Science With Python | Python For Data Science | Python Data Science Cour...
Simplilearn
 
PPTX
Machine Learning Algorithms | Machine Learning Tutorial | Data Science Algori...
Simplilearn
 
PPTX
Introduction to machine learning
Koundinya Desiraju
 
PDF
Machine Learning Ml Overview Algorithms Use Cases And Applications
SlideTeam
 
PDF
Supervised learning
Learnbay Datascience
 
PPTX
Machine Learning
Kumar P
 
PPTX
Introduction to Machine Learning
Rahul Jain
 
Supervised and Unsupervised Learning In Machine Learning | Machine Learning T...
Simplilearn
 
Machine Learning Tutorial | Machine Learning Basics | Machine Learning Algori...
Simplilearn
 
What is Machine Learning | Introduction to Machine Learning | Machine Learnin...
Simplilearn
 
Machine learning
Dr Geetha Mohan
 
Machine learning
Saurabh Agrawal
 
Naive Bayes Classifier | Naive Bayes Algorithm | Naive Bayes Classifier With ...
Simplilearn
 
Machine Learning: Applications, Process and Techniques
Rui Pedro Paiva
 
Machine Learning in 10 Minutes | What is Machine Learning? | Edureka
Edureka!
 
Scikit Learn Tutorial | Machine Learning with Python | Python for Data Scienc...
Edureka!
 
Machine learning
eonx_32
 
Machine Learning
Vivek Garg
 
Data science
Mohamed Loey
 
Logistic Regression | Logistic Regression In Python | Machine Learning Algori...
Simplilearn
 
Data Science With Python | Python For Data Science | Python Data Science Cour...
Simplilearn
 
Machine Learning Algorithms | Machine Learning Tutorial | Data Science Algori...
Simplilearn
 
Introduction to machine learning
Koundinya Desiraju
 
Machine Learning Ml Overview Algorithms Use Cases And Applications
SlideTeam
 
Supervised learning
Learnbay Datascience
 
Machine Learning
Kumar P
 
Introduction to Machine Learning
Rahul Jain
 

Similar to Machine Learning Tutorial Part - 2 | Machine Learning Tutorial For Beginners Part - 2 | Simplilearn (20)

PDF
MLT Unit4.pdffdhngnrfgrgrfflmbpmpphfhbomf
1052LaxmanrajS
 
PDF
MLT Unit4.pdfgmgkgmflbmrfmbrfmbfrmbofl;mb;lf
1052LaxmanrajS
 
PPTX
AI-Lec20 Clustering I - Kmean.pptx
Syed Ejaz
 
PPTX
DataAnalysis in machine learning using different techniques
mtwnc202302
 
PPTX
Clustering
Md. Hasnat Shoheb
 
PPTX
Clustering.pptx
Mukul Kumar Singh Chauhan
 
PPTX
K Means Clustering Algorithm | K Means Clustering Example | Machine Learning ...
Simplilearn
 
PPT
06K-means-clusteringK-MEANS CLUSTERINGK-MEANS CLUSTERING.ppt
ALiHassan443161
 
PPT
06K-means-clustering K-MEANS CLUSTERING.ppt
ALiHassan443161
 
PPTX
K MEANS CLUSTERING - UNSUPERVISED LEARNING
PalanivelG6
 
PPTX
Unsupervised learning Algorithms and Assumptions
refedey275
 
PPTX
Lec13 Clustering.pptx
Khalid Rabayah
 
PPT
Lecture_3_k-mean-clustering.ppt
SyedNahin1
 
PPTX
K means clustering
keshav goyal
 
PPT
K mean-clustering
Afzaal Subhani
 
PDF
k-mean-clustering.pdf
YatharthKhichar1
 
PPT
Clustering in Machine Learning: A Brief Overview.ppt
shilpamathur13
 
PDF
Cluster Analysis : Assignment & Update
Billy Yang
 
PPT
K mean clustering algorithm unsupervised learning
namansingh302004
 
PPT
k-mean-clustering big data analaysis.ppt
abikishor767
 
MLT Unit4.pdffdhngnrfgrgrfflmbpmpphfhbomf
1052LaxmanrajS
 
MLT Unit4.pdfgmgkgmflbmrfmbrfmbfrmbofl;mb;lf
1052LaxmanrajS
 
AI-Lec20 Clustering I - Kmean.pptx
Syed Ejaz
 
DataAnalysis in machine learning using different techniques
mtwnc202302
 
Clustering
Md. Hasnat Shoheb
 
Clustering.pptx
Mukul Kumar Singh Chauhan
 
K Means Clustering Algorithm | K Means Clustering Example | Machine Learning ...
Simplilearn
 
06K-means-clusteringK-MEANS CLUSTERINGK-MEANS CLUSTERING.ppt
ALiHassan443161
 
06K-means-clustering K-MEANS CLUSTERING.ppt
ALiHassan443161
 
K MEANS CLUSTERING - UNSUPERVISED LEARNING
PalanivelG6
 
Unsupervised learning Algorithms and Assumptions
refedey275
 
Lec13 Clustering.pptx
Khalid Rabayah
 
Lecture_3_k-mean-clustering.ppt
SyedNahin1
 
K means clustering
keshav goyal
 
K mean-clustering
Afzaal Subhani
 
k-mean-clustering.pdf
YatharthKhichar1
 
Clustering in Machine Learning: A Brief Overview.ppt
shilpamathur13
 
Cluster Analysis : Assignment & Update
Billy Yang
 
K mean clustering algorithm unsupervised learning
namansingh302004
 
k-mean-clustering big data analaysis.ppt
abikishor767
 
Ad

More from Simplilearn (20)

PPTX
Top 50 Scrum Master Interview Questions | Scrum Master Interview Questions & ...
Simplilearn
 
PPTX
Bagging Vs Boosting In Machine Learning | Ensemble Learning In Machine Learni...
Simplilearn
 
PPTX
Future Of Social Media | Social Media Trends and Strategies 2025 | Instagram ...
Simplilearn
 
PPTX
SQL Query Optimization | SQL Query Optimization Techniques | SQL Basics | SQL...
Simplilearn
 
PPTX
SQL INterview Questions .pTop 45 SQL Interview Questions And Answers In 2025 ...
Simplilearn
 
PPTX
How To Start Influencer Marketing Business | Influencer Marketing For Beginne...
Simplilearn
 
PPTX
Cyber Security Roadmap 2025 | How To Become Cyber Security Engineer In 2025 |...
Simplilearn
 
PPTX
How To Become An AI And ML Engineer In 2025 | AI Engineer Roadmap | AI ML Car...
Simplilearn
 
PPTX
What Is GitHub Copilot? | How To Use GitHub Copilot? | How does GitHub Copilo...
Simplilearn
 
PPTX
Top 10 Data Analyst Certification For 2025 | Best Data Analyst Certification ...
Simplilearn
 
PPTX
Complete Data Science Roadmap For 2025 | Data Scientist Roadmap For Beginners...
Simplilearn
 
PPTX
Top 7 High Paying AI Certifications Courses For 2025 | Best AI Certifications...
Simplilearn
 
PPTX
Data Cleaning In Data Mining | Step by Step Data Cleaning Process | Data Clea...
Simplilearn
 
PPTX
Top 10 Data Analyst Projects For 2025 | Data Analyst Projects | Data Analysis...
Simplilearn
 
PPTX
AI Engineer Roadmap 2025 | AI Engineer Roadmap For Beginners | AI Engineer Ca...
Simplilearn
 
PPTX
Machine Learning Roadmap 2025 | Machine Learning Engineer Roadmap For Beginne...
Simplilearn
 
PPTX
Kotter's 8-Step Change Model Explained | Kotter's Change Management Model | S...
Simplilearn
 
PPTX
Gen AI Engineer Roadmap For 2025 | How To Become Gen AI Engineer In 2025 | Si...
Simplilearn
 
PPTX
Top 10 Data Analyst Certification For 2025 | Best Data Analyst Certification ...
Simplilearn
 
PPTX
Complete Data Science Roadmap For 2025 | Data Scientist Roadmap For Beginners...
Simplilearn
 
Top 50 Scrum Master Interview Questions | Scrum Master Interview Questions & ...
Simplilearn
 
Bagging Vs Boosting In Machine Learning | Ensemble Learning In Machine Learni...
Simplilearn
 
Future Of Social Media | Social Media Trends and Strategies 2025 | Instagram ...
Simplilearn
 
SQL Query Optimization | SQL Query Optimization Techniques | SQL Basics | SQL...
Simplilearn
 
SQL INterview Questions .pTop 45 SQL Interview Questions And Answers In 2025 ...
Simplilearn
 
How To Start Influencer Marketing Business | Influencer Marketing For Beginne...
Simplilearn
 
Cyber Security Roadmap 2025 | How To Become Cyber Security Engineer In 2025 |...
Simplilearn
 
How To Become An AI And ML Engineer In 2025 | AI Engineer Roadmap | AI ML Car...
Simplilearn
 
What Is GitHub Copilot? | How To Use GitHub Copilot? | How does GitHub Copilo...
Simplilearn
 
Top 10 Data Analyst Certification For 2025 | Best Data Analyst Certification ...
Simplilearn
 
Complete Data Science Roadmap For 2025 | Data Scientist Roadmap For Beginners...
Simplilearn
 
Top 7 High Paying AI Certifications Courses For 2025 | Best AI Certifications...
Simplilearn
 
Data Cleaning In Data Mining | Step by Step Data Cleaning Process | Data Clea...
Simplilearn
 
Top 10 Data Analyst Projects For 2025 | Data Analyst Projects | Data Analysis...
Simplilearn
 
AI Engineer Roadmap 2025 | AI Engineer Roadmap For Beginners | AI Engineer Ca...
Simplilearn
 
Machine Learning Roadmap 2025 | Machine Learning Engineer Roadmap For Beginne...
Simplilearn
 
Kotter's 8-Step Change Model Explained | Kotter's Change Management Model | S...
Simplilearn
 
Gen AI Engineer Roadmap For 2025 | How To Become Gen AI Engineer In 2025 | Si...
Simplilearn
 
Top 10 Data Analyst Certification For 2025 | Best Data Analyst Certification ...
Simplilearn
 
Complete Data Science Roadmap For 2025 | Data Scientist Roadmap For Beginners...
Simplilearn
 
Ad

Recently uploaded (20)

PPTX
How to Set Up Tags in Odoo 18 - Odoo Slides
Celine George
 
PPTX
How to Configure Re-Ordering From Portal in Odoo 18 Website
Celine George
 
PPTX
Stereochemistry-Optical Isomerism in organic compoundsptx
Tarannum Nadaf-Mansuri
 
PDF
Exploring the Different Types of Experimental Research
Thelma Villaflores
 
PDF
The Constitution Review Committee (CRC) has released an updated schedule for ...
nservice241
 
PDF
Reconstruct, Restore, Reimagine: New Perspectives on Stoke Newington’s Histor...
History of Stoke Newington
 
PDF
Chapter-V-DED-Entrepreneurship: Institutions Facilitating Entrepreneurship
Dayanand Huded
 
PPT
Talk on Critical Theory, Part One, Philosophy of Social Sciences
Soraj Hongladarom
 
PDF
Horarios de distribución de agua en julio
pegazohn1978
 
PDF
Dimensions of Societal Planning in Commonism
StefanMz
 
PPTX
How to Create Odoo JS Dialog_Popup in Odoo 18
Celine George
 
PDF
Mahidol_Change_Agent_Note_2025-06-27-29_MUSEF
Tassanee Lerksuthirat
 
PDF
Women's Health: Essential Tips for Every Stage.pdf
Iftikhar Ahmed
 
PDF
The History of Phone Numbers in Stoke Newington by Billy Thomas
History of Stoke Newington
 
PPTX
Post Dated Cheque(PDC) Management in Odoo 18
Celine George
 
PPTX
I AM MALALA The Girl Who Stood Up for Education and was Shot by the Taliban...
Beena E S
 
PPTX
care of patient with elimination needs.pptx
Rekhanjali Gupta
 
PDF
Aprendendo Arquitetura Framework Salesforce - Dia 03
Mauricio Alexandre Silva
 
PPTX
Identifying elements in the story. Arrange the events in the story
geraldineamahido2
 
PPTX
PPT-Q1-WEEK-3-SCIENCE-ERevised Matatag Grade 3.pptx
reijhongidayawan02
 
How to Set Up Tags in Odoo 18 - Odoo Slides
Celine George
 
How to Configure Re-Ordering From Portal in Odoo 18 Website
Celine George
 
Stereochemistry-Optical Isomerism in organic compoundsptx
Tarannum Nadaf-Mansuri
 
Exploring the Different Types of Experimental Research
Thelma Villaflores
 
The Constitution Review Committee (CRC) has released an updated schedule for ...
nservice241
 
Reconstruct, Restore, Reimagine: New Perspectives on Stoke Newington’s Histor...
History of Stoke Newington
 
Chapter-V-DED-Entrepreneurship: Institutions Facilitating Entrepreneurship
Dayanand Huded
 
Talk on Critical Theory, Part One, Philosophy of Social Sciences
Soraj Hongladarom
 
Horarios de distribución de agua en julio
pegazohn1978
 
Dimensions of Societal Planning in Commonism
StefanMz
 
How to Create Odoo JS Dialog_Popup in Odoo 18
Celine George
 
Mahidol_Change_Agent_Note_2025-06-27-29_MUSEF
Tassanee Lerksuthirat
 
Women's Health: Essential Tips for Every Stage.pdf
Iftikhar Ahmed
 
The History of Phone Numbers in Stoke Newington by Billy Thomas
History of Stoke Newington
 
Post Dated Cheque(PDC) Management in Odoo 18
Celine George
 
I AM MALALA The Girl Who Stood Up for Education and was Shot by the Taliban...
Beena E S
 
care of patient with elimination needs.pptx
Rekhanjali Gupta
 
Aprendendo Arquitetura Framework Salesforce - Dia 03
Mauricio Alexandre Silva
 
Identifying elements in the story. Arrange the events in the story
geraldineamahido2
 
PPT-Q1-WEEK-3-SCIENCE-ERevised Matatag Grade 3.pptx
reijhongidayawan02
 

Machine Learning Tutorial Part - 2 | Machine Learning Tutorial For Beginners Part - 2 | Simplilearn

  • 1. Clustering What is Clustering? K-Means Clustering Flowchart to understand K-means Clustering Clustering of cars based on brands Logistic Regression What’s in it for you? What is Logistic Regression? Logistic Regression Curve & Sigmoid function Classify whether a tumor is malignant or benign based on features Cover/transition slides will be changed
  • 2. Clustering Suppose, we have a pile of books of different genres!
  • 3. Clustering Now, we divide them into different groups like Fiction Horror Educational
  • 4. Well, organizing objects into groups based on their similarity is Clustering!
  • 5. Well, organizing objects into groups based on their similarity is Clustering! K-means Clustering
  • 6. K-Means Clustering is an example of Unsupervised learning
  • 7. K-Means Clustering is an example of Unsupervised learning It is used when you have unlabeled data!
  • 8. K-Means Clustering is an example of Unsupervised learning It is used when you have unlabeled data! To find clusters in the data based on feature similarity!
  • 9. Steps for K-Means Suppose we have these data points and we want to assign them into clusters
  • 10. STEP 1: Initialize Cluster Centroids We pick ‘K’ clusters & assign random centroids to clusters
  • 11. STEP 1: Initialize Cluster Centroids We pick ‘K’ clusters & assign random centroids to clusters Then, we compute distance from objects to centroids
  • 12. STEP 2: Compute Minimum Distance Now, we form new clusters based on minimum distance and calculate their centroids
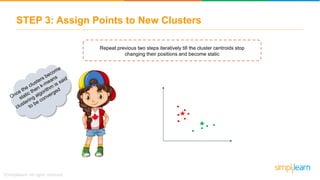
  • 13. STEP 3: Assign Points to New Clusters Repeat previous two steps iteratively till the cluster centroids stop changing their positions and become static
  • 14. STEP 3: Assign Points to New Clusters Repeat previous two steps iteratively till the cluster centroids stop changing their positions and become static
  • 15. Shall we see a flowchart to understand?
  • 16. Flowchart to understand K-Means Choose K (Elbow Method) START Assign random centroids to clusters Compute distance from objects to centroids Yes Form new clusters based on minimum distance and calculate their centroids Compute distance from objects to new centroids Repeat until no observations change groups
  • 17. Let’s see an example!
  • 18. K-Means Algorithm Subject A B 1 1 1 2 1.5 2 3 3 4 4 5 7 5 3.5 5 6 4.5 5 7 3.5 4.5 Suppose, we have this dataset of 7 individuals and their score on two topics (A and B)
  • 19. K-Means Algorithm Now, lets take two farthest-apart points as initial cluster centroids Subject A B 1 1 1 2 1.5 2 3 3 4 4 5 7 5 3.5 5 6 4.5 5 7 3.5 4.5
  • 20. K-Means Algorithm Now, lets take two farthest-apart points as initial cluster centroids
  • 21. K-Means Algorithm Each point is then assigned to the closest cluster with respect to their distance from the centroids Cluster 1 Cluster 2
  • 22. K-Means Algorithm Now, we again calculate the centroids of each cluster: Individual Mean Vector (centroid) Cluster 1 1, 2, 3 (1.8, 2.3) Cluster 2 4, 5, 6, 7 (4.1, 5.4) Cluster 1 Cluster 2
  • 23. K-Means Algorithm We compare each individual’s distance to its own cluster mean and to that of the opposite cluster. And we find: Individual Distance to mean (centroid) of Cluster 1 Distance to mean (centroid) of Cluster 2 1 1.5 5.4 2 0.4 4.3 3 2.1 1.8 4 5.7 1.8 5 3.2 0.7 6 3.8 0.6 7 2.8 1.1 Using Eucledian Distance between the points and the mean Cluster 1 Cluster 2
  • 24. K-Means Algorithm Individual Distance to mean (centroid) of Cluster 1 Distance to mean (centroid) of Cluster 2 1 1.5 5.4 2 0.4 4.3 3 2.1 1.8 4 5.7 1.8 5 3.2 0.7 6 3.8 0.6 7 2.8 1.1 Only individual 3 is nearer to the mean of the opposite cluster (Cluster 2) than its own (Cluster 1) Cluster 1 Cluster 2 Moving point 3 to new cluster
  • 25. K-Means Algorithm Thus, individual 3 is relocated to Cluster 2 resulting in the new partition: Individual Distance to mean (centroid) of Cluster 1 Distance to mean (centroid) of Cluster 2 1 1.5 5.4 2 0.4 4.3 3 2.1 1.8 4 5.7 1.8 5 3.2 0.7 6 3.8 0.6 7 2.8 1.1 Cluster 1 Cluster 2
  • 26. K-Means Algorithm For the new clusters, we will find the actual cluster centroids: Individual Mean Vector (centroid) Cluster 1 1, 2, 3 (1.25, 1.5) Cluster 2 4, 5, 6, 7 (3.9, 5.1) Cluster 1 Cluster 2
  • 27. K-Means Algorithm On comparing the distance of each individual’s distance to it’s own cluster mean and to that of the opposite cluster, we find that the data points are stable, hence we have our final clusters! Cluster 1 Cluster 2
  • 28. K-Means Algorithm To find appropriate number of clusters in a dataset, we use elbow method: WSS No . of. clusters Elbow point Within sum of squares (WSS) is defined as the sum of the squared distance between each member of the cluster and its centroid Finding the optimal number of clusters using the elbow of the graph is called as the Elbow method
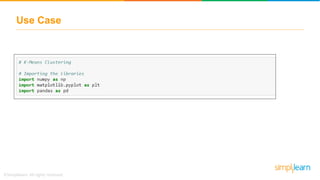
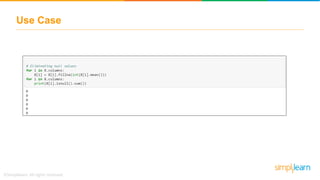
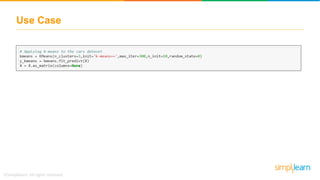
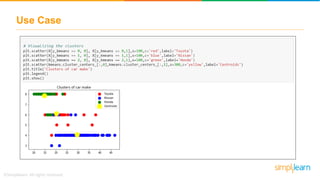
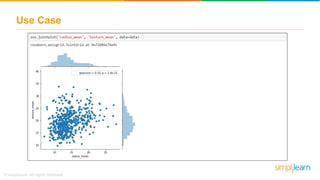
  • 29. Use Case Using K-means clustering to cluster cars into brands using the parameters such as horsepower, cubic inches, make year, etc. Dataset: Cars data having information about 3 brands of cars namely Toyota, Honda, Nissan
  • 39. Clustering Today, we’ll dive into K- means Clustering! Well, organizing objects into groups based on their similarity is Clustering! Logistic Regression
  • 40. Logistic Regression Now, let’s look into Logistic Regression
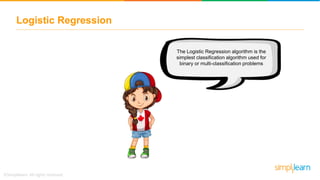
  • 41. Logistic Regression The Logistic Regression algorithm is the simplest classification algorithm used for binary or multi-classification problems
  • 42. Logistic Regression To brush up, y = mx+c The dependent variable is the target class variable we are going to predict In the previous tutorial, we learnt about Linear Regression, dependent and independent variables
  • 43. Logistic Regression In the previous tutorial, we learnt about Linear Regression, dependent and independent variables The independent variables (x1…xn) are the features or attributes we are going to use to predict the target class To brush up, y = mx+c The dependent variable is the target class variable we are going to predict
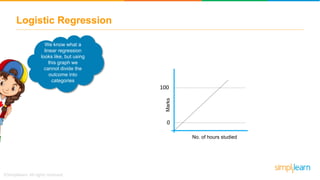
  • 44. Logistic Regression 1 0 Marks No. of hours studied We know what a linear regression looks like, but using this graph we cannot divide the outcome into categories 100
  • 45. Logistic Regression 100 0 We know what a linear regression looks like, but using this graph we cannot divide the outcome into categories For example, a linear regression graph can tell us that with increase in number of hours studied, the marks of a student will increase But, it will not tell us whether the student will pass or not! Marks No. of hours studied
  • 46. Logistic Regression In such cases, where we need the output as categorical value, we will use logistic regression! 100 0 No. of hours studied Marks
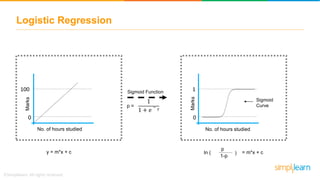
  • 47. Logistic Regression 0 100 1 0 Sigmoid Curve Sigmoid Function y = m*x + c p = 1 1 + ⅇ − y p ln ( 1-p ) = m*x + c No. of hours studied No. of hours studied Marks Marks
  • 48. Logistic Regression 0 0.2 0.4 0.6 0.8 1 1.2 0 1 2 3 4 5 6 7 8 9 Logistic Regression Threshold value Probability > 0.50 Value is rounded off to 1 indicating that the student will pass Probability < 0.50 , the value is rounded off to 0 indicating that the student will fail 0.30 0.82
  • 49. Problem statement: To classify whether a tumor is ‘malignant’ or ‘benign’
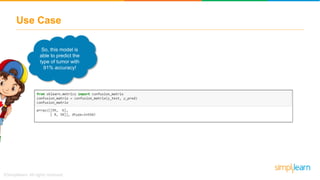
  • 59. Use Case So, this model is able to predict the type of tumor with 91% accuracy!
  • 60. Finally, let’s discuss the answers to the quiz asked in Machine Learning Tutorial Part-1 for the instructor
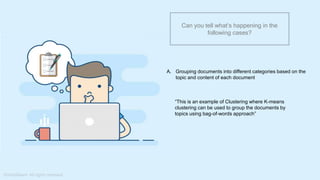
  • 61. What do you understand from Measures and Dimensions? Each field from the data source is automatically assigned a datatype (such as string, integer) and a role (dimension or measure) Aggregation applied on measures is ‘Sum’ by default but you can always change the default aggregation in the settings Can you tell what’s happening in the following cases? A. Grouping documents into different categories based on the topic and content of each document “This is an example of Clustering where K-means clustering can be used to group the documents by topics using bag-of-words approach”
  • 62. What do you understand from Measures and Dimensions? Each field from the data source is automatically assigned a datatype (such as string, integer) and a role (dimension or measure) Aggregation applied on measures is ‘Sum’ by default but you can always change the default aggregation in the settings Can you tell what’s happening in the following cases? B. Identifying hand-written digits in images correctly “This is an example of Classification. The traditional approach to solving this would be to extract digit dependent features like curvature of different digits, etc. and then use a classifier like SVM to distinguish between images”
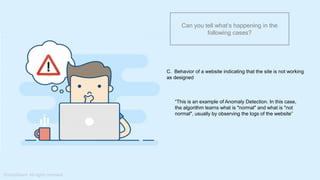
  • 63. What do you understand from Measures and Dimensions? Each field from the data source is automatically assigned a datatype (such as string, integer) and a role (dimension or measure) Aggregation applied on measures is ‘Sum’ by default but you can always change the default aggregation in the settings Can you tell what’s happening in the following cases? C. Behavior of a website indicating that the site is not working as designed “This is an example of Anomaly Detection. In this case, the algorithm learns what is "normal" and what is "not normal", usually by observing the logs of the website”
  • 64. What do you understand from Measures and Dimensions? Each field from the data source is automatically assigned a datatype (such as string, integer) and a role (dimension or measure) Aggregation applied on measures is ‘Sum’ by default but you can always change the default aggregation in the settings Can you tell what’s happening in the following cases? D. Predicting salary of an individual based his/her years of experience “This is an example of Regression. This problem can be mathematically defined as a function between independent (years of experience) and dependent variable (salary of an individual)”
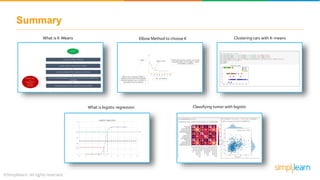
  • 65. Summary What is K-Means Elbow Method to choose K Clustering cars with K-means Classifying tumor with logisticWhat is logistic regression

Editor's Notes