Mastering RNA-Seq (NGS Data Analysis) - A Critical Approach To Transcriptomic Data Analysis
Download as PPTX, PDF2 likes709 views

The document highlights contributions from notable researchers in bioinformatics and discusses the integration and analysis of multi-omics data, particularly focusing on RNA-seq methodologies and differential expression analysis. It includes information on pre-processing next-generation sequencing data, various statistical methods for expression analysis, and the significance of feature selection in clinical test systems. Additionally, it references specific cancer research studies and showcases practical applications of bioinformatics tools in understanding cancer models.


![Biological Examples and Reference Data sets:
• “Modeling precision treatment of breast cancer”, Daemen et. al.
(https://genomebiology.biomedcentral.com/articles/10.1186/gb-2013-14-10-r110),
• “Whole transcriptome profiling of patient-derived xenograft models as a tool to identify both
tumor and stromal specific biomarkers” Bradford et. al.
(http://www.oncotarget.com/index.php?journal=oncotarget&page=article&op=view&path[]=8014
&path[]=23533), and
• Processed data from The Cancer Genome Atlas samples (https://cancergenome.nih.gov/).](https://image.slidesharecdn.com/april17-unmc-180417145639/85/Mastering-RNA-Seq-NGS-Data-Analysis-A-Critical-Approach-To-Transcriptomic-Data-Analysis-3-320.jpg)


Mastering RNA-Seq (NGS Data Analysis) - A Critical Approach To Transcriptomic Data Analysis
- 2. Special Thank you to:Dr. Vladimir Galatenko, Chief Scientist at the Tauber Bioinformatics Research Center. His work is focused on issues related to Big Data analysis and, in particular, on integration of multi-omics datasets. A special research interest of Dr. Galatenko is related to feature selection which is vital for efficient development of clinical test systems. Julia Panov, Ph.D. student involved in a number of neuroscience research projects, an experienced bioinformatics user. She relies on the T-BioInfo platform for regular processing and integration of omics data, collaborating with TBRC research group on platform development. Dr. Javeed Iqbal, UNMC
- 3. Biological Examples and Reference Data sets: • “Modeling precision treatment of breast cancer”, Daemen et. al. (https://genomebiology.biomedcentral.com/articles/10.1186/gb-2013-14-10-r110), • “Whole transcriptome profiling of patient-derived xenograft models as a tool to identify both tumor and stromal specific biomarkers” Bradford et. al. (http://www.oncotarget.com/index.php?journal=oncotarget&page=article&op=view&path[]=8014 &path[]=23533), and • Processed data from The Cancer Genome Atlas samples (https://cancergenome.nih.gov/).
- 4. 1. Next Generation Sequencing data pre-processing: • Trimming technical sequences • Removing PCR duplicates 2. RNA-seq based quantification of expression levels: • Conventional pipelines (looking at known transcripts) • Identification of novel isoforms Processing of NGS data:
- 5. Gene set enrichment analysis
- 6. Analysis of Expression Data Using Machine Learning: 3. Unsupervised analysis of expression data: • Principal Component Analysis • Clustering 4. Supervised analysis: • Differential expression analysis • Classification, gene signature construction
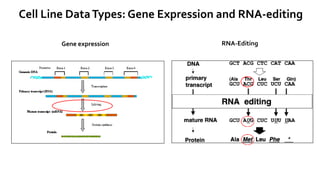
- 9. Cell Line DataTypes: Gene Expression and RNA-editing RNA-EditingGene expression
- 10. Breast cancer and cell line models
- 11. Cell Lines as Cancer Models
- 12. Sample 1 Sample 2 Sample 3 Sample 4 gene 1 4 3 3 7 gene 2 6 5 5 8 gene 3 6 6 6 6 gene 4 1 2 1 2 gene 5 9 10 1 5 gene 6 12 4 0 5 gene 7 1 7 9 8 gene 8 4 8 3 10 Gene ExpressionTable Chr Pos start End Sample 1 Sample 2 Sample 3 Sample 4 chr1 1312400 1312400 0 0 0 0 chr1 8362100 8362100 0 0 0 0 chr11 842700 842700 0.705023 0 0 1.17938 chr12 753200 753200 0 0 0 0 chr16 521100 521100 0 0 0 0 chr16 1362700 1362700 0 0 0 0 chr16 1446900 1446900 0 0 8.55549 0 chr16 2176500 2176500 0 0 0 0 chr16 2896600 2896600 0 0 0 0 chr16 29972700 29972700 0 0 0 0 chr16 30358600 30358600 0 0 0 0 chr16 30778800 30778800 0 0 0 0 chr17 2042900 2042900 0 0 15.332 0 chr17 4538300 4538300 0 0 0 0 chr17 4891100 4891100 0 0 0 0 chr17 4946300 4946300 0 38.4794 0 0 chr17 5033200 5033200 0 0 0 0 RNA-editingTable 49 Cell Lines
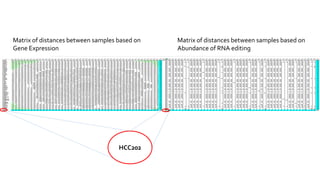
- 14. Matrix of distances between samples based on Gene Expression Matrix of distances between samples based on Abundance of RNA editing HCC202
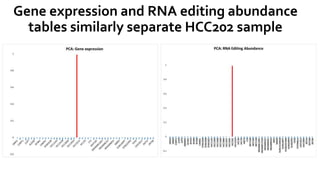
- 15. Gene expression and RNA editing abundance tables similarly separate HCC202 sample
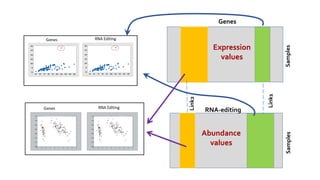
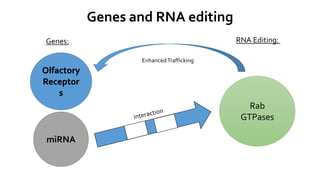
- 16. Genes and RNA editing Genes: RNA Editing: Olfactory Receptor s miRNA Rab GTPases EnhancedTrafficking
- 17. Learn more at: T-bio.info
- 18. Part 2: Working with RNA-Seq Data
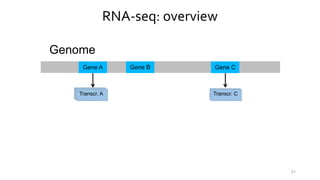
- 20. RNA-seq: overview Genome Gene A Gene B Gene C 20
- 21. RNA-seq: overview Genome Gene A Gene B Gene C Transcr. ATranscr. ATranscr. A Transcr. ATranscr. C 21
- 22. RNA-seq: overview Genome Gene A Gene B Gene C Transcr. ATranscr. ATranscr. A Transcr. ATranscr. C Reads 22
- 23. RNA-seq: overview Genome Gene A Gene B Gene C Transcr. ATranscr. ATranscr. A Transcr. ATranscr. C Reads Transcr. A Transcr. C 23
- 24. RNA-seq: some details Genome Gene A Gene B Gene C Transcr.Transcr.Transcr. A Shattering 24 Transcr. CTranscr. C
- 25. RNA-seq: some details Genome Gene A Gene B Gene C Transcr.Transcr.Transcr. A Transcr. Adapters ligation 25 Transcr. C
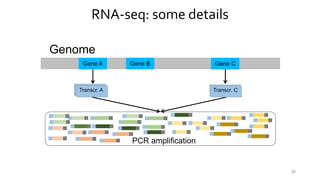
- 26. RNA-seq: some details Genome Gene A Gene B Gene C Transcr.Transcr.Transcr. A Transcr. PCR amplification 26 Transcr. C
- 27. RNA-seq: some details Genome Gene A Gene B Gene C Transcr.Transcr.Transcr. A Transcr. “Reading” 27 Transcr. C
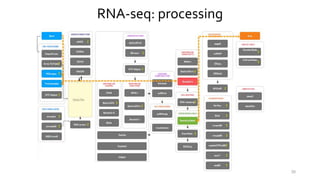
- 28. RNA-seq: per-sample processing Preprocessing: • Adapters removal plus additional trimming • Removing PCR duplicates Mapping • Mapping on the set of known transcripts • Mapping on genome (and potential identification of novel transcripts) • Combined strategy Quantification of expression levels 28
- 29. RNA-seq: Comments PCR removal should be used with caution to avoid removing natural duplicates (valuable links: http://www.cureffi.org/2012/12/11/how-pcr-duplicates-arise-in-next-generation-sequencing/ https://www.ncbi.nlm.nih.gov/pmc/articles/PMC4965708/ - DNA-seq and variant calling https://www.ncbi.nlm.nih.gov/pmc/articles/PMC4597324/ - RNA-seq, ChIP-seq data https://www.ncbi.nlm.nih.gov/pmc/articles/PMC3871669/ - trimming 29
- 32. RNA-seq: expression level quantification Standard measures • read counts (raw, expected) • FPKM – fragments per kilo base per million mapped reads: Number of reads mapped on the gene / ((total number of mapped reads – in millions) x (gene length – in kilobases)) • TPM – transcripts per million For one sample TPMg = C x FPKMg, where C is selected in such a way that sum of all TPMg is one million. But constants C are different for different samples. 32
- 33. RNA-seq: expression level quantification Alternative definition of TPM: (Number of reads mapped on the gene x read mean length x 106) / (gene length x T), where T is the sum over all genes of (Number of reads mapped on the gene x read mean length) / gene length Each term here represents the number of sampled transcripts corresponding to a gene, and T estimates the total number of sampled transcripts (molecules). Thus, TPM is the estimate of the number of transcripts corresponding to a gene in every million transcripts. Details: Wagner G.P., Kin K., Lynch V.J. (Theory Biosci., 2012) https://www.ncbi.nlm.nih.gov/pubmed/22872506 33
- 34. RNA-seq: expression level quantification Linear scale vs Log-scale Relative differences are biologically more meaningful than absolute. Computations are simplified if a log-scaling is performed: Log-scaled measure = log2 (linear-scale measure + shift) For relatively large values a difference equal to 1 in log-scale is a 2x difference in linear scale; difference equal to 3 in log-scale is a 8x difference in linear scale, etc.; difference equal to -1 in log-scale is a 2x difference in linear scale, but in the opposite direction. 34
- 35. Comparison: the role of preprocessing No preprocessing 35
- 36. Comparison: the role of preprocessing No PCR duplicate removal 36
- 37. Comparison: the role of preprocessing Standard 37
- 38. Comparison: the role of preprocessing (output) 38
- 39. Comparison: the role of preprocessing 39
- 40. Comparison: the role of preprocessing 40
- 43. BREAK 43 B R E A K
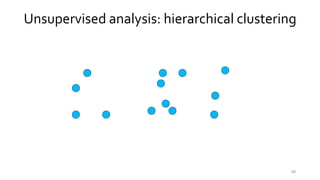
- 47. 47 Unsupervised analysis: hierarchical clustering
- 48. 48 Unsupervised analysis: hierarchical clustering
- 49. 49 Unsupervised analysis: hierarchical clustering
- 50. Unsupervised analysis: hierarchical clustering 50
- 51. Unsupervised analysis: hierarchical clustering 51
- 52. 52 Unsupervised analysis: hierarchical clustering
- 53. 53 Unsupervised analysis: hierarchical clustering
- 54. 54 Unsupervised analysis: hierarchical clustering
- 55. 55 Unsupervised analysis: hierarchical clustering Dendrogram
- 56. 56 Unsupervised analysis: hierarchical clustering Dendrogram
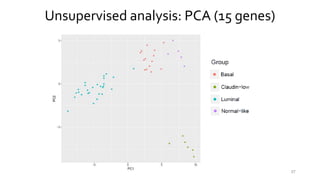
- 57. Unsupervised analysis: PCA (15 genes) 57
- 58. Unsupervised analysis: PCA (15 genes) 58
- 59. Unsupervised analysis: hierarchical clustering, 15 genes Dendrogram 59
- 60. Unsupervised analysis: hierarchical clustering, 15 genes N-like BasalC-lowLuminal 60 Dendrogram
- 61. Gene annotation: ENSG to Gene Symbols plus GO 61
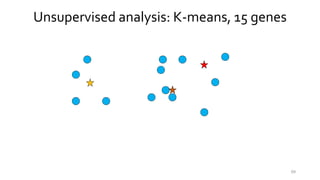
- 62. 62 Unsupervised analysis: K-means, 15 genes
- 63. 63 Unsupervised analysis: K-means, 15 genes
- 64. 64 Unsupervised analysis: K-means, 15 genes
- 65. 65 Unsupervised analysis: K-means, 15 genes
- 66. 66 Unsupervised analysis: K-means, 15 genes
- 67. 67 Unsupervised analysis: K-means, 15 genes
- 68. 68 Unsupervised analysis: K-means, 15 genes
- 69. 69 Unsupervised analysis: K-means, 15 genes
- 70. 70 Unsupervised analysis: K-means, 15 genes
- 71. 71 Unsupervised analysis: K-means, 15 genes
- 72. Unsupervised analysis: K-means, 15 genes 72
- 73. Unsupervised analysis: K-means, 15 genes “The SUM52PE cell line was derived from a pleural effusion and was found to be negative for ER and PR expression, however the original primary tumor from this patient was positive for both hormone receptors”. Chavez KJ, Garimella SV, Lipkowitz S. Triple negative breast cancer cell lines: one tool in the search for better treatment of triple negative breast cancer. Breast Dis. 2010; 32(1-2):35-48. Ethier SP, Kokeny KE, Ridings JW, Dilts CA. erbB family receptor expression and growth regulation in a newly isolated human breast cancer cell line. Cancer Res. 1996; 56(4): 899-907. 73
- 74. BREAK 74 B R E A K
- 75. 75 Supervised analysis: SVM with a linear kernel as an example
- 76. 76 Supervised analysis: SVM with a linear kernel as an example
- 77. 77 Supervised analysis: SVM with a linear kernel as an example
- 78. d d 78 Supervised analysis: SVM with a linear kernel as an example
- 79. 79 Supervised analysis: SVM with a linear kernel as an example
- 80. ? 80 Supervised analysis: SVM with a linear kernel as an example
- 81. Supervised analysis: SVM with a linear kernel as an example ? 81
- 82. Supervised analysis: available methods • Linear Discriminant Analysis (LDA) • Quadratic Discriminant Analysis (QDA) • Random Forest • Support Vector Machine (SVM) • Naïve Bayes 82
- 83. Supervised analysis: 15 genes 83
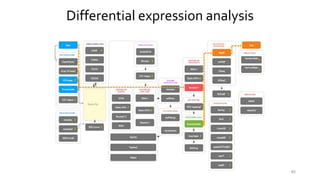
- 84. Differential expression analysis Quantities related to the degree of differential expression: • Difference between mean expression levels – fold change (please, pay attention to scale); • Statistical significance – p-value, adjusted p-value (e.g., FDR) • Expression level magnitude (caution with low- expressed genes from the analysis). 84
- 87. Gene set / pathway enrichment analysis Possible options: • Use only lists (thresholding required): one of the standard tools here is The Database for Annotation, Visualization and Integrated Discovery – DAVID (https://david.ncifcrf.gov/home.jsp, https://david- d.ncifcrf.gov/). • Take into consideration degrees of differential expression; • Additionally take into consideration pathway topology. 87
- 88. Gene set / pathway enrichment analysis 88
- 89. Gene set / pathway enrichment analysis 89
- 90. BREAK 90 B R E A K
- 91. BREAK 91 HANDSON Separation of TCGA and breast cancer PDX samples
- 92. BREAK 92 HANDSON Analysis of a subset of breast cancer PDX samples
Editor's Notes
- #2: Welcome to our first workshop of this kind – we are constantly experimenting, so hopefully this experiment will be successful. Our goal is to share with you several important concepts around Next Generation Sequencing Analysis techniques, specifically how to process, analyze and annotate gene expression data.
- #3: Before we start, I would like to say a special thank you to Dr. Javeed Iqbal, whom I am sure you all know from University of Nebraska Medical Center. He has been a tremendous help organizing the venue and sharing updates about the workshop with many of you. Also, let me introduce our speakers today – Dr. Vladimir Galatenko, the chief scientist at the Tauber Bioinformatics Research Center. Together with Dr. Galatenko we invited Julia Panov, a Ph.D. student who regularly relies on the T-BioInfo platform in her research
- #4: In this workshop, we will utilize oncology-related public-domain datasets derived from cell lines, animal models and if we have time, will touch on TCGA data. I also want to mention that these are projects prepared as examples for this workshop, however one of our goals is to identify key topics of interest for future workshops and online courses we are developing. We would be happy to speak with you afterwards about topics of interest, pathologies or other types of data of interest.
- #5: We will cover important topics about Next Generation sequencing data: pre-processing and quantification of expression levels
- #94: Conclusion