


Monitor resources with azure embedded tools
- 2. Monitoring Why monitoring is needed? • Comprehensive view of your Availability, Reliability and Performance • Monitor capabilities from both server-side and client-side perspective • Runtime and Proactive monitoring of Infrastructure • Correlation between the application activity and load and the infrastructure state it resides on • Costs
- 4. Microsoft provides a number of features within the Azure Portal to help manage costs. Tips for analyzing and managing costs: o Show costs based on resource tags: Subscription > Cost Management > Cost Analysis o See previous invoices: Subscription > Billing > Invoices o View cost by resource: Subscription > Overview o Look at a cost forecast: Subscription > Overview
- 8. Azure Advisor is a free service provided by Microsoft which provides personalized recommendations tailored to your environment. Azure Advisor focuses on high availability, performance, security, and cost.
- 10. Azure Service Health • Provides a personalized view of the health of the Azure services and regions you’re using • Tracks three types of health events that may impact your resources: Service issues Planned maintenance Health advisories
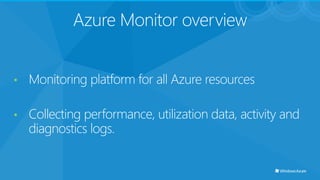
- 12. Azure Monitor overview • Monitoring platform for all Azure resources • Collecting performance, utilization data, activity and diagnostics logs.
- 17. You receive an email from Application Insights. Here's a typical example:
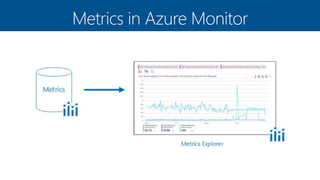
- 24. Metrics in Azure Monitor
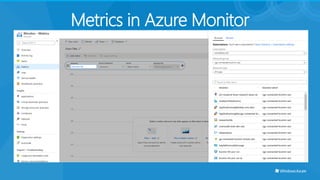
- 25. Metrics in Azure Monitor
- 26. Metrics in Azure Monitor
- 27. Log Analytics
- 29. Charts
Editor's Notes
- #3: Проактивное поведение в бизнесе. Проактивный мониторинг. SRE – почему интереснее чем просто Operational.
- #7: Cоставление финансовых отчетов, для формированию бюджета
- #9: Best practices to optimize your Azure workloads Simple, step-by-step guidance and quick links One place to review and act on recommendations from across Azure Alerts to notify you about new recommendations
- #10: Optimize virtual machine spend by resizing or shutting down underutilized instances Reduce costs by eliminating unprovisioned ExpressRoute circuits Buy reserved virtual machine instances to save money, when compared to pay-as –you-go costs Reduce costs by deleting or reconfiguring idle virtual network gateways
- #13: Azure Monitor is a collection of services which help monitor and diagnose Azure resources. HUB
- #14: Azure monitor Hub Azure Monitor собирает и объединяет данные из различных источников в общую платформу данных, где их можно использовать для анализа, визуализации и оповещения. Он обеспечивает согласованное взаимодействие с данными из нескольких источников, что дает вам глубокое понимание всех ваших отслеживаемых ресурсов и даже данных других служб, которые хранят свои данные в Azure Monitor. Поскольку Azure Monitor хранит данные из нескольких источников вместе, данные можно сопоставлять и анализировать с помощью общего набора инструментов. Он также сопоставляет данные нескольких подписок Azure. Ресурсы Azure генерируют значительный объем данных мониторинга. Azure Monitor объединяет эти данные вместе с данными мониторинга из других источников в платформу Metrics или Logs. Каждый оптимизирован для конкретных сценариев мониторинга, и каждый поддерживает различные функции в Azure Monitor. Azure Monitor Activity Log Diagnostics Metrics Network Watcher Alerting Application Insights Log Analytics Azure Advisor Azure Security Center Application – Application insight (feature in Azure monitor. Can connect to Azure Container, web apps etc.) Operating System – require agent (Windows and Linux) Health ( проблемы с службами, дисками и т.д.), Performance. Так же ест ьвозможность засетапать алерты на любые события. Azure Resources – Activity logs (можно ставить алерты) Custom Source – Log analytics workspace
- #16: Application Insights, функция Azure Monitor, представляет собой расширяемую службу Application Performance Management (APM) для веб-разработчиков на нескольких платформах. Используйте его для мониторинга вашего живого веб-приложения. Он автоматически обнаружит аномалии производительности( Smart detection). Он включает в себя мощные аналитические инструменты, которые помогут вам диагностировать проблемы и понять, что пользователи на самом деле делают с вашим приложением. Он призван помочь вам постоянно повышать производительность и удобство использования. Он работает для приложений на самых разных платформах, включая .NET, Node.js и Java EE, локальных, гибридных или любых общедоступных облаках. Он интегрируется с вашим процессом DevOps и имеет точки подключения к различным инструментам разработки. Он может отслеживать и анализировать телеметрию из мобильных приложений путем интеграции с Visual Studio App Center. Больше ориентирован на девелоперов. Помогает понять как апликейшен работает, его производительность и как он используется.
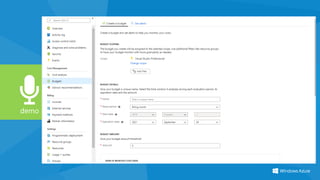
- #17: Smart detection - Failure Anomalies. We use machine learning to set the expected rate of failed requests for your app, correlating with load and other factors. If the failure rate goes outside the expected envelope, we send an alert. Smart detection - Performance Anomalies. You get notifications if response time of an operation or dependency duration is slowing down compared to historical baseline or if we identify an anomalous pattern in response time or page load time. General degradations and issues, like Trace degredation, Memory leak, Abnormal rise in Exception volume and Security anti-patterns. You can select a retention duration of 30, 60, 90, 120, 180, 270, 365, 550 or 730 days. If you need to keep data longer than 730 days, you can use Continuous Export to copy it to a storage account during data ingestion. Data kept longer than 90 days will incur addition charges. You can select the location when you create a new Application Insights resource. Все данные шифруются в состоянии покоя и при перемещении между дата-центрами.
- #19: Карта приложений помогает вам определить узкие места производительности или точки отказа во всех компонентах вашего распределенного приложения. Каждый узел на карте представляет компонент приложения или его зависимости; и имеет KPI здоровья и статус предупреждений. Вы можете перейти от любого компонента к более подробной диагностике, такой как события Application Insights. Если ваше приложение использует службы Azure, вы также можете перейти к диагностике Azure, например рекомендациям SQL Database Advisor.
- #20: Проверяйте исправление во время его выпуска, наблюдая за производительностью и количеством ошибок. Следите за результатами тестовых нагрузок и диагностируйте проблемы в режиме реального времени. Сосредоточьтесь на определенных сеансах тестирования или отфильтруйте известные проблемы, выбрав и отфильтровав метрики, которые вы хотите просмотреть. Получите следы исключений, как они происходят. Поэкспериментируйте с фильтрами, чтобы найти наиболее релевантные KPI. Мониторинг любого счетчика производительности Windows в реальном времени. Легко идентифицируйте сервер, у которого есть проблемы, и отфильтруйте все KPI / прямую трансляцию только для этого сервера.
- #21: Application Insights REST API - API-интерфейc REST, созданных для облегчения доступа к данным, собранным Application Insights. Используя эти API, вы можете создавать новые визуализации данных вашего приложения и расширять возможности Application Insights.
- #22: Application dashboard Панель мониторинга приложений использует существующую технологию панели мониторинга в Azure, чтобы обеспечить полностью настраиваемое представление на одной панели состояния и производительности вашего приложения.
- #25: Метрики в Azure Monitor хранятся в time-series database, которая оптимизирована для анализа данных с метками времени. Это делает метрики особенно подходящими для оповещения и быстрого обнаружения проблем. Они могут рассказать вам о том, как работает ваша система, но, как правило, их необходимо объединять c Logs, чтобы определить основную причину проблем. Метрики доступны для интерактивного анализа на портале Azure с помощью Metrics Explorer. Их можно добавить на панель мониторинга Azure для визуализации в сочетании с другими данными и использовать для оповещения почти в реальном времени.
- #28: Log Analytics - это веб-инструмент, используемый для написания и выполнения запросов журнала Azure Monitor.
- #29: Схема представляет собой набор таблиц, визуально сгруппированных в логической категории. Несколько категорий относятся к решениям для мониторинга. Категория LogManagement содержит общие данные, такие как события Windows и Syslog, данные о производительности и контрольные сигналы агента.
- #31: На временной диаграмме, если в ваших данных есть внезапный скачок или шаг, вы можете увидеть выделенную точку на линии. Это указывает на то, что Smart Diagnostics идентифицировала комбинацию свойств, которые отфильтровывают внезапное изменение. Нажмите на точку, чтобы получить более подробную информацию о фильтре и увидеть отфильтрованную версию. Это может помочь вам определить причину изменения Once you've created a useful query, you might want to save it or share with others. The Save icon is on the top bar. You can save either the entire query page, or a single query as a function. Functions are queries that can also be referenced by other queries. In order to save a query as a function, you must provide a function alias, which is the name used to call this query when referenced by other queries.
- #32: Квери возвращает какой процесс занимает больше всего процесного времени Виртуальной машины.
- #33: Ранее с помощью Azure Monitor вы могли анализировать данные только из текущей рабочей области, и это ограничивало ваши возможности запроса по нескольким рабочим областям, указанным в вашей подписке. Кроме того, вы можете выполнять поиск только элементов телеметрии, собранных из вашего веб-приложения, с помощью Application Insights непосредственно в Application Insights или из Visual Studio. Это также затрудняло совместный анализ оперативных и прикладных данных. Теперь вы можете выполнять запросы не только по нескольким рабочим областям Log Analytics, но и по данным из определенного приложения Application Insights в той же группе ресурсов, другой группе ресурсов или другой подписке. Это дает вам представление всей системы о ваших данных. Вы можете выполнять эти типы запросов только в Log Analytics.