Monitoring your API
3 likes940 views

This document discusses monitoring system and application metrics using tools like Collectd and Logster to send data to Graphite. It provides examples of key metrics to monitor for resources like CPU, memory, disk, network and Nginx. These include utilization, saturation and errors. Graph examples are given showing how to visualize request rates, response times, and resource usage over time in Graphite. The document also discusses configuring Collectd and Logster and creating a custom Logster parser to send detailed request timing data rather than averages.


![WHATTOOLS? LOGSTER
• Install NginxParser (copy it to parsers folder)
$ git clone https://github.com/andphe/logster-parsers.git
$ cd logster-parsers
$ sudo cp NginxParser.py /usr/local/lib/python2.7/dist-packages/
logster-0.0.1-py2.7.egg/logster/parsers/
• Configure Nginx to log the request time:
log_format request_time '$remote_addr - $remote_user [$time_local] '
'"$request" $status "$request_time" $bytes_sent '
'"$http_referer" "$http_user_agent"';
access_log /var/logs/nginx/access.log request_time;](https://image.slidesharecdn.com/monitoringyourapi-150911033217-lva1-app6892/85/Monitoring-your-API-17-320.jpg)


Monitoring your API
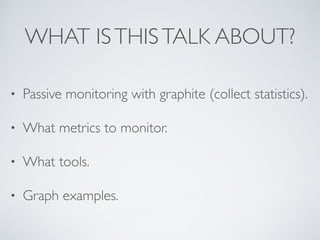
- 2. WHAT ISTHISTALK ABOUT? • Passive monitoring with graphite (collect statistics). • What metrics to monitor. • What tools. • Graph examples.
- 3. ASSUMPTIONS • You are using Nginx as a proxy for your API. • You are using Ubuntu (but works in other Linux distributions). • You’ll be using graphite to store metrics sent by collectl for system metrics and logster for Nginx logs.
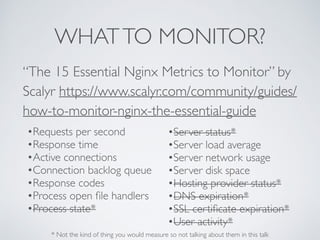
- 4. WHATTO MONITOR? “The 15 Essential Nginx Metrics to Monitor” by Scalyr https://www.scalyr.com/community/guides/ how-to-monitor-nginx-the-essential-guide •Requests per second •Response time •Active connections •Connection backlog queue •Response codes •Process open file handlers •Process state* •Server status* •Server load average •Server network usage •Server disk space •Hosting provider status* •DNS expiration* •SSL certificate expiration* •User activity* * Not the kind of thing you would measure so not talking about them in this talk
- 5. WHATTO MONITOR? • “The USE Method” by Brendan Gregg http://www.brendangregg.com/ usemethod.html • Methodology for analyzing the performance of any system. • Summarized as:“For every resource, check utilization, saturation, and errors.” • Consider software a resource as well • “USE Method: Rosetta Stone of Performance Checklists” by Brendan Gregg http://www.brendangregg.com/USEmethod/use-rosetta.html
- 6. WHATTO MONITOR ? Utilization Saturation Errors App Performance Response time, # Requests — 5xx code Nginx Connections Active Accepted - Handled — Open file descriptors # open files — — CPU % Util Run queue size — Network Rx orTx / Max Dropped Errors Memory Used Swap — Disk % Util Wait time and queue length —
- 7. WHATTOOLS? Utilization Saturation Errors App Performance Response time, # Requests — 5xx code Nginx Connections Active Accepted - Handled — Open file descriptors # open files — — CPU % Util Run queue size — Network Rx orTx / Max Dropped Errors Memory Used Swap — Disk % Util Wait time and queue length —
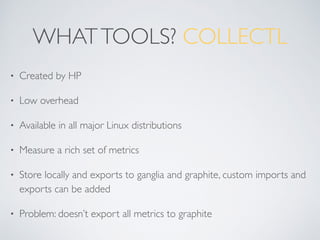
- 8. WHATTOOLS? COLLECTL • Created by HP • Low overhead • Available in all major Linux distributions • Measure a rich set of metrics • Store locally and exports to ganglia and graphite, custom imports and exports can be added • Problem: doesn’t export all metrics to graphite
- 9. WHATTOOLS? COLLECTL • Install: $ sudo apt-get install collectl libwww-curl-perl • Patch graphite export (to fix metrics that aren't included by default): $ wget graphite.patch https://gist.githubusercontent.com/andphe/ 2a08eab7fb4148d33888/raw/5d416d8faa5a9ca535cd5e062622d712f74c6f11/ graphite.patch $ sudo patch -p0 /usr/share/collectl/graphite.ph graphite.patch • Install nginx import module $ git clone https://github.com/andphe/collectl-imports.git $ cd collectl-imports $ sudo cp nginx.ph /usr/share/collectl/
- 10. WHATTOOLS? COLLECTL • Configure (/etc/colletcl.conf): DaemonCommands = -i 10 -s+YZDN --netopts e --import nginx,s=http,h=localhost,p=80,u=nginx_status --export graphite,<ip address>,p=.collectl • Enable Nginx status (/etc/nginx/sites-available/default) location /nginx_status { stub_status on; access_log off; allow 127.0.0.1; deny all; } • Restart: $ sudo /etc/init.d/nginx reload $ sudo /etc/init.d/collectl restart
- 11. WHATTOOLS? LOGSTER • Created by Etsy • Export to ganglia, graphite, statsd, cloudwatch, nagios • Few dependencies • New parsers can be added • 1 minute resolution • Problem: only sends requests / sec per response code
- 12. WHATTOOLS? LOGSTER • Nginx allows to log the request time via $request_time • I created a parser for logster that takes advantage of $request_time • Sends percentiles and max • DOESN’T USE AVERAGES • Sends total of requests per responde code
- 13. WHATTOOLS? LOGSTER • Why a new parser that doesn't use averages: “#LatencyTipOfTheDay:Average (def): a random number that falls somewhere between the maximum and 1/2 the median. Most often used to ignore reality.” by GilTene http:// latencytipoftheday.blogspot.com.co/2014/06/ latencytipoftheday-average-random.html
- 14. WHATTOOLS? LOGSTER • Why a new parser that doesn't use averages: “#LatencyTipOfTheDay: If you are not measuring and/or plotting Max, what are you hiding (from)?” by GilTene http:// latencytipoftheday.blogspot.com.co/2014/06/ latencytipoftheday-if-you-are-not.html
- 15. WHATTOOLS? LOGSTER • Why a new parser that doesn't use averages: More resources about response times in web apps: http://www.infoq.com/presentations/latency-pitfalls by GilTene https://vimeo.com/104129953 by Andre Arko
- 16. WHATTOOLS? LOGSTER • Install: $ sudo apt-get install logtail $ git clone https://github.com/etsy/logster.git $ cd logster && sudo python setup.py install • Configure (add a cron job): * * * * * logster --output=graphite —graphite- host=<ip address>:2003 -p “<hostname>.logster.api" NginxLogster /var/log/nginx/access.log 2>&1 > /tmp/ logster_out.txt
- 17. WHATTOOLS? LOGSTER • Install NginxParser (copy it to parsers folder) $ git clone https://github.com/andphe/logster-parsers.git $ cd logster-parsers $ sudo cp NginxParser.py /usr/local/lib/python2.7/dist-packages/ logster-0.0.1-py2.7.egg/logster/parsers/ • Configure Nginx to log the request time: log_format request_time '$remote_addr - $remote_user [$time_local] ' '"$request" $status "$request_time" $bytes_sent ' '"$http_referer" "$http_user_agent"'; access_log /var/logs/nginx/access.log request_time;