SlideShare a Scribd company logo
Copyright © 2014, Oracle and/or its affiliates. All rights reserved. |1
Mario Beck
MySQL Sales Consulting Manager EMEA
mario.beck@oracle.com
Performance Schema & SYS schema
Copyright © 2014, Oracle and/or its affiliates. All rights reserved. |2
Program Agenda
What is Performance Schema?
Profiling Examples
Improvements made to date in MySQL 5.7
The MySQL SYS Schema
Easy to Use with MySQL Workbench
Copyright © 2014, Oracle and/or its affiliates. All rights reserved. |3
What is Performance Schema?
Copyright © 2014, Oracle and/or its affiliates. All rights reserved. |4
What is Performance Schema anyway?
A storage engine, built for recording instrumentation
– PERFORMANCE_SCHEMA
A database schema to expose the instrumentation
– performance_schema
Records latency of events that happen within the server
All latency exposed to picosecond
Also tracks other information as appropriate
- Bytes, source position, object metadata, etc.
Copyright © 2014, Oracle and/or its affiliates. All rights reserved. |5
Performance Schema in MySQL 5.5
17 Tables
222 Instruments
Instrument Event Class
File IO wait/io/file/%
Mutexes wait/synch/mutex/%
Read/Write Locks wait/synch/rwlock/%
Conditions wait/synch/cond/%
Copyright © 2014, Oracle and/or its affiliates. All rights reserved. |6
Wait Events
mysql> select * from events_waits_history_long where
event_name like 'wait/io/table/%'G
*************************** 1. row ***************************
THREAD_ID: 137746
EVENT_ID: 3604
END_EVENT_ID: 3604
EVENT_NAME: wait/io/table/sql/handler
SOURCE: handler.cc:2568
TIMER_START: 17101711846046490
TIMER_END: 17101711857643010
TIMER_WAIT: 11596520
SPINS: NULL
OBJECT_SCHEMA: mem__events
OBJECT_NAME: events
INDEX_NAME: PRIMARY
OBJECT_TYPE: TABLE
OBJECT_INSTANCE_BEGIN: 140246283168288
NESTING_EVENT_ID: 3603
NESTING_EVENT_TYPE: STAGE
OPERATION: fetch
NUMBER_OF_BYTES: NULL
FLAGS: NULL
Event Context
Event type and origin
Timing (~11.5 microseconds)
Database object info
Object type
Whether the event was nested
Further info as appropriate
Copyright © 2014, Oracle and/or its affiliates. All rights reserved. |7
Performance Schema in MySQL 5.6
52 Tables (+35)
545 Instruments (+323)
Instrument Type Event Class
Statements statement/%
Stages stage/%
Table IO wait/io/table/%
Table Locks wait/lock/table/%
Network IO wait/io/socket/%
Idle Timing idle
Copyright © 2014, Oracle and/or its affiliates. All rights reserved. |8
Statement Events
mysql> select * from events_statements_history_long limit 1G
*************************** 1. row ***************************
THREAD_ID: 138683
EVENT_ID: 11268
END_EVENT_ID: 11295
EVENT_NAME: statement/sql/update
SOURCE: socket_connection.cc:94
TIMER_START: 87644080265364000
TIMER_END: 87644080504810000
TIMER_WAIT: 239446000
LOCK_TIME: 63000000
SQL_TEXT: /* mem dbpool.default */ update
`mem__inventory`.`Agent` set `hasHostname`=1400665852927,
`hasReachable`=1400665852927, `timestamp`=1400665852927,
`hasVersion`=1400665852927 where hid=x'FA8FDC4C1BC344A0899DAB320757CDF2'
DIGEST: cc389abfcb093ae95cacfe42ed085191
DIGEST_TEXT: UPDATE `mem__inventory` . `Agent` SET `hasHostname` = ?
, `hasReachable` = ? , `timestamp` = ? , `hasVersion` = ? WHERE `hid` = ?
CURRENT_SCHEMA: mem
OBJECT_TYPE: NULL
OBJECT_SCHEMA: NULL
OBJECT_NAME: NULL
OBJECT_INSTANCE_BEGIN: NULL
…………
MYSQL_ERRNO: 0
RETURNED_SQLSTATE: 00000
MESSAGE_TEXT: Rows matched: 1
ERRORS: 0
WARNINGS: 0
ROWS_AFFECTED: 1
ROWS_SENT: 0
ROWS_EXAMINED: 1
CREATED_TMP_DISK_TABLES: 0
CREATED_TMP_TABLES: 0
SELECT_FULL_JOIN: 0
SELECT_FULL_RANGE_JOIN: 0
SELECT_RANGE: 0
SELECT_RANGE_CHECK: 0
SELECT_SCAN: 0
SORT_MERGE_PASSES: 0
SORT_RANGE: 0
SORT_ROWS: 0
SORT_SCAN: 0
NO_INDEX_USED: 0
NO_GOOD_INDEX_USED: 0
NESTING_EVENT_ID: 11248
NESTING_EVENT_TYPE: TRANSACTION
NESTING_EVENT_LEVEL: 0
Copyright © 2014, Oracle and/or its affiliates. All rights reserved. |
Stored Programs
Transactions
9
Nested Events
Statements
Stages
Waits MySQL 5.5
MySQL 5.6
MySQL 5.7
mysql> select * from events_waits_history_long
******************** 1. row ********************
...
EVENT_NAME: wait/io/table/sql/handler
...
NESTING_EVENT_ID: 3603
NESTING_EVENT_TYPE: STAGE
Copyright © 2014, Oracle and/or its affiliates. All rights reserved. |1
0
Performance Schema Table Types
Setup Tables
Used to define certain
configuration
dynamically
Can perform DML
against these tables
mysql> select table_name
-> from information_schema.tables
-> where table_schema like 'perf%'
-> and table_name like 'setup%';
+-------------------+
| table_name |
+-------------------+
| setup_actors |
| setup_consumers |
| setup_instruments |
| setup_objects |
| setup_timers |
+-------------------+
Copyright © 2014, Oracle and/or its affiliates. All rights reserved. |1
1
Performance Schema Table Types
Raw Data Tables
Expose events, objects, or
instances of instruments in a
raw manner
Allow seeing a (brief) history
of raw event metrics as well
+-------------------------------------------+
| table_name |
+-------------------------------------------+
| accounts |
| cond_instances |
| events_stages_current |
| events_stages_history |
| events_stages_history_long |
| events_statements_current |
| events_statements_history |
| events_statements_history_long |
| events_waits_current |
| events_waits_history |
| events_waits_history_long |
| file_instances |
| host_cache |
| hosts |
| mutex_instances |
| performance_timers |
| rwlock_instances |
| session_account_connect_attrs |
| session_connect_attrs |
| socket_instances |
| threads |
| users |
+-------------------------------------------+
Copyright © 2014, Oracle and/or its affiliates. All rights reserved. |1
2
Performance Schema Table Types
Summary Tables
Summarise event
information over
multiple dimensions
Useful for longer term
monitoring of activity
+------------------------------------------------------+
| table_name |
+------------------------------------------------------+
| events_stages_summary_by_account_by_event_name |
| events_stages_summary_by_host_by_event_name |
| events_stages_summary_by_thread_by_event_name |
| events_stages_summary_by_user_by_event_name |
| events_stages_summary_global_by_event_name |
| events_statements_summary_by_account_by_event_name |
| events_statements_summary_by_digest |
| events_statements_summary_by_host_by_event_name |
| events_statements_summary_by_program |
| events_statements_summary_by_thread_by_event_name |
| events_statements_summary_by_user_by_event_name |
| events_statements_summary_global_by_event_name |
| events_waits_summary_by_account_by_event_name |
| events_waits_summary_by_host_by_event_name |
| events_waits_summary_by_instance |
| events_waits_summary_by_thread_by_event_name |
| events_waits_summary_by_user_by_event_name |
| events_waits_summary_global_by_event_name |
| file_summary_by_event_name |
| file_summary_by_instance |
| objects_summary_global_by_type |
| socket_summary_by_event_name |
| socket_summary_by_instance |
| table_io_waits_summary_by_index_usage |
| table_io_waits_summary_by_table |
| table_lock_waits_summary_by_table |
+------------------------------------------------------+
Copyright © 2014, Oracle and/or its affiliates. All rights reserved. |13
Performance Schema Configuration
Configure Description
Variables like “perf%” Fixed RAM allocation, fixed size
Status like “perf%lost” Lost events due to too low buffers
Table “setup_instruments” Turn on/off individual instruments
Table “setup_consumers” Configure history / summary tables
Table “setup_objects” Filter events by table/schema
Table “setup_actors” Filter events by user/host
Copyright © 2014, Oracle and/or its affiliates. All rights reserved. |1
4
Profiling Examples
Copyright © 2014, Oracle and/or its affiliates. All rights reserved. |15
Analyzing Global Waits
Some mutex events that can affect global concurrency (if high in list):
 wait/synch/mutex/innodb/buf_pool_mutex
Increase innodb_buffer_pool_instances
 wait/synch/mutex/sql/Query_cache::structure_guard_mutex
 Look in to disabling the Query Cache
 wait/synch/mutex/myisam/MYISAM_SHARE::intern_lock
Use Innodb …
Copyright © 2014, Oracle and/or its affiliates. All rights reserved. |16
Analyzing Global Waits
Some File IO events to watch for (if high in list):
 wait/io/file/sql/FRM
Tune table_open_cache / table_definition_cache
 wait/io/file/sql/file_parser (view definition parsing)
 If high on 5.5, upgrade to 5.6, (which can cache these like tables)
 wait/io/file/sql/query_log and wait/io/file/sql/slow_log
Disable the general
Disable or tune what is logged to the slow log (decent long_query_time)
Copyright © 2014, Oracle and/or its affiliates. All rights reserved. |17
Slave SQL Load Average
Watch wait/synch/cond/sql/MYSQL_RELAY_LOG::update_cond
http://www.markleith.co.uk/2012/07/24/a-mysql-replication-load-average-with-performance-schema/
Copyright © 2014, Oracle and/or its affiliates. All rights reserved. |18
Currently Executing Statements
SELECT_FULL_JOIN: 0
SELECT_FULL_RANGE_JOIN: 0
SELECT_RANGE: 1
SELECT_RANGE_CHECK: 0
SELECT_SCAN: 0
SORT_MERGE_PASSES: 0
SORT_RANGE: 0
SORT_ROWS: 0
SORT_SCAN: 0
NO_INDEX_USED: 0
NO_GOOD_INDEX_USED: 0
NESTING_EVENT_ID: NULL
NESTING_EVENT_TYPE: NULL
NESTING_EVENT_LEVEL: 0
mysql> select * from events_statements_current where timer_end is nullG
*************************** 8. row ***************************
THREAD_ID: 156945
EVENT_ID: 15312
END_EVENT_ID: NULL
EVENT_NAME: statement/sql/select
SOURCE: socket_connection.cc:94
TIMER_START: 99343994725205000
TIMER_END: NULL
TIMER_WAIT: NULL
LOCK_TIME: 145000000
SQL_TEXT: /* mem dbpool.ui */ select normalized0_.round_robin_bin as round1_1256_, /* ..snip .. */
DIGEST: NULL
DIGEST_TEXT: NULL
CURRENT_SCHEMA: mem
OBJECT_TYPE: NULL
OBJECT_SCHEMA: NULL
OBJECT_NAME: NULL
OBJECT_INSTANCE_BEGIN: NULL
MYSQL_ERRNO: 0
RETURNED_SQLSTATE: NULL
MESSAGE_TEXT: NULL
ERRORS: 0
WARNINGS: 0
ROWS_AFFECTED: 0
ROWS_SENT: 27
ROWS_EXAMINED: 0
CREATED_TMP_DISK_TABLES: 0
CREATED_TMP_TABLES: 0
All counters are live, and
increment whilst the statements
execute
Copyright © 2014, Oracle and/or its affiliates. All rights reserved. |1
9
Improvements made to date in
MySQL 5.7
Copyright © 2014, Oracle and/or its affiliates. All rights reserved. |
Insert Picture Here
20
Memory Usage
Metadata Locking
Replication Configuration & Status
Prepared Statements
Transactions
Stored Programs
Copyright © 2014, Oracle and/or its affiliates. All rights reserved. |2
1
Instrument memory usage - thread details
mysql> SELECT event_name,
-> sys.format_bytes(current_number_of_bytes_used) AS current_used
-> FROM performance_schema.memory_summary_by_thread_by_event_name
-> WHERE thread_id = 24
-> ORDER BY current_number_of_bytes_used DESC;
+-----------------------------------------------------+--------------+
| event_name | current_used |
+-----------------------------------------------------+--------------+
| memory/sql/Filesort_buffer::sort_keys | 255.94 KiB |
| memory/sql/sp_head::main_mem_root | 103.64 KiB |
| memory/mysys/IO_CACHE | 64.05 KiB |
| memory/mysys/lf_dynarray | 46.17 KiB |
| memory/mysys/array_buffer | 24.20 KiB |
| memory/sql/thd::main_mem_root | 23.95 KiB |
| memory/sql/String::value | 16.13 KiB |
| memory/sql/TABLE | 9.44 KiB |
| memory/sql/TABLE_SHARE::mem_root | 8.70 KiB |
| memory/myisam/MI_INFO | 7.07 KiB |
| memory/sql/THD::transactions::mem_root | 4.02 KiB |
Copyright © 2014, Oracle and/or its affiliates. All rights reserved. |2
2
The MySQL SYS Schema
Copyright © 2014, Oracle and/or its affiliates. All rights reserved. |23
MySQL SYS Schema Overview
Originally called “ps_helper”
Started as a collection of views, procedures and functions, designed to
make reading raw Performance Schema data easier
Implements many of the common DBA and Developer use cases,
including many of those shown already
Now bundled within MySQL Workbench 6.1
Available on GitHub
https://github.com/MarkLeith/mysql-sys
Copyright © 2014, Oracle and/or its affiliates. All rights reserved. |2
4
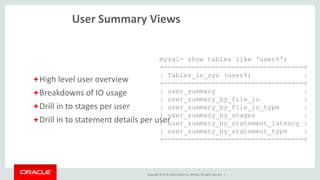
User Summary Views
High level user overview
Breakdowns of IO usage
Drill in to stages per user
Drill in to statement details per user
mysql> show tables like 'user%';
+-----------------------------------+
| Tables_in_sys (user%) |
+-----------------------------------+
| user_summary |
| user_summary_by_file_io |
| user_summary_by_file_io_type |
| user_summary_by_stages |
| user_summary_by_statement_latency |
| user_summary_by_statement_type |
+-----------------------------------+
Copyright © 2014, Oracle and/or its affiliates. All rights reserved. |2
5
IO Summary Views
IO breakdown by thread
Global summaries
by file and wait class,
by both bytes and latency
Stream of last raw file IO stats
mysql> show tables like 'io_%';
+------------------------------+
| Tables_in_sys (io_%) |
+------------------------------+
| io_by_thread_by_latency |
| io_global_by_file_by_bytes |
| io_global_by_file_by_latency |
| io_global_by_wait_by_bytes |
| io_global_by_wait_by_latency |
| latest_file_io |
+------------------------------+
Copyright © 2014, Oracle and/or its affiliates. All rights reserved. |2
6
Schema Analysis Views
Object overview
Table usage stats
Index usage stats
mysql> show tables like 'schema%';
+-------------------------------------+
| Tables_in_sys (schema%) |
+-------------------------------------+
| schema_index_statistics |
| schema_object_overview |
| schema_table_statistics |
| schema_table_statistics_with_buffer |
| schema_tables_with_full_table_scans |
| schema_unused_indexes |
+-------------------------------------+
Copyright © 2014, Oracle and/or its affiliates. All rights reserved. |2
7
InnoDB Buffer Usage Views
Buffer usage by schema
Buffer usage by table
mysql> show tables like 'innodb%';
+-------------------------------+
| Tables_in_sys (innodb%) |
+-------------------------------+
| innodb_buffer_stats_by_schema |
| innodb_buffer_stats_by_table |
+-------------------------------+
Copyright © 2014, Oracle and/or its affiliates. All rights reserved. |2
8
Statement Analysis Views
Statement overview
Find statements by errors, full scans,
sorting, temporary tables
Find the statements with the longest
runtimes
mysql> show tables like 'statement%';
+---------------------------------------------+
| Tables_in_sys (statement%) |
+---------------------------------------------+
| statement_analysis |
| statements_with_errors_or_warnings |
| statements_with_full_table_scans |
| statements_with_runtimes_in_95th_percentile |
| statements_with_sorting |
| statements_with_temp_tables |
+---------------------------------------------+
Copyright © 2014, Oracle and/or its affiliates. All rights reserved. |2
9
Wait summaries by class
and per instrument
globally
Wait details per user
mysql> show tables like 'wait%';
+------------------------------------+
| Tables_in_sys (wait%) |
+------------------------------------+
| wait_classes_global_by_avg_latency |
| wait_classes_global_by_latency |
| waits_by_user_by_latency |
| waits_global_by_latency |
+------------------------------------+
Wait Analysis Views
Copyright © 2014, Oracle and/or its affiliates. All rights reserved. |3
0
Easy to use with MySQL Workbench
Copyright © 2014, Oracle and/or its affiliates. All rights reserved. |
MySQL Workbench Overview
Design, Develop, Administer, Migrate
And now adding – Performance
• MySQL Database IDE
• Millions of Users
• Millions of Downloads
• Windows, OS X, Linux
Copyright © 2014, Oracle and/or its affiliates. All rights reserved. |
Performance Schema Reports
• Connect
• (DB Click or Open and Connect)
• Go to Management Tab
• If needed (Bottom Left)
• Go to Performance Reports
• New Performance Section
Copyright © 2014, Oracle and/or its affiliates. All rights reserved. |
New Screen – Performance Schema Setup
YES – its on
NO – its off
Advanced –
for power users
Copyright © 2014, Oracle and/or its affiliates. All rights reserved. |
Open Settings
Before Running Performance Reports
Copyright © 2014, Oracle and/or its affiliates. All rights reserved. |
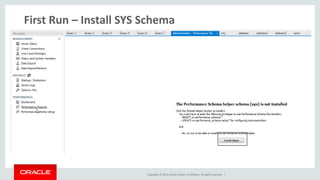
First Run – Install SYS Schema
Copyright © 2014, Oracle and/or its affiliates. All rights reserved. |
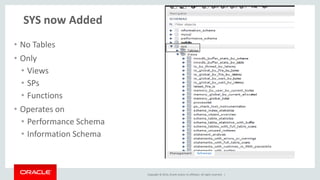
SYS now Added
• No Tables
• Only
• Views
• SPs
• Functions
• Operates on
• Performance Schema
• Information Schema
Copyright © 2014, Oracle and/or its affiliates. All rights reserved. |
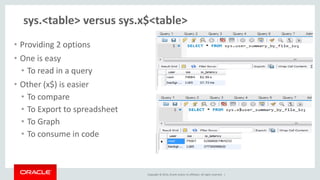
sys.<table> versus sys.x$<table>
• Providing 2 options
• One is easy
• To read in a query
• Other (x$) is easier
• To compare
• To Export to spreadsheet
• To Graph
• To consume in code
Copyright © 2014, Oracle and/or its affiliates. All rights reserved. |
SYS - SPs and Functions
SPs Used to
simplify management
FUNCTIONS
Used for Formatting
and Simple Checks
Copyright © 2014, Oracle and/or its affiliates. All rights reserved. |
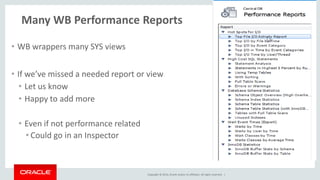
Many WB Performance Reports
• WB wrappers many SYS views
• If we’ve missed a needed report or view
• Let us know
• Happy to add more
• Even if not performance related
• Could go in an Inspector
Copyright © 2014, Oracle and/or its affiliates. All rights reserved. |
General Lay Out - Header
Title and Brief Description
Sortable Columns
Column Labels indicate Units
Copyright © 2014, Oracle and/or its affiliates. All rights reserved. |
General Lay Out – Footer
Copyright © 2014, Oracle and/or its affiliates. All rights reserved. |
Reports #1: IO Reports
• For
– Files, Event Categories, User/Thread
• Quickly
– View, Sort
– By #, Time, Reads, Writes, Percentages
• Look for Hot Spots
– Use to determine system requirements, tuning, etc.
Copyright © 2014, Oracle and/or its affiliates. All rights reserved. |
Reports #2: High Cost SQL Statements
• Look at query statements and statistics
• Look for Full Table Scans
• Frequency of execution
• Errors, Warnings
• Long Runtimes – Total, Max, Ave
• Large numbers of Rows – Total, Max, Ave
• Usage of Temp Tables
Copyright © 2014, Oracle and/or its affiliates. All rights reserved. |
Reports #3: Database Schema Statistics
• Quickly Review Various Stats
– Counts
– Rows
– Timing
– Paging
– Buffering
– IOs
• Easily find Full Scans
• Spot Unused Indexes
• Also See Schema/Table Inspectors
– Table, Column, Index,… Statis
Copyright © 2014, Oracle and/or its affiliates. All rights reserved. |
Reports #5: Wait Event Times (For Experts)
• Wait Event Analysis is Complex
• However for power expert users
– These reports show collected data
– Show the queries used to collect
– Provides Statistics
– Breaks out events by Users and Classes
Copyright © 2014, Oracle and/or its affiliates. All rights reserved. |
Reports #6: InnoDB Statistics
• Quick views
– Aggregated
• By Schema
• By Table
– Easy to sort by
• Allocation, Data,
• Pages, Pages hashed, Old Pages
• Rows cached
Copyright © 2014, Oracle and/or its affiliates. All rights reserved. |
Quick Links
• Download:
–http://dev.mysql.com/downloads/tools/workbench/
• Bugs:
–http://bugs.mysql.com
• Forums:
–http://forums.mysql.com/index.php?151
Copyright © 2014, Oracle and/or its affiliates. All rights reserved. |
Supporting Resources
• Oracle and MySQL
• MySQL
• MySQL Workbench
• Team Blog
–https://blogs.oracle.com/mysqlworkbench/
• MySQL Community Edition
• MySQL Enterprise Edition
• MySQL Blog, Twitter, Facebook
• Optimizer Blog
–http://oysteing.blogspot.co.uk/
MySQL's Performance Schema, SYS Schema and Workbench Integration

More Related Content

What's hot (20)

ODP
Performance schema and_ps_helper
Mark Leith
 
ODP
MySQL Administration and Monitoring
Mark Leith
 
ODP
Getting to Know MySQL Enterprise Monitor
Mark Leith
 
PDF
MySQL for Oracle DBAs
Mark Leith
 
PDF
Instrumenting plugins for Performance Schema
Mark Leith
 
ODP
Introduction to MySQL Enterprise Monitor
Mark Leith
 
PDF
Mysql tech day_paris_ps_and_sys
Mark Leith
 
PDF
MySQL Monitoring 101
Ronald Bradford
 
PDF
Basic MySQL Troubleshooting for Oracle DBAs
Sveta Smirnova
 
ODP
MySQL Monitoring Mechanisms
Mark Leith
 
PDF
MySQL Enterprise Monitor
Mario Beck
 
PPT
Developing Information Schema Plugins
Mark Leith
 
PDF
Oracle Exadata Maintenance tasks 101 - OTN Tour 2015
Nelson Calero
 
PDF
MySQL Troubleshooting with the Performance Schema
Sveta Smirnova
 
PDF
Oracle Failover Database Cluster with Grid Infrastructure 12c
Trivadis
 
PDF
My sql 5.6&MySQL Cluster 7.3
Oleksii(Alexey) Porytskyi
 
PDF
My sql 5.7-upcoming-changes-v2
Morgan Tocker
 
PDF
Tx lf propercareandfeedmysql
Dave Stokes
 
PDF
Double the Performance of Oracle SOA Suite 11g? Absolutely!
Revelation Technologies
 
PDF
Basic MySQL Troubleshooting for Oracle DBAs
Sveta Smirnova
 
Performance schema and_ps_helper
Mark Leith
 
MySQL Administration and Monitoring
Mark Leith
 
Getting to Know MySQL Enterprise Monitor
Mark Leith
 
MySQL for Oracle DBAs
Mark Leith
 
Instrumenting plugins for Performance Schema
Mark Leith
 
Introduction to MySQL Enterprise Monitor
Mark Leith
 
Mysql tech day_paris_ps_and_sys
Mark Leith
 
MySQL Monitoring 101
Ronald Bradford
 
Basic MySQL Troubleshooting for Oracle DBAs
Sveta Smirnova
 
MySQL Monitoring Mechanisms
Mark Leith
 
MySQL Enterprise Monitor
Mario Beck
 
Developing Information Schema Plugins
Mark Leith
 
Oracle Exadata Maintenance tasks 101 - OTN Tour 2015
Nelson Calero
 
MySQL Troubleshooting with the Performance Schema
Sveta Smirnova
 
Oracle Failover Database Cluster with Grid Infrastructure 12c
Trivadis
 
My sql 5.6&MySQL Cluster 7.3
Oleksii(Alexey) Porytskyi
 
My sql 5.7-upcoming-changes-v2
Morgan Tocker
 
Tx lf propercareandfeedmysql
Dave Stokes
 
Double the Performance of Oracle SOA Suite 11g? Absolutely!
Revelation Technologies
 
Basic MySQL Troubleshooting for Oracle DBAs
Sveta Smirnova
 

Similar to MySQL's Performance Schema, SYS Schema and Workbench Integration (20)

PPTX
MySQL Performance Schema : fossasia
Mayank Prasad
 
PDF
20150110 my sql-performanceschema
Ivan Ma
 
PPTX
MySQL Performance Schema in MySQL 8.0
Mayank Prasad
 
PPTX
Mysql Performance Schema - fossasia 2016
Mayank Prasad
 
PPTX
MySQL Performance Schema, Open Source India, 2015
Mayank Prasad
 
PDF
Performance Schema for MySQL Troubleshooting
Sveta Smirnova
 
PDF
MySQL Performance Schema in 20 Minutes
Sveta Smirnova
 
PPTX
OUGLS 2016: How profiling works in MySQL
Georgi Kodinov
 
PDF
Performance Schema for MySQL troubleshooting
Sveta Smirnova
 
PDF
MySQL Performance Schema in Action
Sveta Smirnova
 
PDF
MySQL Performance schema missing_manual_flossuk
Valeriy Kravchuk
 
PDF
Performance Schema for MySQL Troubleshooting
Sveta Smirnova
 
PDF
MySQL Performance Schema in Action
Sveta Smirnova
 
PPT
OSI_MySQL_Performance Schema
Mayank Prasad
 
PDF
MySQL Performance Schema in Action: the Complete Tutorial
Sveta Smirnova
 
PDF
MySQL Enterprise Monitor
Mark Swarbrick
 
PDF
How to analyze and tune sql queries for better performance vts2016
oysteing
 
PDF
MySQL-Performance Schema- What's new in MySQL-5.7 DMRs
Mayank Prasad
 
PDF
MySQL Performance Schema in Action
Mydbops
 
PDF
Performance Schema for MySQL Troubleshooting
Sveta Smirnova
 
MySQL Performance Schema : fossasia
Mayank Prasad
 
20150110 my sql-performanceschema
Ivan Ma
 
MySQL Performance Schema in MySQL 8.0
Mayank Prasad
 
Mysql Performance Schema - fossasia 2016
Mayank Prasad
 
MySQL Performance Schema, Open Source India, 2015
Mayank Prasad
 
Performance Schema for MySQL Troubleshooting
Sveta Smirnova
 
MySQL Performance Schema in 20 Minutes
Sveta Smirnova
 
OUGLS 2016: How profiling works in MySQL
Georgi Kodinov
 
Performance Schema for MySQL troubleshooting
Sveta Smirnova
 
MySQL Performance Schema in Action
Sveta Smirnova
 
MySQL Performance schema missing_manual_flossuk
Valeriy Kravchuk
 
Performance Schema for MySQL Troubleshooting
Sveta Smirnova
 
MySQL Performance Schema in Action
Sveta Smirnova
 
OSI_MySQL_Performance Schema
Mayank Prasad
 
MySQL Performance Schema in Action: the Complete Tutorial
Sveta Smirnova
 
MySQL Enterprise Monitor
Mark Swarbrick
 
How to analyze and tune sql queries for better performance vts2016
oysteing
 
MySQL-Performance Schema- What's new in MySQL-5.7 DMRs
Mayank Prasad
 
MySQL Performance Schema in Action
Mydbops
 
Performance Schema for MySQL Troubleshooting
Sveta Smirnova
 
Ad

More from Mario Beck (15)

PDF
MySQL Enterprise Edition Overview
Mario Beck
 
PDF
MySQL Cloud Service
Mario Beck
 
PDF
Oracle Enterprise Manager for MySQL
Mario Beck
 
PDF
MySQL InnoDB Cluster and NDB Cluster
Mario Beck
 
PDF
MySQL Enterprise Backup
Mario Beck
 
PDF
MySQL Document Store
Mario Beck
 
PDF
MySQL for Software-as-a-Service (SaaS)
Mario Beck
 
PDF
NoSQL and MySQL: News about JSON
Mario Beck
 
PDF
MySQL 5.7: Focus on Replication
Mario Beck
 
PDF
MySQL 5.7: Focus on InnoDB
Mario Beck
 
PDF
MySQL 5.7: What's New, Nov. 2015
Mario Beck
 
PDF
MySQL Security
Mario Beck
 
PDF
MySQL for Oracle DBAs
Mario Beck
 
PDF
MySQL Cluster
Mario Beck
 
PDF
MySQL Community and Commercial Edition
Mario Beck
 
MySQL Enterprise Edition Overview
Mario Beck
 
MySQL Cloud Service
Mario Beck
 
Oracle Enterprise Manager for MySQL
Mario Beck
 
MySQL InnoDB Cluster and NDB Cluster
Mario Beck
 
MySQL Enterprise Backup
Mario Beck
 
MySQL Document Store
Mario Beck
 
MySQL for Software-as-a-Service (SaaS)
Mario Beck
 
NoSQL and MySQL: News about JSON
Mario Beck
 
MySQL 5.7: Focus on Replication
Mario Beck
 
MySQL 5.7: Focus on InnoDB
Mario Beck
 
MySQL 5.7: What's New, Nov. 2015
Mario Beck
 
MySQL Security
Mario Beck
 
MySQL for Oracle DBAs
Mario Beck
 
MySQL Cluster
Mario Beck
 
MySQL Community and Commercial Edition
Mario Beck
 
Ad

Recently uploaded (20)

PDF
What Makes Contify’s News API Stand Out: Key Features at a Glance
Contify
 
PDF
Newgen Beyond Frankenstein_Build vs Buy_Digital_version.pdf
darshakparmar
 
PDF
The Rise of AI and IoT in Mobile App Tech.pdf
IMG Global Infotech
 
PDF
CIFDAQ Token Spotlight for 9th July 2025
CIFDAQ
 
PPTX
AUTOMATION AND ROBOTICS IN PHARMA INDUSTRY.pptx
sameeraaabegumm
 
PDF
IoT-Powered Industrial Transformation – Smart Manufacturing to Connected Heal...
Rejig Digital
 
DOCX
Python coding for beginners !! Start now!#
Rajni Bhardwaj Grover
 
PDF
CIFDAQ Market Wrap for the week of 4th July 2025
CIFDAQ
 
PDF
Transcript: New from BookNet Canada for 2025: BNC BiblioShare - Tech Forum 2025
BookNet Canada
 
PDF
"AI Transformation: Directions and Challenges", Pavlo Shaternik
Fwdays
 
PPTX
Future Tech Innovations 2025 – A TechLists Insight
TechLists
 
PDF
POV_ Why Enterprises Need to Find Value in ZERO.pdf
darshakparmar
 
PDF
Smart Trailers 2025 Update with History and Overview
Paul Menig
 
PPTX
Building Search Using OpenSearch: Limitations and Workarounds
Sease
 
PDF
Newgen 2022-Forrester Newgen TEI_13 05 2022-The-Total-Economic-Impact-Newgen-...
darshakparmar
 
PPTX
The Project Compass - GDG on Campus MSIT
dscmsitkol
 
PDF
Mastering Financial Management in Direct Selling
Epixel MLM Software
 
PDF
Using FME to Develop Self-Service CAD Applications for a Major UK Police Force
Safe Software
 
PPTX
AI Penetration Testing Essentials: A Cybersecurity Guide for 2025
defencerabbit Team
 
DOCX
Cryptography Quiz: test your knowledge of this important security concept.
Rajni Bhardwaj Grover
 
What Makes Contify’s News API Stand Out: Key Features at a Glance
Contify
 
Newgen Beyond Frankenstein_Build vs Buy_Digital_version.pdf
darshakparmar
 
The Rise of AI and IoT in Mobile App Tech.pdf
IMG Global Infotech
 
CIFDAQ Token Spotlight for 9th July 2025
CIFDAQ
 
AUTOMATION AND ROBOTICS IN PHARMA INDUSTRY.pptx
sameeraaabegumm
 
IoT-Powered Industrial Transformation – Smart Manufacturing to Connected Heal...
Rejig Digital
 
Python coding for beginners !! Start now!#
Rajni Bhardwaj Grover
 
CIFDAQ Market Wrap for the week of 4th July 2025
CIFDAQ
 
Transcript: New from BookNet Canada for 2025: BNC BiblioShare - Tech Forum 2025
BookNet Canada
 
"AI Transformation: Directions and Challenges", Pavlo Shaternik
Fwdays
 
Future Tech Innovations 2025 – A TechLists Insight
TechLists
 
POV_ Why Enterprises Need to Find Value in ZERO.pdf
darshakparmar
 
Smart Trailers 2025 Update with History and Overview
Paul Menig
 
Building Search Using OpenSearch: Limitations and Workarounds
Sease
 
Newgen 2022-Forrester Newgen TEI_13 05 2022-The-Total-Economic-Impact-Newgen-...
darshakparmar
 
The Project Compass - GDG on Campus MSIT
dscmsitkol
 
Mastering Financial Management in Direct Selling
Epixel MLM Software
 
Using FME to Develop Self-Service CAD Applications for a Major UK Police Force
Safe Software
 
AI Penetration Testing Essentials: A Cybersecurity Guide for 2025
defencerabbit Team
 
Cryptography Quiz: test your knowledge of this important security concept.
Rajni Bhardwaj Grover
 

MySQL's Performance Schema, SYS Schema and Workbench Integration

  • 1. Copyright © 2014, Oracle and/or its affiliates. All rights reserved. |1 Mario Beck MySQL Sales Consulting Manager EMEA [email protected] Performance Schema & SYS schema
  • 2. Copyright © 2014, Oracle and/or its affiliates. All rights reserved. |2 Program Agenda What is Performance Schema? Profiling Examples Improvements made to date in MySQL 5.7 The MySQL SYS Schema Easy to Use with MySQL Workbench
  • 3. Copyright © 2014, Oracle and/or its affiliates. All rights reserved. |3 What is Performance Schema?
  • 4. Copyright © 2014, Oracle and/or its affiliates. All rights reserved. |4 What is Performance Schema anyway? A storage engine, built for recording instrumentation – PERFORMANCE_SCHEMA A database schema to expose the instrumentation – performance_schema Records latency of events that happen within the server All latency exposed to picosecond Also tracks other information as appropriate - Bytes, source position, object metadata, etc.
  • 5. Copyright © 2014, Oracle and/or its affiliates. All rights reserved. |5 Performance Schema in MySQL 5.5 17 Tables 222 Instruments Instrument Event Class File IO wait/io/file/% Mutexes wait/synch/mutex/% Read/Write Locks wait/synch/rwlock/% Conditions wait/synch/cond/%
  • 6. Copyright © 2014, Oracle and/or its affiliates. All rights reserved. |6 Wait Events mysql> select * from events_waits_history_long where event_name like 'wait/io/table/%'G *************************** 1. row *************************** THREAD_ID: 137746 EVENT_ID: 3604 END_EVENT_ID: 3604 EVENT_NAME: wait/io/table/sql/handler SOURCE: handler.cc:2568 TIMER_START: 17101711846046490 TIMER_END: 17101711857643010 TIMER_WAIT: 11596520 SPINS: NULL OBJECT_SCHEMA: mem__events OBJECT_NAME: events INDEX_NAME: PRIMARY OBJECT_TYPE: TABLE OBJECT_INSTANCE_BEGIN: 140246283168288 NESTING_EVENT_ID: 3603 NESTING_EVENT_TYPE: STAGE OPERATION: fetch NUMBER_OF_BYTES: NULL FLAGS: NULL Event Context Event type and origin Timing (~11.5 microseconds) Database object info Object type Whether the event was nested Further info as appropriate
  • 7. Copyright © 2014, Oracle and/or its affiliates. All rights reserved. |7 Performance Schema in MySQL 5.6 52 Tables (+35) 545 Instruments (+323) Instrument Type Event Class Statements statement/% Stages stage/% Table IO wait/io/table/% Table Locks wait/lock/table/% Network IO wait/io/socket/% Idle Timing idle
  • 8. Copyright © 2014, Oracle and/or its affiliates. All rights reserved. |8 Statement Events mysql> select * from events_statements_history_long limit 1G *************************** 1. row *************************** THREAD_ID: 138683 EVENT_ID: 11268 END_EVENT_ID: 11295 EVENT_NAME: statement/sql/update SOURCE: socket_connection.cc:94 TIMER_START: 87644080265364000 TIMER_END: 87644080504810000 TIMER_WAIT: 239446000 LOCK_TIME: 63000000 SQL_TEXT: /* mem dbpool.default */ update `mem__inventory`.`Agent` set `hasHostname`=1400665852927, `hasReachable`=1400665852927, `timestamp`=1400665852927, `hasVersion`=1400665852927 where hid=x'FA8FDC4C1BC344A0899DAB320757CDF2' DIGEST: cc389abfcb093ae95cacfe42ed085191 DIGEST_TEXT: UPDATE `mem__inventory` . `Agent` SET `hasHostname` = ? , `hasReachable` = ? , `timestamp` = ? , `hasVersion` = ? WHERE `hid` = ? CURRENT_SCHEMA: mem OBJECT_TYPE: NULL OBJECT_SCHEMA: NULL OBJECT_NAME: NULL OBJECT_INSTANCE_BEGIN: NULL ………… MYSQL_ERRNO: 0 RETURNED_SQLSTATE: 00000 MESSAGE_TEXT: Rows matched: 1 ERRORS: 0 WARNINGS: 0 ROWS_AFFECTED: 1 ROWS_SENT: 0 ROWS_EXAMINED: 1 CREATED_TMP_DISK_TABLES: 0 CREATED_TMP_TABLES: 0 SELECT_FULL_JOIN: 0 SELECT_FULL_RANGE_JOIN: 0 SELECT_RANGE: 0 SELECT_RANGE_CHECK: 0 SELECT_SCAN: 0 SORT_MERGE_PASSES: 0 SORT_RANGE: 0 SORT_ROWS: 0 SORT_SCAN: 0 NO_INDEX_USED: 0 NO_GOOD_INDEX_USED: 0 NESTING_EVENT_ID: 11248 NESTING_EVENT_TYPE: TRANSACTION NESTING_EVENT_LEVEL: 0
  • 9. Copyright © 2014, Oracle and/or its affiliates. All rights reserved. | Stored Programs Transactions 9 Nested Events Statements Stages Waits MySQL 5.5 MySQL 5.6 MySQL 5.7 mysql> select * from events_waits_history_long ******************** 1. row ******************** ... EVENT_NAME: wait/io/table/sql/handler ... NESTING_EVENT_ID: 3603 NESTING_EVENT_TYPE: STAGE
  • 10. Copyright © 2014, Oracle and/or its affiliates. All rights reserved. |1 0 Performance Schema Table Types Setup Tables Used to define certain configuration dynamically Can perform DML against these tables mysql> select table_name -> from information_schema.tables -> where table_schema like 'perf%' -> and table_name like 'setup%'; +-------------------+ | table_name | +-------------------+ | setup_actors | | setup_consumers | | setup_instruments | | setup_objects | | setup_timers | +-------------------+
  • 11. Copyright © 2014, Oracle and/or its affiliates. All rights reserved. |1 1 Performance Schema Table Types Raw Data Tables Expose events, objects, or instances of instruments in a raw manner Allow seeing a (brief) history of raw event metrics as well +-------------------------------------------+ | table_name | +-------------------------------------------+ | accounts | | cond_instances | | events_stages_current | | events_stages_history | | events_stages_history_long | | events_statements_current | | events_statements_history | | events_statements_history_long | | events_waits_current | | events_waits_history | | events_waits_history_long | | file_instances | | host_cache | | hosts | | mutex_instances | | performance_timers | | rwlock_instances | | session_account_connect_attrs | | session_connect_attrs | | socket_instances | | threads | | users | +-------------------------------------------+
  • 12. Copyright © 2014, Oracle and/or its affiliates. All rights reserved. |1 2 Performance Schema Table Types Summary Tables Summarise event information over multiple dimensions Useful for longer term monitoring of activity +------------------------------------------------------+ | table_name | +------------------------------------------------------+ | events_stages_summary_by_account_by_event_name | | events_stages_summary_by_host_by_event_name | | events_stages_summary_by_thread_by_event_name | | events_stages_summary_by_user_by_event_name | | events_stages_summary_global_by_event_name | | events_statements_summary_by_account_by_event_name | | events_statements_summary_by_digest | | events_statements_summary_by_host_by_event_name | | events_statements_summary_by_program | | events_statements_summary_by_thread_by_event_name | | events_statements_summary_by_user_by_event_name | | events_statements_summary_global_by_event_name | | events_waits_summary_by_account_by_event_name | | events_waits_summary_by_host_by_event_name | | events_waits_summary_by_instance | | events_waits_summary_by_thread_by_event_name | | events_waits_summary_by_user_by_event_name | | events_waits_summary_global_by_event_name | | file_summary_by_event_name | | file_summary_by_instance | | objects_summary_global_by_type | | socket_summary_by_event_name | | socket_summary_by_instance | | table_io_waits_summary_by_index_usage | | table_io_waits_summary_by_table | | table_lock_waits_summary_by_table | +------------------------------------------------------+
  • 13. Copyright © 2014, Oracle and/or its affiliates. All rights reserved. |13 Performance Schema Configuration Configure Description Variables like “perf%” Fixed RAM allocation, fixed size Status like “perf%lost” Lost events due to too low buffers Table “setup_instruments” Turn on/off individual instruments Table “setup_consumers” Configure history / summary tables Table “setup_objects” Filter events by table/schema Table “setup_actors” Filter events by user/host
  • 14. Copyright © 2014, Oracle and/or its affiliates. All rights reserved. |1 4 Profiling Examples
  • 15. Copyright © 2014, Oracle and/or its affiliates. All rights reserved. |15 Analyzing Global Waits Some mutex events that can affect global concurrency (if high in list):  wait/synch/mutex/innodb/buf_pool_mutex Increase innodb_buffer_pool_instances  wait/synch/mutex/sql/Query_cache::structure_guard_mutex  Look in to disabling the Query Cache  wait/synch/mutex/myisam/MYISAM_SHARE::intern_lock Use Innodb …
  • 16. Copyright © 2014, Oracle and/or its affiliates. All rights reserved. |16 Analyzing Global Waits Some File IO events to watch for (if high in list):  wait/io/file/sql/FRM Tune table_open_cache / table_definition_cache  wait/io/file/sql/file_parser (view definition parsing)  If high on 5.5, upgrade to 5.6, (which can cache these like tables)  wait/io/file/sql/query_log and wait/io/file/sql/slow_log Disable the general Disable or tune what is logged to the slow log (decent long_query_time)
  • 17. Copyright © 2014, Oracle and/or its affiliates. All rights reserved. |17 Slave SQL Load Average Watch wait/synch/cond/sql/MYSQL_RELAY_LOG::update_cond http://www.markleith.co.uk/2012/07/24/a-mysql-replication-load-average-with-performance-schema/
  • 18. Copyright © 2014, Oracle and/or its affiliates. All rights reserved. |18 Currently Executing Statements SELECT_FULL_JOIN: 0 SELECT_FULL_RANGE_JOIN: 0 SELECT_RANGE: 1 SELECT_RANGE_CHECK: 0 SELECT_SCAN: 0 SORT_MERGE_PASSES: 0 SORT_RANGE: 0 SORT_ROWS: 0 SORT_SCAN: 0 NO_INDEX_USED: 0 NO_GOOD_INDEX_USED: 0 NESTING_EVENT_ID: NULL NESTING_EVENT_TYPE: NULL NESTING_EVENT_LEVEL: 0 mysql> select * from events_statements_current where timer_end is nullG *************************** 8. row *************************** THREAD_ID: 156945 EVENT_ID: 15312 END_EVENT_ID: NULL EVENT_NAME: statement/sql/select SOURCE: socket_connection.cc:94 TIMER_START: 99343994725205000 TIMER_END: NULL TIMER_WAIT: NULL LOCK_TIME: 145000000 SQL_TEXT: /* mem dbpool.ui */ select normalized0_.round_robin_bin as round1_1256_, /* ..snip .. */ DIGEST: NULL DIGEST_TEXT: NULL CURRENT_SCHEMA: mem OBJECT_TYPE: NULL OBJECT_SCHEMA: NULL OBJECT_NAME: NULL OBJECT_INSTANCE_BEGIN: NULL MYSQL_ERRNO: 0 RETURNED_SQLSTATE: NULL MESSAGE_TEXT: NULL ERRORS: 0 WARNINGS: 0 ROWS_AFFECTED: 0 ROWS_SENT: 27 ROWS_EXAMINED: 0 CREATED_TMP_DISK_TABLES: 0 CREATED_TMP_TABLES: 0 All counters are live, and increment whilst the statements execute
  • 19. Copyright © 2014, Oracle and/or its affiliates. All rights reserved. |1 9 Improvements made to date in MySQL 5.7
  • 20. Copyright © 2014, Oracle and/or its affiliates. All rights reserved. | Insert Picture Here 20 Memory Usage Metadata Locking Replication Configuration & Status Prepared Statements Transactions Stored Programs
  • 21. Copyright © 2014, Oracle and/or its affiliates. All rights reserved. |2 1 Instrument memory usage - thread details mysql> SELECT event_name, -> sys.format_bytes(current_number_of_bytes_used) AS current_used -> FROM performance_schema.memory_summary_by_thread_by_event_name -> WHERE thread_id = 24 -> ORDER BY current_number_of_bytes_used DESC; +-----------------------------------------------------+--------------+ | event_name | current_used | +-----------------------------------------------------+--------------+ | memory/sql/Filesort_buffer::sort_keys | 255.94 KiB | | memory/sql/sp_head::main_mem_root | 103.64 KiB | | memory/mysys/IO_CACHE | 64.05 KiB | | memory/mysys/lf_dynarray | 46.17 KiB | | memory/mysys/array_buffer | 24.20 KiB | | memory/sql/thd::main_mem_root | 23.95 KiB | | memory/sql/String::value | 16.13 KiB | | memory/sql/TABLE | 9.44 KiB | | memory/sql/TABLE_SHARE::mem_root | 8.70 KiB | | memory/myisam/MI_INFO | 7.07 KiB | | memory/sql/THD::transactions::mem_root | 4.02 KiB |
  • 22. Copyright © 2014, Oracle and/or its affiliates. All rights reserved. |2 2 The MySQL SYS Schema
  • 23. Copyright © 2014, Oracle and/or its affiliates. All rights reserved. |23 MySQL SYS Schema Overview Originally called “ps_helper” Started as a collection of views, procedures and functions, designed to make reading raw Performance Schema data easier Implements many of the common DBA and Developer use cases, including many of those shown already Now bundled within MySQL Workbench 6.1 Available on GitHub https://github.com/MarkLeith/mysql-sys
  • 24. Copyright © 2014, Oracle and/or its affiliates. All rights reserved. |2 4 User Summary Views High level user overview Breakdowns of IO usage Drill in to stages per user Drill in to statement details per user mysql> show tables like 'user%'; +-----------------------------------+ | Tables_in_sys (user%) | +-----------------------------------+ | user_summary | | user_summary_by_file_io | | user_summary_by_file_io_type | | user_summary_by_stages | | user_summary_by_statement_latency | | user_summary_by_statement_type | +-----------------------------------+
  • 25. Copyright © 2014, Oracle and/or its affiliates. All rights reserved. |2 5 IO Summary Views IO breakdown by thread Global summaries by file and wait class, by both bytes and latency Stream of last raw file IO stats mysql> show tables like 'io_%'; +------------------------------+ | Tables_in_sys (io_%) | +------------------------------+ | io_by_thread_by_latency | | io_global_by_file_by_bytes | | io_global_by_file_by_latency | | io_global_by_wait_by_bytes | | io_global_by_wait_by_latency | | latest_file_io | +------------------------------+
  • 26. Copyright © 2014, Oracle and/or its affiliates. All rights reserved. |2 6 Schema Analysis Views Object overview Table usage stats Index usage stats mysql> show tables like 'schema%'; +-------------------------------------+ | Tables_in_sys (schema%) | +-------------------------------------+ | schema_index_statistics | | schema_object_overview | | schema_table_statistics | | schema_table_statistics_with_buffer | | schema_tables_with_full_table_scans | | schema_unused_indexes | +-------------------------------------+
  • 27. Copyright © 2014, Oracle and/or its affiliates. All rights reserved. |2 7 InnoDB Buffer Usage Views Buffer usage by schema Buffer usage by table mysql> show tables like 'innodb%'; +-------------------------------+ | Tables_in_sys (innodb%) | +-------------------------------+ | innodb_buffer_stats_by_schema | | innodb_buffer_stats_by_table | +-------------------------------+
  • 28. Copyright © 2014, Oracle and/or its affiliates. All rights reserved. |2 8 Statement Analysis Views Statement overview Find statements by errors, full scans, sorting, temporary tables Find the statements with the longest runtimes mysql> show tables like 'statement%'; +---------------------------------------------+ | Tables_in_sys (statement%) | +---------------------------------------------+ | statement_analysis | | statements_with_errors_or_warnings | | statements_with_full_table_scans | | statements_with_runtimes_in_95th_percentile | | statements_with_sorting | | statements_with_temp_tables | +---------------------------------------------+
  • 29. Copyright © 2014, Oracle and/or its affiliates. All rights reserved. |2 9 Wait summaries by class and per instrument globally Wait details per user mysql> show tables like 'wait%'; +------------------------------------+ | Tables_in_sys (wait%) | +------------------------------------+ | wait_classes_global_by_avg_latency | | wait_classes_global_by_latency | | waits_by_user_by_latency | | waits_global_by_latency | +------------------------------------+ Wait Analysis Views
  • 30. Copyright © 2014, Oracle and/or its affiliates. All rights reserved. |3 0 Easy to use with MySQL Workbench
  • 31. Copyright © 2014, Oracle and/or its affiliates. All rights reserved. | MySQL Workbench Overview Design, Develop, Administer, Migrate And now adding – Performance • MySQL Database IDE • Millions of Users • Millions of Downloads • Windows, OS X, Linux
  • 32. Copyright © 2014, Oracle and/or its affiliates. All rights reserved. | Performance Schema Reports • Connect • (DB Click or Open and Connect) • Go to Management Tab • If needed (Bottom Left) • Go to Performance Reports • New Performance Section
  • 33. Copyright © 2014, Oracle and/or its affiliates. All rights reserved. | New Screen – Performance Schema Setup YES – its on NO – its off Advanced – for power users
  • 34. Copyright © 2014, Oracle and/or its affiliates. All rights reserved. | Open Settings Before Running Performance Reports
  • 35. Copyright © 2014, Oracle and/or its affiliates. All rights reserved. | First Run – Install SYS Schema
  • 36. Copyright © 2014, Oracle and/or its affiliates. All rights reserved. | SYS now Added • No Tables • Only • Views • SPs • Functions • Operates on • Performance Schema • Information Schema
  • 37. Copyright © 2014, Oracle and/or its affiliates. All rights reserved. | sys.<table> versus sys.x$<table> • Providing 2 options • One is easy • To read in a query • Other (x$) is easier • To compare • To Export to spreadsheet • To Graph • To consume in code
  • 38. Copyright © 2014, Oracle and/or its affiliates. All rights reserved. | SYS - SPs and Functions SPs Used to simplify management FUNCTIONS Used for Formatting and Simple Checks
  • 39. Copyright © 2014, Oracle and/or its affiliates. All rights reserved. | Many WB Performance Reports • WB wrappers many SYS views • If we’ve missed a needed report or view • Let us know • Happy to add more • Even if not performance related • Could go in an Inspector
  • 40. Copyright © 2014, Oracle and/or its affiliates. All rights reserved. | General Lay Out - Header Title and Brief Description Sortable Columns Column Labels indicate Units
  • 41. Copyright © 2014, Oracle and/or its affiliates. All rights reserved. | General Lay Out – Footer
  • 42. Copyright © 2014, Oracle and/or its affiliates. All rights reserved. | Reports #1: IO Reports • For – Files, Event Categories, User/Thread • Quickly – View, Sort – By #, Time, Reads, Writes, Percentages • Look for Hot Spots – Use to determine system requirements, tuning, etc.
  • 43. Copyright © 2014, Oracle and/or its affiliates. All rights reserved. | Reports #2: High Cost SQL Statements • Look at query statements and statistics • Look for Full Table Scans • Frequency of execution • Errors, Warnings • Long Runtimes – Total, Max, Ave • Large numbers of Rows – Total, Max, Ave • Usage of Temp Tables
  • 44. Copyright © 2014, Oracle and/or its affiliates. All rights reserved. | Reports #3: Database Schema Statistics • Quickly Review Various Stats – Counts – Rows – Timing – Paging – Buffering – IOs • Easily find Full Scans • Spot Unused Indexes • Also See Schema/Table Inspectors – Table, Column, Index,… Statis
  • 45. Copyright © 2014, Oracle and/or its affiliates. All rights reserved. | Reports #5: Wait Event Times (For Experts) • Wait Event Analysis is Complex • However for power expert users – These reports show collected data – Show the queries used to collect – Provides Statistics – Breaks out events by Users and Classes
  • 46. Copyright © 2014, Oracle and/or its affiliates. All rights reserved. | Reports #6: InnoDB Statistics • Quick views – Aggregated • By Schema • By Table – Easy to sort by • Allocation, Data, • Pages, Pages hashed, Old Pages • Rows cached
  • 47. Copyright © 2014, Oracle and/or its affiliates. All rights reserved. | Quick Links • Download: –http://dev.mysql.com/downloads/tools/workbench/ • Bugs: –http://bugs.mysql.com • Forums: –http://forums.mysql.com/index.php?151
  • 48. Copyright © 2014, Oracle and/or its affiliates. All rights reserved. | Supporting Resources • Oracle and MySQL • MySQL • MySQL Workbench • Team Blog –https://blogs.oracle.com/mysqlworkbench/ • MySQL Community Edition • MySQL Enterprise Edition • MySQL Blog, Twitter, Facebook • Optimizer Blog –http://oysteing.blogspot.co.uk/