SlideShare a Scribd company logo
.NET Debugging Workshop 
#devconnections
SESSION TITLE 
#devconnections 
Sasha Goldshtein 
CTO, Sela Group 
Microsoft C# MVP, Azure MRS 
@goldshtn blog.sashag.net 
#devconnections
.NET DEBUGGING WORKSHOP 
In This Workshop… 
• Debugging issues in production 
environments 
• Automating triage and analysis 
processes 
• Analyzing system and application 
performance 
#devconnections
.NET DEBUGGING WORKSHOP 
Production Debugging 
• Requirements 
– Obtain actionable 
information about 
crashes and errors 
– Obtain accurate 
performance 
information 
• Limitations 
– Can’t install Visual 
Studio 
– Can’t suspend 
production servers 
– Can’t run intrusive 
tools 
#devconnections
.NET DEBUGGING WORKSHOP 
In the DevOps Process… 
• Automatic build (CI) 
• Automatic deployment (CD) 
• Automatic monitoring 
• Automatic error triage and analysis 
• Automatic remediation 
#devconnections
.NET DEBUGGING WORKSHOP 
The Tools 
• Sysinternals Procdump 
• DebugDiag 
• Windows SDK 
– Debugging Tools for Windows 
– Windows Performance Toolkit 
• PerfView 
#devconnections
Dump Files 
#devconnections
.NET DEBUGGING WORKSHOP 
Dump Files 
• A user dump is a snapshot of a running 
process 
• A kernel dump is a snapshot of the entire 
system 
• Dump files are useful for post-mortem 
diagnostics and for production debugging 
– Anytime you can’t attach and start live 
debugging, a dump might help 
#devconnections
.NET DEBUGGING WORKSHOP 
Limitations of Dump Files 
• A dump file is a static snapshot 
– You can’t debug a dump, just analyze it 
– Sometimes a repro is required (or more 
than one repro) 
• Sometimes several dumps must be 
compared 
#devconnections
.NET DEBUGGING WORKSHOP 
Taxonomy of Dumps 
• Crash dumps are dumps generated 
when an application crashes 
• Hang dumps are dumps generated 
on-demand at a specific moment 
• These are just names; the contents of 
the dump files are the same! 
#devconnections
.NET DEBUGGING WORKSHOP 
Generating a Hang Dump 
• Task Manager, right-click 
and choose 
“Create Dump File” 
– Creates a dump in 
%LOCALAPPDATA 
%Temp 
#devconnections
.NET DEBUGGING WORKSHOP 
Procdump 
• Sysinternals utility for creating dumps 
• Examples: 
Procdump -ma app.exe app.dmp 
Procdump -ma -h app.exe hang.dmp 
Procdump -ma -e app.exe crash.dmp 
Procdump -ma -c 90 app.exe cpu.dmp 
Procdump -m 1000 -n 5 -s 600 -ma app.exe 
#devconnections
.NET DEBUGGING WORKSHOP 
Windows Error Reporting 
• WER can create dumps automatically 
– HKLMSoftwareMicrosoftWindows 
Windows Error ReportingLocalDumps 
– http://tinyurl.com/localdumps 
• Can be application-specific, not 
system-wide 
#devconnections
.NET DEBUGGING WORKSHOP 
DebugDiag 
• Microsoft tool for 
monitoring and 
dump generation 
– Very suitable for 
ASP.NET 
– Dump analysis 
component 
included 
#devconnections
.NET DEBUGGING WORKSHOP 
Debugging Symbols 
• Debugging symbols link runtime 
memory addresses to function names, 
source file names and line numbers 
– PDB files 
– Required for proper debugging and 
dump analysis 
#devconnections
.NET DEBUGGING WORKSHOP 
Symbols for Microsoft Binaries 
• Microsoft has a public symbol server 
with PDB files for Microsoft binaries 
• Configure _NT_SYMBOL_PATH 
environment variable 
setx _NT_SYMBOL_PATH 
srv*C:symbols*http://msdl.microsoft.com/download/symbols 
#devconnections
.NET DEBUGGING WORKSHOP 
Opening Dump Files 
• Visual Studio can 
open dump files 
– For .NET, CLR 4.0+ 
and VS2010+ 
required 
– VS2013 
recommended 
#devconnections
.NET DEBUGGING WORKSHOP 
Opening Dump Files 
• WinDbg is a free 
lightweight 
debugger 
• No intrinsic .NET 
support, but has 
SOS debugging 
extension 
!analyze -v (CLR 4.0+) 
.loadby sos clr 
!printexception 
!clrstack 
#devconnections
.NET DEBUGGING WORKSHOP 
Configuring LocalDumps 
Obtaining and opening a dump file 
TRY IT OUT 
#devconnections
Automatic Dump Analysis 
#devconnections
.NET DEBUGGING WORKSHOP 
Basic Automation 
• Run WinDbg automatically on a bunch 
of files and log its output: 
@echo off 
for %%f in (.*.dmp) do ( 
echo Launching analysis of file %%f... 
start "Analyzing %%f" "C:Program Files (x86)Windows 
Kits8.1Debuggersx86cdb.exe" -z %%f -c ".logopen %%f.log; 
!analyze -v; .logclose; qd" 
) 
#devconnections
.NET DEBUGGING WORKSHOP 
Basic Automation 
• Parse the results for interesting tokens: 
for %%f in (.*.dmp.log) do ( 
echo In file %%f: 
findstr "EXCEPTION_MESSAGE MANAGED_OBJECT_NAME" %%f 
) 
#devconnections
.NET DEBUGGING WORKSHOP 
ClrMD 
• Text-based analysis of debugger 
command output is very fragile and 
limited 
• ClrMD is a .NET library for analyzing dump 
files (and running processes) 
– A managed API for interacting with the .NET 
debugging runtime (“SOS API”) 
– Distributed through NuGet (search “ClrMD”) 
#devconnections
.NET DEBUGGING WORKSHOP 
ClrMD Basic Classes 
#devconnections 
DDaattaaTTaarrggeett 
CCllrrRRuunnttiimmee CCllrrRRuunnttiimmee 
CCllrrHHeeaapp CCllrrTThhrreeaadd 
CCllrrTTyyppee CCllrrTTyyppee CCllrrTThhrreeaadd
.NET DEBUGGING WORKSHOP 
mscordacwks.dll 
• Managed dump analysis requires 
mscordacwks.dll matching the CLR 
version 
• It can be automatically downloaded 
from the Microsoft symbol server in 
most cases 
#devconnections
.NET DEBUGGING WORKSHOP 
Connecting to a Target 
#devconnections
.NET DEBUGGING WORKSHOP 
Basic Exception Triage 
#devconnections
.NET DEBUGGING WORKSHOP 
Getting stacks from a live process 
TRY IT OUT 
#devconnections
.NET DEBUGGING WORKSHOP 
Inspecting the Heap 
• Enumerate all heap 
objects and statistics 
• Find specific objects 
• Inspect GC 
information (roots, 
finalization queues, 
etc.) 
#devconnections 
ClrHeap 
EnumerateObjects 
GetObjectType 
EnumerateRoots 
ClrType 
GetSize 
EnumerateRefsOfObject 
GetFieldValue
.NET DEBUGGING WORKSHOP 
Wait Information 
• Threads have a list 
of blocking objects, 
which have owner 
threads 
• Wait analysis and 
deadlock detection 
is made possible 
ClrThread 
BlockingObjects 
BlockingObject 
Reason 
Object 
HasSingleOwner 
Owner/Owners 
Waiters 
#devconnections
ETW and PerfView 
#devconnections
.NET DEBUGGING WORKSHOP 
Event Tracing for Windows 
• High-performance facility for emitting 
100K+ log events per second with rich 
payloads and stack trace support 
• Used widely across Windows, .NET, 
drivers, services, third party 
components 
#devconnections
.NET DEBUGGING WORKSHOP 
ETW Participants 
• A provider generates ETW events 
• A controller starts and stops ETW 
collection 
• A consumer logs, analyzes, or 
processes ETW events 
#devconnections
.NET DEBUGGING WORKSHOP 
ETW Scenarios 
• Profile an app in sampling mode 
• Perform wait-time analysis 
• Log disk accesses including stacks 
• Log GC and JIT events 
• Log memory allocation statistics (C++) 
• Custom application event log 
#devconnections
.NET DEBUGGING WORKSHOP 
Custom ETW Events 
#devconnections
.NET DEBUGGING WORKSHOP 
ETW Tools 
• xperf.exe: Command-line tool for ETW 
capturing and processing 
• wpr.exe: Command-line and GUI for end 
users 
• wpa.exe: Visual trace analysis tool 
• PerfView.exe: Visual tool for capturing 
and recording ETW events from 
managed providers and the CLR 
#devconnections
.NET DEBUGGING WORKSHOP 
Capturing a Trace 
• Xperf 
xperf -on DiagEasy 
... 
xperf -d diag.etl 
• WPR 
#devconnections
.NET DEBUGGING WORKSHOP 
What’s In A Trace? 
• A trace is a huge list 
of events 
• Events have multiple 
columns (payload) 
• Useless without 
additional processing 
#devconnections
.NET DEBUGGING WORKSHOP 
Trace Processing with Xperf 
• I/O summary report 
per file 
xperf -i fileio.etl 
-o fileio.csv -a diskio 
-summary 
• Interactive profiling 
report (for a specific 
process) 
xperf -i cpu.etl 
-o cpu.html -symbols 
-a stacks -process 
app.exe -butterfly 
#devconnections
.NET DEBUGGING WORKSHOP 
Managed Stacks 
• To display managed stack traces 
correctly, additional CLR data is required 
• WPR & PerfView take care of this 
automatically 
• If using Xperf, see: 
http:// 
msdn.microsoft.com/en-us/library/windows/desktop/#devconnections
.NET DEBUGGING WORKSHOP 
Collecting file I/O information 
TRY IT OUT 
#devconnections
.NET DEBUGGING WORKSHOP 
Trace Analysis with WPA 
List of 
graphs 
List of 
graphs 
#devconnections 
Graph 
display 
Graph 
display 
Ungrouped 
Ungrouped 
columns 
Grouped columns 
columns 
Grouped 
columns Grouping 
Grouping 
bar 
bar
.NET DEBUGGING WORKSHOP 
Stack Summaries 
• Learn how to read 
stack summaries 
– Group by Stack 
column 
– Expand “hot path”, 
like in profiler 
• Stack resolution 
requires symbols 
(slow) 
#devconnections
.NET DEBUGGING WORKSHOP 
PerfView 
• ETW collection and analysis tool tailored 
for .NET applications (but not only) 
• Can be used as a sampling profiler 
• Can be used as an allocation profiler 
• Can be used for heap snapshot analysis 
#devconnections
.NET DEBUGGING WORKSHOP 
Collecting Data w/ PerfView 
• CLI 
PerfView run app.exe 
• GUI 
#devconnections
.NET DEBUGGING WORKSHOP 
PerfView Collection Options 
Profiling wall-clock 
time 
time 
CPU sampling 
profiling 
#devconnections 
File/registry 
accesses 
File/registry 
accesses 
Allocation 
profiling 
Allocation 
profiling 
CPU sampling 
profiling
.NET DEBUGGING WORKSHOP 
PerfView Tables 
Grouping 
options Filtering 
Grouping 
options 
#devconnections 
Filtering 
options 
options 
CCaalll ls tsatacckk t rtereee 
In-trace activity 
highlighter 
In-trace activity 
highlighter
.NET DEBUGGING WORKSHOP 
Memory Leak Analysis 
• PerfView can 
generate heap 
snapshots (smaller 
than a dump), 
analyze, and 
compare them 
• Can also import 
dumps directly 
#devconnections
.NET DEBUGGING WORKSHOP 
Leak analysis with PerfView 
TRY IT OUT 
#devconnections
.NET DEBUGGING WORKSHOP 
Automatic ETW Analysis 
• The TraceEvent 
library provides an 
API for ETW analysis 
– Understands kernel 
and CLR events 
– Supports call stacks 
(incl. managed) 
#devconnections
.NET DEBUGGING WORKSHOP 
Example Analysis Scenarios 
• Monitor the system 
for CLR exceptions 
w/ stacks 
ExceptionTraceData 
• Get a profiling trace 
and look for 
regressions 
TraceLog 
SampledProfileTraceData 
TraceCallStack 
#devconnections
.NET DEBUGGING WORKSHOP 
Summary 
• Production debugging and 
performance investigation is here, and 
entirely possible thanks to dumps and 
ETW traces 
• Integrate automatic error analysis and 
triage into your devops process 
#devconnections
SESSION TITLE 
Rate This Session Now! 
#devconnections 
Rate with Mobile App: 
1. Select the session from the 
Agenda or Speakers menus 
2. Select the Actions tab 
3. Click Rate Session 
Rate Using Our Website: 
1. Register at www.devconnections.com/logintoratesession 
2. Go to www.devconnections.com/ratesession 
3. Select this session from the list and rate it 
Tell Us 
What 
You 
Thought 
of This 
Session 
Be Entered to WIN Prizes!

More Related Content

What's hot (20)

PPTX
Who’s afraid of WinDbg
Dror Helper
 
PDF
Devel::NYTProf v3 - 200908 (OUTDATED, see 201008)
Tim Bunce
 
PPTX
You didnt see it’s coming? "Dawn of hardened Windows Kernel"
Peter Hlavaty
 
PPTX
Racing with Droids
Peter Hlavaty
 
PDF
When is something overflowing
Peter Hlavaty
 
PDF
USENIX ATC 2017: Visualizing Performance with Flame Graphs
Brendan Gregg
 
PPTX
Guardians of your CODE
Peter Hlavaty
 
PPTX
Vulnerability desing patterns
Peter Hlavaty
 
PPTX
Back to the CORE
Peter Hlavaty
 
PDF
Building Observable Applications w/ Node.js -- BayNode Meetup, March 2014
Yunong Xiao
 
PPTX
Windows Kernel Exploitation : This Time Font hunt you down in 4 bytes
Peter Hlavaty
 
PPTX
Security research over Windows #defcon china
Peter Hlavaty
 
PDF
Rainbow Over the Windows: More Colors Than You Could Expect
Peter Hlavaty
 
PDF
Modern Evasion Techniques
Jason Lang
 
PPTX
Hacking - high school intro
Peter Hlavaty
 
PDF
Process injection - Malware style
Sander Demeester
 
PPTX
How Safe is your Link ?
Peter Hlavaty
 
PPTX
Mesa and Its Debugging
GlobalLogic Ukraine
 
PDF
CNIT 126 2: Malware Analysis in Virtual Machines & 3: Basic Dynamic Analysis
Sam Bowne
 
PPTX
How We Test Linux
GlobalLogic Ukraine
 
Who’s afraid of WinDbg
Dror Helper
 
Devel::NYTProf v3 - 200908 (OUTDATED, see 201008)
Tim Bunce
 
You didnt see it’s coming? "Dawn of hardened Windows Kernel"
Peter Hlavaty
 
Racing with Droids
Peter Hlavaty
 
When is something overflowing
Peter Hlavaty
 
USENIX ATC 2017: Visualizing Performance with Flame Graphs
Brendan Gregg
 
Guardians of your CODE
Peter Hlavaty
 
Vulnerability desing patterns
Peter Hlavaty
 
Back to the CORE
Peter Hlavaty
 
Building Observable Applications w/ Node.js -- BayNode Meetup, March 2014
Yunong Xiao
 
Windows Kernel Exploitation : This Time Font hunt you down in 4 bytes
Peter Hlavaty
 
Security research over Windows #defcon china
Peter Hlavaty
 
Rainbow Over the Windows: More Colors Than You Could Expect
Peter Hlavaty
 
Modern Evasion Techniques
Jason Lang
 
Hacking - high school intro
Peter Hlavaty
 
Process injection - Malware style
Sander Demeester
 
How Safe is your Link ?
Peter Hlavaty
 
Mesa and Its Debugging
GlobalLogic Ukraine
 
CNIT 126 2: Malware Analysis in Virtual Machines & 3: Basic Dynamic Analysis
Sam Bowne
 
How We Test Linux
GlobalLogic Ukraine
 

Similar to .NET Debugging Workshop (20)

PPT
.NET Debugging Tips and Techniques
Bala Subra
 
PPT
.Net Debugging Techniques
Bala Subra
 
PPTX
Production Debugging at Code Camp Philly
Brian Lyttle
 
PPTX
Campus days 2013 - Instrumentation
Anders Lybecker
 
PPTX
Debugging NET Applications With WinDBG
Cory Foy
 
PPTX
.Net debugging 2017
Tess Ferrandez
 
PDF
Debugging a .NET program after crash (Post-mortem debugging)
Mirco Vanini
 
PPTX
Diagnosing issues in your ASP.NET applications in production with Visual Stud...
Microsoft Developer Network (MSDN) - Belgium and Luxembourg
 
PPTX
C++ Production Debugging
Sasha Goldshtein
 
PDF
Accelerated .NET Memory Dump Analysis training public slides
Dmitry Vostokov
 
PPTX
Production Debugging War Stories
Ido Flatow
 
PPTX
Introductiontoasp netwindbgdebugging-100506045407-phpapp01
Camilo Alvarez Rivera
 
PPTX
Production debugging web applications
Ido Flatow
 
PPTX
Windows Debugging with WinDbg
Arno Huetter
 
PPTX
Spug pt session2 - debuggingl
Comunidade Portuguesa de SharePoiint
 
PPTX
Sql Bits Sql Server Crash Dump Analysis
Pablo Alvarez Doval
 
PPTX
C# Production Debugging Made Easy
Alon Fliess
 
PPTX
Csi dot net (Hardcore .NET production debugging)
Jonne Kats
 
PDF
.NET for hackers
Antonio Parata
 
PDF
Spaghetti gate
Jon Bachelor
 
.NET Debugging Tips and Techniques
Bala Subra
 
.Net Debugging Techniques
Bala Subra
 
Production Debugging at Code Camp Philly
Brian Lyttle
 
Campus days 2013 - Instrumentation
Anders Lybecker
 
Debugging NET Applications With WinDBG
Cory Foy
 
.Net debugging 2017
Tess Ferrandez
 
Debugging a .NET program after crash (Post-mortem debugging)
Mirco Vanini
 
Diagnosing issues in your ASP.NET applications in production with Visual Stud...
Microsoft Developer Network (MSDN) - Belgium and Luxembourg
 
C++ Production Debugging
Sasha Goldshtein
 
Accelerated .NET Memory Dump Analysis training public slides
Dmitry Vostokov
 
Production Debugging War Stories
Ido Flatow
 
Introductiontoasp netwindbgdebugging-100506045407-phpapp01
Camilo Alvarez Rivera
 
Production debugging web applications
Ido Flatow
 
Windows Debugging with WinDbg
Arno Huetter
 
Spug pt session2 - debuggingl
Comunidade Portuguesa de SharePoiint
 
Sql Bits Sql Server Crash Dump Analysis
Pablo Alvarez Doval
 
C# Production Debugging Made Easy
Alon Fliess
 
Csi dot net (Hardcore .NET production debugging)
Jonne Kats
 
.NET for hackers
Antonio Parata
 
Spaghetti gate
Jon Bachelor
 
Ad

More from Sasha Goldshtein (20)

PPTX
Modern Linux Tracing Landscape
Sasha Goldshtein
 
PPTX
The Next Linux Superpower: eBPF Primer
Sasha Goldshtein
 
PPTX
Staring into the eBPF Abyss
Sasha Goldshtein
 
PPTX
Visual Studio 2015 and the Next .NET Framework
Sasha Goldshtein
 
PPT
Swift: Apple's New Programming Language for iOS and OS X
Sasha Goldshtein
 
PPT
C# Everywhere: Cross-Platform Mobile Apps with Xamarin
Sasha Goldshtein
 
PPT
Modern Backends for Mobile Apps
Sasha Goldshtein
 
PPT
Performance and Debugging with the Diagnostics Hub in Visual Studio 2013
Sasha Goldshtein
 
PPTX
Introduction to RavenDB
Sasha Goldshtein
 
PPTX
State of the Platforms
Sasha Goldshtein
 
PPTX
Delivering Millions of Push Notifications in Minutes
Sasha Goldshtein
 
PPTX
Building Mobile Apps with a Mobile Services .NET Backend
Sasha Goldshtein
 
PPTX
Building iOS and Android Apps with Mobile Services
Sasha Goldshtein
 
PPT
Task and Data Parallelism
Sasha Goldshtein
 
PPT
What's New in C++ 11?
Sasha Goldshtein
 
PDF
Attacking Web Applications
Sasha Goldshtein
 
PPTX
Windows Azure Mobile Services
Sasha Goldshtein
 
PPTX
First Steps in Android Development
Sasha Goldshtein
 
PPTX
First Steps in iOS Development
Sasha Goldshtein
 
PPTX
JavaScript, Meet Cloud: Node.js on Windows Azure
Sasha Goldshtein
 
Modern Linux Tracing Landscape
Sasha Goldshtein
 
The Next Linux Superpower: eBPF Primer
Sasha Goldshtein
 
Staring into the eBPF Abyss
Sasha Goldshtein
 
Visual Studio 2015 and the Next .NET Framework
Sasha Goldshtein
 
Swift: Apple's New Programming Language for iOS and OS X
Sasha Goldshtein
 
C# Everywhere: Cross-Platform Mobile Apps with Xamarin
Sasha Goldshtein
 
Modern Backends for Mobile Apps
Sasha Goldshtein
 
Performance and Debugging with the Diagnostics Hub in Visual Studio 2013
Sasha Goldshtein
 
Introduction to RavenDB
Sasha Goldshtein
 
State of the Platforms
Sasha Goldshtein
 
Delivering Millions of Push Notifications in Minutes
Sasha Goldshtein
 
Building Mobile Apps with a Mobile Services .NET Backend
Sasha Goldshtein
 
Building iOS and Android Apps with Mobile Services
Sasha Goldshtein
 
Task and Data Parallelism
Sasha Goldshtein
 
What's New in C++ 11?
Sasha Goldshtein
 
Attacking Web Applications
Sasha Goldshtein
 
Windows Azure Mobile Services
Sasha Goldshtein
 
First Steps in Android Development
Sasha Goldshtein
 
First Steps in iOS Development
Sasha Goldshtein
 
JavaScript, Meet Cloud: Node.js on Windows Azure
Sasha Goldshtein
 
Ad

Recently uploaded (20)

PPTX
Q2 FY26 Tableau User Group Leader Quarterly Call
lward7
 
PDF
Future-Proof or Fall Behind? 10 Tech Trends You Can’t Afford to Ignore in 2025
DIGITALCONFEX
 
PDF
NLJUG Speaker academy 2025 - first session
Bert Jan Schrijver
 
PDF
Staying Human in a Machine- Accelerated World
Catalin Jora
 
PPTX
COMPARISON OF RASTER ANALYSIS TOOLS OF QGIS AND ARCGIS
Sharanya Sarkar
 
PPTX
Agentforce World Tour Toronto '25 - MCP with MuleSoft
Alexandra N. Martinez
 
DOCX
Cryptography Quiz: test your knowledge of this important security concept.
Rajni Bhardwaj Grover
 
PDF
Peak of Data & AI Encore AI-Enhanced Workflows for the Real World
Safe Software
 
PDF
Go Concurrency Real-World Patterns, Pitfalls, and Playground Battles.pdf
Emily Achieng
 
PDF
Agentic AI lifecycle for Enterprise Hyper-Automation
Debmalya Biswas
 
PDF
The 2025 InfraRed Report - Redpoint Ventures
Razin Mustafiz
 
PPTX
The Project Compass - GDG on Campus MSIT
dscmsitkol
 
PPTX
Designing_the_Future_AI_Driven_Product_Experiences_Across_Devices.pptx
presentifyai
 
PDF
Newgen Beyond Frankenstein_Build vs Buy_Digital_version.pdf
darshakparmar
 
PDF
How do you fast track Agentic automation use cases discovery?
DianaGray10
 
PDF
Automating Feature Enrichment and Station Creation in Natural Gas Utility Net...
Safe Software
 
PDF
NASA A Researcher’s Guide to International Space Station : Physical Sciences ...
Dr. PANKAJ DHUSSA
 
PDF
[Newgen] NewgenONE Marvin Brochure 1.pdf
darshakparmar
 
PDF
Kit-Works Team Study_20250627_한달만에만든사내서비스키링(양다윗).pdf
Wonjun Hwang
 
PDF
What’s my job again? Slides from Mark Simos talk at 2025 Tampa BSides
Mark Simos
 
Q2 FY26 Tableau User Group Leader Quarterly Call
lward7
 
Future-Proof or Fall Behind? 10 Tech Trends You Can’t Afford to Ignore in 2025
DIGITALCONFEX
 
NLJUG Speaker academy 2025 - first session
Bert Jan Schrijver
 
Staying Human in a Machine- Accelerated World
Catalin Jora
 
COMPARISON OF RASTER ANALYSIS TOOLS OF QGIS AND ARCGIS
Sharanya Sarkar
 
Agentforce World Tour Toronto '25 - MCP with MuleSoft
Alexandra N. Martinez
 
Cryptography Quiz: test your knowledge of this important security concept.
Rajni Bhardwaj Grover
 
Peak of Data & AI Encore AI-Enhanced Workflows for the Real World
Safe Software
 
Go Concurrency Real-World Patterns, Pitfalls, and Playground Battles.pdf
Emily Achieng
 
Agentic AI lifecycle for Enterprise Hyper-Automation
Debmalya Biswas
 
The 2025 InfraRed Report - Redpoint Ventures
Razin Mustafiz
 
The Project Compass - GDG on Campus MSIT
dscmsitkol
 
Designing_the_Future_AI_Driven_Product_Experiences_Across_Devices.pptx
presentifyai
 
Newgen Beyond Frankenstein_Build vs Buy_Digital_version.pdf
darshakparmar
 
How do you fast track Agentic automation use cases discovery?
DianaGray10
 
Automating Feature Enrichment and Station Creation in Natural Gas Utility Net...
Safe Software
 
NASA A Researcher’s Guide to International Space Station : Physical Sciences ...
Dr. PANKAJ DHUSSA
 
[Newgen] NewgenONE Marvin Brochure 1.pdf
darshakparmar
 
Kit-Works Team Study_20250627_한달만에만든사내서비스키링(양다윗).pdf
Wonjun Hwang
 
What’s my job again? Slides from Mark Simos talk at 2025 Tampa BSides
Mark Simos
 

.NET Debugging Workshop

  • 1. .NET Debugging Workshop #devconnections
  • 2. SESSION TITLE #devconnections Sasha Goldshtein CTO, Sela Group Microsoft C# MVP, Azure MRS @goldshtn blog.sashag.net #devconnections
  • 3. .NET DEBUGGING WORKSHOP In This Workshop… • Debugging issues in production environments • Automating triage and analysis processes • Analyzing system and application performance #devconnections
  • 4. .NET DEBUGGING WORKSHOP Production Debugging • Requirements – Obtain actionable information about crashes and errors – Obtain accurate performance information • Limitations – Can’t install Visual Studio – Can’t suspend production servers – Can’t run intrusive tools #devconnections
  • 5. .NET DEBUGGING WORKSHOP In the DevOps Process… • Automatic build (CI) • Automatic deployment (CD) • Automatic monitoring • Automatic error triage and analysis • Automatic remediation #devconnections
  • 6. .NET DEBUGGING WORKSHOP The Tools • Sysinternals Procdump • DebugDiag • Windows SDK – Debugging Tools for Windows – Windows Performance Toolkit • PerfView #devconnections
  • 8. .NET DEBUGGING WORKSHOP Dump Files • A user dump is a snapshot of a running process • A kernel dump is a snapshot of the entire system • Dump files are useful for post-mortem diagnostics and for production debugging – Anytime you can’t attach and start live debugging, a dump might help #devconnections
  • 9. .NET DEBUGGING WORKSHOP Limitations of Dump Files • A dump file is a static snapshot – You can’t debug a dump, just analyze it – Sometimes a repro is required (or more than one repro) • Sometimes several dumps must be compared #devconnections
  • 10. .NET DEBUGGING WORKSHOP Taxonomy of Dumps • Crash dumps are dumps generated when an application crashes • Hang dumps are dumps generated on-demand at a specific moment • These are just names; the contents of the dump files are the same! #devconnections
  • 11. .NET DEBUGGING WORKSHOP Generating a Hang Dump • Task Manager, right-click and choose “Create Dump File” – Creates a dump in %LOCALAPPDATA %Temp #devconnections
  • 12. .NET DEBUGGING WORKSHOP Procdump • Sysinternals utility for creating dumps • Examples: Procdump -ma app.exe app.dmp Procdump -ma -h app.exe hang.dmp Procdump -ma -e app.exe crash.dmp Procdump -ma -c 90 app.exe cpu.dmp Procdump -m 1000 -n 5 -s 600 -ma app.exe #devconnections
  • 13. .NET DEBUGGING WORKSHOP Windows Error Reporting • WER can create dumps automatically – HKLMSoftwareMicrosoftWindows Windows Error ReportingLocalDumps – http://tinyurl.com/localdumps • Can be application-specific, not system-wide #devconnections
  • 14. .NET DEBUGGING WORKSHOP DebugDiag • Microsoft tool for monitoring and dump generation – Very suitable for ASP.NET – Dump analysis component included #devconnections
  • 15. .NET DEBUGGING WORKSHOP Debugging Symbols • Debugging symbols link runtime memory addresses to function names, source file names and line numbers – PDB files – Required for proper debugging and dump analysis #devconnections
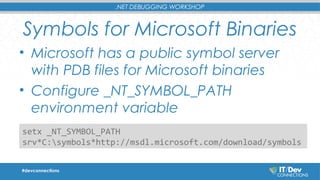
  • 16. .NET DEBUGGING WORKSHOP Symbols for Microsoft Binaries • Microsoft has a public symbol server with PDB files for Microsoft binaries • Configure _NT_SYMBOL_PATH environment variable setx _NT_SYMBOL_PATH srv*C:symbols*http://msdl.microsoft.com/download/symbols #devconnections
  • 17. .NET DEBUGGING WORKSHOP Opening Dump Files • Visual Studio can open dump files – For .NET, CLR 4.0+ and VS2010+ required – VS2013 recommended #devconnections
  • 18. .NET DEBUGGING WORKSHOP Opening Dump Files • WinDbg is a free lightweight debugger • No intrinsic .NET support, but has SOS debugging extension !analyze -v (CLR 4.0+) .loadby sos clr !printexception !clrstack #devconnections
  • 19. .NET DEBUGGING WORKSHOP Configuring LocalDumps Obtaining and opening a dump file TRY IT OUT #devconnections
  • 20. Automatic Dump Analysis #devconnections
  • 21. .NET DEBUGGING WORKSHOP Basic Automation • Run WinDbg automatically on a bunch of files and log its output: @echo off for %%f in (.*.dmp) do ( echo Launching analysis of file %%f... start "Analyzing %%f" "C:Program Files (x86)Windows Kits8.1Debuggersx86cdb.exe" -z %%f -c ".logopen %%f.log; !analyze -v; .logclose; qd" ) #devconnections
  • 22. .NET DEBUGGING WORKSHOP Basic Automation • Parse the results for interesting tokens: for %%f in (.*.dmp.log) do ( echo In file %%f: findstr "EXCEPTION_MESSAGE MANAGED_OBJECT_NAME" %%f ) #devconnections
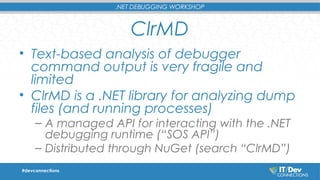
  • 23. .NET DEBUGGING WORKSHOP ClrMD • Text-based analysis of debugger command output is very fragile and limited • ClrMD is a .NET library for analyzing dump files (and running processes) – A managed API for interacting with the .NET debugging runtime (“SOS API”) – Distributed through NuGet (search “ClrMD”) #devconnections
  • 24. .NET DEBUGGING WORKSHOP ClrMD Basic Classes #devconnections DDaattaaTTaarrggeett CCllrrRRuunnttiimmee CCllrrRRuunnttiimmee CCllrrHHeeaapp CCllrrTThhrreeaadd CCllrrTTyyppee CCllrrTTyyppee CCllrrTThhrreeaadd
  • 25. .NET DEBUGGING WORKSHOP mscordacwks.dll • Managed dump analysis requires mscordacwks.dll matching the CLR version • It can be automatically downloaded from the Microsoft symbol server in most cases #devconnections
  • 26. .NET DEBUGGING WORKSHOP Connecting to a Target #devconnections
  • 27. .NET DEBUGGING WORKSHOP Basic Exception Triage #devconnections
  • 28. .NET DEBUGGING WORKSHOP Getting stacks from a live process TRY IT OUT #devconnections
  • 29. .NET DEBUGGING WORKSHOP Inspecting the Heap • Enumerate all heap objects and statistics • Find specific objects • Inspect GC information (roots, finalization queues, etc.) #devconnections ClrHeap EnumerateObjects GetObjectType EnumerateRoots ClrType GetSize EnumerateRefsOfObject GetFieldValue
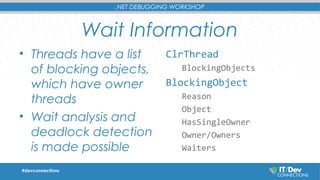
  • 30. .NET DEBUGGING WORKSHOP Wait Information • Threads have a list of blocking objects, which have owner threads • Wait analysis and deadlock detection is made possible ClrThread BlockingObjects BlockingObject Reason Object HasSingleOwner Owner/Owners Waiters #devconnections
  • 31. ETW and PerfView #devconnections
  • 32. .NET DEBUGGING WORKSHOP Event Tracing for Windows • High-performance facility for emitting 100K+ log events per second with rich payloads and stack trace support • Used widely across Windows, .NET, drivers, services, third party components #devconnections
  • 33. .NET DEBUGGING WORKSHOP ETW Participants • A provider generates ETW events • A controller starts and stops ETW collection • A consumer logs, analyzes, or processes ETW events #devconnections
  • 34. .NET DEBUGGING WORKSHOP ETW Scenarios • Profile an app in sampling mode • Perform wait-time analysis • Log disk accesses including stacks • Log GC and JIT events • Log memory allocation statistics (C++) • Custom application event log #devconnections
  • 35. .NET DEBUGGING WORKSHOP Custom ETW Events #devconnections
  • 36. .NET DEBUGGING WORKSHOP ETW Tools • xperf.exe: Command-line tool for ETW capturing and processing • wpr.exe: Command-line and GUI for end users • wpa.exe: Visual trace analysis tool • PerfView.exe: Visual tool for capturing and recording ETW events from managed providers and the CLR #devconnections
  • 37. .NET DEBUGGING WORKSHOP Capturing a Trace • Xperf xperf -on DiagEasy ... xperf -d diag.etl • WPR #devconnections
  • 38. .NET DEBUGGING WORKSHOP What’s In A Trace? • A trace is a huge list of events • Events have multiple columns (payload) • Useless without additional processing #devconnections
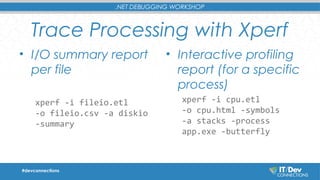
  • 39. .NET DEBUGGING WORKSHOP Trace Processing with Xperf • I/O summary report per file xperf -i fileio.etl -o fileio.csv -a diskio -summary • Interactive profiling report (for a specific process) xperf -i cpu.etl -o cpu.html -symbols -a stacks -process app.exe -butterfly #devconnections
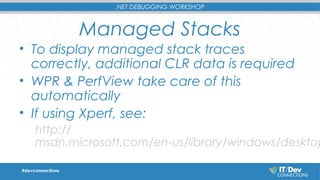
  • 40. .NET DEBUGGING WORKSHOP Managed Stacks • To display managed stack traces correctly, additional CLR data is required • WPR & PerfView take care of this automatically • If using Xperf, see: http:// msdn.microsoft.com/en-us/library/windows/desktop/#devconnections
  • 41. .NET DEBUGGING WORKSHOP Collecting file I/O information TRY IT OUT #devconnections
  • 42. .NET DEBUGGING WORKSHOP Trace Analysis with WPA List of graphs List of graphs #devconnections Graph display Graph display Ungrouped Ungrouped columns Grouped columns columns Grouped columns Grouping Grouping bar bar
  • 43. .NET DEBUGGING WORKSHOP Stack Summaries • Learn how to read stack summaries – Group by Stack column – Expand “hot path”, like in profiler • Stack resolution requires symbols (slow) #devconnections
  • 44. .NET DEBUGGING WORKSHOP PerfView • ETW collection and analysis tool tailored for .NET applications (but not only) • Can be used as a sampling profiler • Can be used as an allocation profiler • Can be used for heap snapshot analysis #devconnections
  • 45. .NET DEBUGGING WORKSHOP Collecting Data w/ PerfView • CLI PerfView run app.exe • GUI #devconnections
  • 46. .NET DEBUGGING WORKSHOP PerfView Collection Options Profiling wall-clock Profiling wall-clock time time CPU sampling profiling #devconnections File/registry accesses File/registry accesses Allocation profiling Allocation profiling CPU sampling profiling
  • 47. .NET DEBUGGING WORKSHOP PerfView Tables Grouping options Filtering Grouping options #devconnections Filtering options options CCaalll ls tsatacckk t rtereee In-trace activity highlighter In-trace activity highlighter
  • 48. .NET DEBUGGING WORKSHOP Memory Leak Analysis • PerfView can generate heap snapshots (smaller than a dump), analyze, and compare them • Can also import dumps directly #devconnections
  • 49. .NET DEBUGGING WORKSHOP Leak analysis with PerfView TRY IT OUT #devconnections
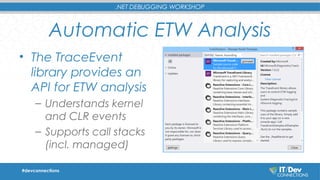
  • 50. .NET DEBUGGING WORKSHOP Automatic ETW Analysis • The TraceEvent library provides an API for ETW analysis – Understands kernel and CLR events – Supports call stacks (incl. managed) #devconnections
  • 51. .NET DEBUGGING WORKSHOP Example Analysis Scenarios • Monitor the system for CLR exceptions w/ stacks ExceptionTraceData • Get a profiling trace and look for regressions TraceLog SampledProfileTraceData TraceCallStack #devconnections
  • 52. .NET DEBUGGING WORKSHOP Summary • Production debugging and performance investigation is here, and entirely possible thanks to dumps and ETW traces • Integrate automatic error analysis and triage into your devops process #devconnections
  • 53. SESSION TITLE Rate This Session Now! #devconnections Rate with Mobile App: 1. Select the session from the Agenda or Speakers menus 2. Select the Actions tab 3. Click Rate Session Rate Using Our Website: 1. Register at www.devconnections.com/logintoratesession 2. Go to www.devconnections.com/ratesession 3. Select this session from the list and rate it Tell Us What You Thought of This Session Be Entered to WIN Prizes!