Open Source Logging and Monitoring Tools
46 likes12,452 views

The document discusses open-source logging and monitoring tools, focusing on customizing logs from various daemons and log aggregation, parsing, and searching. It includes a demo setup of Drupal and monitoring tools on Google Cloud, along with practical examples of log formats and configurations for Apache, Nginx, and Varnish. Additionally, it covers challenges in log management, shipping logs with rsyslogd, and the use of tools like Logstash, Elasticsearch, and Kibana for log analysis.


![SYSLOG
Apr 11 18:35:53 shiftiest dnsmasq-dhcp[23185]: DHCPACK(br100) 192.168.32.4
fa:16:3e:c4:2f:fd varnish4
!
Mar 11 15:38:14 drupal drupal: http://192.168.32.3|1394566694|system|
192.168.32.1|http://192.168.32.3/admin/modules/list/confirm|http://
192.168.32.3/admin/modules|1||php module installed.](https://image.slidesharecdn.com/opensourceloggingandmonitoringtools-141001085634-phpapp01/85/Open-Source-Logging-and-Monitoring-Tools-18-320.jpg)
![APACHE
127.0.0.1 - - [08/Mar/2014:00:36:44 -0500] "GET /dashboard HTTP/1.0" 302 20
"https://68.232.187.42/dashboard/" "Mozilla/5.0 (Macintosh; Intel Mac OS X
10_9_2) AppleWebKit/537.36 (KHTML, like Gecko) Chrome/33.0.1750.146 Safari/
537.36"](https://image.slidesharecdn.com/opensourceloggingandmonitoringtools-141001085634-phpapp01/85/Open-Source-Logging-and-Monitoring-Tools-19-320.jpg)
![NGINX
192.168.32.1 - - [11/Apr/2014:10:44:36 -0400] "GET /kibana/font/fontawesome-webfont.
woff?v=3.2.1 HTTP/1.1" 200 43572 "http://192.168.32.6/kibana/"
"Mozilla/5.0 (Macintosh; Intel Mac OS X 10_9_2) AppleWebKit/537.36 (KHTML,
like Gecko) Chrome/34.0.1847.116 Safari/537.36"](https://image.slidesharecdn.com/opensourceloggingandmonitoringtools-141001085634-phpapp01/85/Open-Source-Logging-and-Monitoring-Tools-20-320.jpg)
![VARNISH
192.168.32.1 - - [11/Apr/2014:10:47:52 -0400] "GET http://192.168.32.3/
themes/seven/images/list-item.png HTTP/1.1" 200 195 "http://192.168.32.3/
admin/config" "Mozilla/5.0 (Macintosh; Intel Mac OS X 10_9_2) AppleWebKit/
537.36 (KHTML, like Gecko) Chrome/34.0.1847.116 Safari/537.36"](https://image.slidesharecdn.com/opensourceloggingandmonitoringtools-141001085634-phpapp01/85/Open-Source-Logging-and-Monitoring-Tools-21-320.jpg)


![APACHE
127.0.0.1 - - [29/Jul/2014:22:03:07 +0000] "GET /admin/config/development/
performance HTTP/1.0" 200 3500 "-" "Mozilla/5.0 (Macintosh; Intel Mac OS X
10_9_4) AppleWebKit/537.36 (KHTML, like Gecko) Chrome/36.0.1985.125 Safari/
537.36"
!
127.0.0.1 - - [29/Jul/2014:22:03:07 +0000] "GET /admin/config/development/
performance HTTP/1.0" 200 3500 "-" "Mozilla/5.0 (Macintosh; Intel Mac OS X
10_9_4) AppleWebKit/537.36 (KHTML, like Gecko) Chrome/36.0.1985.125 Safari/
537.36" 45304 23.251.149.143 80](https://image.slidesharecdn.com/opensourceloggingandmonitoringtools-141001085634-phpapp01/85/Open-Source-Logging-and-Monitoring-Tools-25-320.jpg)
![NGINX
• Log formats are defined with the log_format directive – http://
nginx.org/en/docs/http/ngx_http_log_module.html#log_format
• You may not override the default NCSA combined format
• log_format combined '$remote_addr - $remote_user [$time_local] '
'"$request" $status $body_bytes_sent '
'"$http_referer" "$http_user_agent"';](https://image.slidesharecdn.com/opensourceloggingandmonitoringtools-141001085634-phpapp01/85/Open-Source-Logging-and-Monitoring-Tools-26-320.jpg)

![NGINX
• New log_format line and example config for a vhost:
• log_format logstash '$remote_addr - $remote_user [$time_local] '
'"$request" $status $body_bytes_sent '
'"$http_referer" "$http_user_agent" '
'$request_time $http_host $server_port';
• access_log /var/log/nginx/access.log logstash;](https://image.slidesharecdn.com/opensourceloggingandmonitoringtools-141001085634-phpapp01/85/Open-Source-Logging-and-Monitoring-Tools-28-320.jpg)
![NGINX
70.42.157.6 - - [22/Jul/2014:22:03:30 +0000] "POST /logstash-2014.07.22/
_search HTTP/1.0" 200 281190 "http://146.148.34.62/kibana/index.html"
"Mozilla/5.0 (Macintosh; Intel Mac OS X 10_9_4) AppleWebKit/537.36 (KHTML,
like Gecko) Chrome/36.0.1985.125 Safari/537.36"
!
70.42.157.6 - - [22/Jul/2014:22:03:30 +0000] "POST /logstash-2014.07.22/
_search HTTP/1.0" 200 281190 "http://146.148.34.62/kibana/index.html"
"Mozilla/5.0 (Macintosh; Intel Mac OS X 10_9_4) AppleWebKit/537.36 (KHTML,
like Gecko) Chrome/36.0.1985.125 Safari/537.36" 0.523 146.148.34.62 80](https://image.slidesharecdn.com/opensourceloggingandmonitoringtools-141001085634-phpapp01/85/Open-Source-Logging-and-Monitoring-Tools-29-320.jpg)


![VARNISH
70.42.157.6 - - [29/Jul/2014:22:03:07 +0000] "GET http://23.251.149.143/
admin/config/development/performance HTTP/1.0" 200 3500 "-" "Mozilla/5.0
(Macintosh; Intel Mac OS X 10_9_4) AppleWebKit/537.36 (KHTML, like Gecko)
Chrome/36.0.1985.125 Safari/537.36"
!
70.42.157.6 - - [29/Jul/2014:22:03:07 +0000] "GET http://23.251.149.143/
admin/config/development/performance HTTP/1.0" 200 3500 "-" "Mozilla/5.0
(Macintosh; Intel Mac OS X 10_9_4) AppleWebKit/537.36 (KHTML, like Gecko)
Chrome/36.0.1985.125 Safari/537.36" 0.045969 miss](https://image.slidesharecdn.com/opensourceloggingandmonitoringtools-141001085634-phpapp01/85/Open-Source-Logging-and-Monitoring-Tools-32-320.jpg)


![SYSLOG-SHIPPED LOG FILES
Mar 11 15:38:14 drupal drupal: http://192.168.32.3|1394566694|system|
192.168.32.1|http://192.168.32.3/admin/modules/list
/confirm|http://192.168.32.3/admin/modules|1||php module installed.
!
Jul 30 15:04:14 drupal varnish_access: 156.40.118.178 - - [30/Jul/
2014:15:04:09 +0000] "GET http://23.251.149.143/misc/tableheader.js?n9j5uu
HTTP/1.1" 200 1848 "http://23.251.149.143/admin/modules" "Mozilla/5.0
(Macintosh; Intel Mac OS X 10_9_4) AppleWebKit/537.36 (KHTML, like Gecko)
Chrome/36.0.1985.125 Safari/537.36" 0.000757 miss](https://image.slidesharecdn.com/opensourceloggingandmonitoringtools-141001085634-phpapp01/85/Open-Source-Logging-and-Monitoring-Tools-41-320.jpg)


![EXAMPLE:
GROKKING NGINX LOGS
192.168.32.1 - - [11/Apr/2014:10:44:36 -0400] "GET /kibana/font/
fontawesome-webfont.woff?v=3.2.1 HTTP/1.1" 200 43572 "http://
192.168.32.6/kibana/" "Mozilla/5.0 (Macintosh; Intel Mac OS X
10_9_2) AppleWebKit/537.36 (KHTML, like Gecko) Chrome/34.0.1847.116
Safari/537.36"](https://image.slidesharecdn.com/opensourceloggingandmonitoringtools-141001085634-phpapp01/85/Open-Source-Logging-and-Monitoring-Tools-48-320.jpg)


![LOGSTASH CONFIG
filter {
if [type] == "syslog" {
mutate {
add_field => [ "syslog_message", "%{message}" ]
remove_field => "message"
}
grok {
match => [ "syslog_message", "%{SYSLOGLINE}" ]
}
date {
match => [ "timestamp", "MMM d HH:mm:ss", "MMM dd HH:mm:ss" ]
}](https://image.slidesharecdn.com/opensourceloggingandmonitoringtools-141001085634-phpapp01/85/Open-Source-Logging-and-Monitoring-Tools-52-320.jpg)
![LOGSTASH CONFIG
# Parse Drupal logs that are logged to syslog.
if [program] == "drupal" {
grok {
match => [ "message", "https?://%{HOSTNAME:vhost}?|%
{NUMBER:d_timestamp}|(?<d_type>[^|]*)|%{IP:d_ip}|(?<d_request_uri>[^
|]*)|(?<d_referer>[^|]*)|(?<d_uid>[^|]*)|(?<d_link>[^|]*)|(?
<d_message>.*)" ]
}
}](https://image.slidesharecdn.com/opensourceloggingandmonitoringtools-141001085634-phpapp01/85/Open-Source-Logging-and-Monitoring-Tools-53-320.jpg)
![LOGSTASH CONFIG
# Parse nginx logs that have been shipped over syslog.
if [program] == "nginx_access" {
mutate {
remove_field => [ "path", "pid", "syslog_message", "timestamp" ]
}
grok {
match => [ "message", "%{COMBINEDAPACHELOG} %{BASE16FLOAT:duration}
%{IPORHOST:hostname} %{POSINT:port}" ]
}
# Put the hostname into the request, a la Varnish.
if [port] == "443" {
mutate {
replace => [ "request", "https://%{hostname}%{request}" ]
}
}](https://image.slidesharecdn.com/opensourceloggingandmonitoringtools-141001085634-phpapp01/85/Open-Source-Logging-and-Monitoring-Tools-54-320.jpg)
![LOGSTASH CONFIG
else {
mutate {
replace => [ "request", "http://%{hostname}%{request}" ]
}
}
ruby {
code => "event['duration'] = event['duration'].to_f * 1000.0"
}
date {
match => [ "timestamp", "dd/MMM/yyyy:HH:mm:ss Z" ]
}
useragent {
source => "agent"
target => "browser"
}
}](https://image.slidesharecdn.com/opensourceloggingandmonitoringtools-141001085634-phpapp01/85/Open-Source-Logging-and-Monitoring-Tools-55-320.jpg)


![LOGSTASH CONFIG
output {
if [program] == "varnish_access" {
statsd {
sender => "%{logsource}"
# Count each event based on the HTTP response code.
increment => "varnish.response.%{response}"
# Also count Varnish hits and misses.
increment => "varnish.cache.%{cache}"
# Use the 'bytes' field from the varnish log as the count value.
count => [ "varnish.bytes", "%{bytes}" ]
}
}
}](https://image.slidesharecdn.com/opensourceloggingandmonitoringtools-141001085634-phpapp01/85/Open-Source-Logging-and-Monitoring-Tools-63-320.jpg)


Open Source Logging and Monitoring Tools
- 1. OPEN-SOURCE LOGGING AND MONITORING TOOLS S T E V E N W . M E R R I L L D E V O P S T R A C K , D R U P A L C O N A M ST E R D AM
- 2. INTRODUCTION
- 3. Steven Merrill Director of Engineering, Phase2 Volunteer, drupal.org infrastructure Twitter: @stevenmerrill
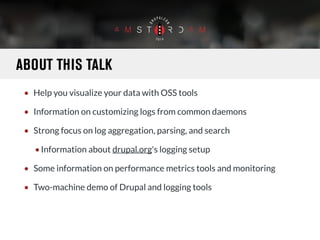
- 4. ABOUT THIS TALK • Help you visualize your data with OSS tools • Information on customizing logs from common daemons • Strong focus on log aggregation, parsing, and search •Information about drupal.org's logging setup • Some information on performance metrics tools and monitoring • Two-machine demo of Drupal and logging tools
- 5. DEMO SETUP • 2 Google Cloud Engine g1.small instances •Both instances run collectd to grab system metrics • 1 'drupal' instance with rsyslog shipping logs, Apache, Varnish, MySQL, PHP • 1 'utility' instance with rsyslog host, Jenkins, Graphite, Grafana, ElasticSearch, Logstash, Kibana, bucky (statsd)
- 6. INITIAL DEMO: ELK STACK IN ACTION
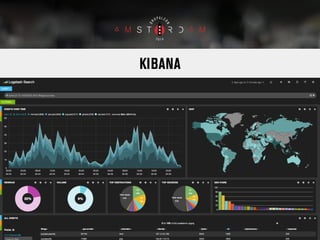
- 7. KIBANA
- 8. KIBANA
- 9. LOGS
- 10. CECI N'EST PAS UNE LOG https://www.flickr.com/photos/data_op/2575797856/
- 11. "LOGS ARE TIME + DATA." - Jordan Sissel, creator of Logstash
- 12. WHAT ARE LOGS • Ultimately, logs are about keeping track of events • Logs are very different; some use custom formats, while some may be in pure XML or JSON • Some are one line, some are many, like Java stacktraces or MySQL slow query logs
- 13. WHO PRODUCES LOGS • Drupal • nginx • Apache • Varnish • Jenkins • ElasticSearch or SOLR • MySQL • cron • sudo • ...
- 14. TYPES OF LOGS • Error Logs • Transaction Logs • Trace and Debug Logs
- 15. ISSUES WITH LOGS • Legal retention requirements • Require shell access to view • Not often human-parseable • Cyborg-friendly tooling
- 16. SOLVING PROBLEMS WITH LOG DATA • Find slow pages or queries • Sort through Drupal logs to trace user action on a site • Get an average idea of traffic to a particular area • Track new PHP error types
- 17. LOG FORMATS ADDING MORE SMARTS TO YOUR LOGS
- 18. SYSLOG Apr 11 18:35:53 shiftiest dnsmasq-dhcp[23185]: DHCPACK(br100) 192.168.32.4 fa:16:3e:c4:2f:fd varnish4 ! Mar 11 15:38:14 drupal drupal: http://192.168.32.3|1394566694|system| 192.168.32.1|http://192.168.32.3/admin/modules/list/confirm|http:// 192.168.32.3/admin/modules|1||php module installed.
- 19. APACHE 127.0.0.1 - - [08/Mar/2014:00:36:44 -0500] "GET /dashboard HTTP/1.0" 302 20 "https://68.232.187.42/dashboard/" "Mozilla/5.0 (Macintosh; Intel Mac OS X 10_9_2) AppleWebKit/537.36 (KHTML, like Gecko) Chrome/33.0.1750.146 Safari/ 537.36"
- 20. NGINX 192.168.32.1 - - [11/Apr/2014:10:44:36 -0400] "GET /kibana/font/fontawesome-webfont. woff?v=3.2.1 HTTP/1.1" 200 43572 "http://192.168.32.6/kibana/" "Mozilla/5.0 (Macintosh; Intel Mac OS X 10_9_2) AppleWebKit/537.36 (KHTML, like Gecko) Chrome/34.0.1847.116 Safari/537.36"
- 21. VARNISH 192.168.32.1 - - [11/Apr/2014:10:47:52 -0400] "GET http://192.168.32.3/ themes/seven/images/list-item.png HTTP/1.1" 200 195 "http://192.168.32.3/ admin/config" "Mozilla/5.0 (Macintosh; Intel Mac OS X 10_9_2) AppleWebKit/ 537.36 (KHTML, like Gecko) Chrome/34.0.1847.116 Safari/537.36"
- 22. ADDITIONAL FEATURES • Apache, nginx, and Varnish all support additional output •Time spent processing the request •Varnish can log cache hit/miss •Any header • With Logstash we can normalize these
- 23. APACHE • Configurable log formats are available – http://httpd.apache.org/docs/ 2.2/mod/mod_log_config.html • A single LogFormat directive in any Apache configuration file will override all log formats • The default NCSA combined log format is as follows • LogFormat "%h %l %u %t "%r" %>s %b "%{Referer}i" "%{User-agent}i"" combined
- 24. APACHE • Additional useful information: • %D Time taken to serve request in microseconds •%{Host}i Value of the Host HTTP header •%p Port • New LogFormat line: • LogFormat "%h %l %u %t "%r" %>s %b "%{Referer}i" "%{User-Agent}i" %D %{Host}i %p" combined
- 25. APACHE 127.0.0.1 - - [29/Jul/2014:22:03:07 +0000] "GET /admin/config/development/ performance HTTP/1.0" 200 3500 "-" "Mozilla/5.0 (Macintosh; Intel Mac OS X 10_9_4) AppleWebKit/537.36 (KHTML, like Gecko) Chrome/36.0.1985.125 Safari/ 537.36" ! 127.0.0.1 - - [29/Jul/2014:22:03:07 +0000] "GET /admin/config/development/ performance HTTP/1.0" 200 3500 "-" "Mozilla/5.0 (Macintosh; Intel Mac OS X 10_9_4) AppleWebKit/537.36 (KHTML, like Gecko) Chrome/36.0.1985.125 Safari/ 537.36" 45304 23.251.149.143 80
- 26. NGINX • Log formats are defined with the log_format directive – http:// nginx.org/en/docs/http/ngx_http_log_module.html#log_format • You may not override the default NCSA combined format • log_format combined '$remote_addr - $remote_user [$time_local] ' '"$request" $status $body_bytes_sent ' '"$http_referer" "$http_user_agent"';
- 27. NGINX • Additional useful information: • $request_time Time taken to serve request in seconds with millisecond resolution (e.g. 0.073) •$http_host Value of the Host HTTP header •$server_post Port
- 28. NGINX • New log_format line and example config for a vhost: • log_format logstash '$remote_addr - $remote_user [$time_local] ' '"$request" $status $body_bytes_sent ' '"$http_referer" "$http_user_agent" ' '$request_time $http_host $server_port'; • access_log /var/log/nginx/access.log logstash;
- 29. NGINX 70.42.157.6 - - [22/Jul/2014:22:03:30 +0000] "POST /logstash-2014.07.22/ _search HTTP/1.0" 200 281190 "http://146.148.34.62/kibana/index.html" "Mozilla/5.0 (Macintosh; Intel Mac OS X 10_9_4) AppleWebKit/537.36 (KHTML, like Gecko) Chrome/36.0.1985.125 Safari/537.36" ! 70.42.157.6 - - [22/Jul/2014:22:03:30 +0000] "POST /logstash-2014.07.22/ _search HTTP/1.0" 200 281190 "http://146.148.34.62/kibana/index.html" "Mozilla/5.0 (Macintosh; Intel Mac OS X 10_9_4) AppleWebKit/537.36 (KHTML, like Gecko) Chrome/36.0.1985.125 Safari/537.36" 0.523 146.148.34.62 80
- 30. VARNISH • The varnishncsa daemon outputs NCSA-format logs • You may pass a different log format to the varnishncsa daemon • Many of the configuration options share the same format as Apache
- 31. VARNISH • Additional useful information: • %D Time taken to serve request in seconds with microsecond precision (e.g. 0.000884) • %{Varnish:hitmiss}x The text "hit" or "miss" • varnishncsa daemon argument: • -F '%h %l %u %t "%r" %s %b "%{Referer}i" "%{User-agent}i" %D %{Varnish:hitmiss}x'
- 32. VARNISH 70.42.157.6 - - [29/Jul/2014:22:03:07 +0000] "GET http://23.251.149.143/ admin/config/development/performance HTTP/1.0" 200 3500 "-" "Mozilla/5.0 (Macintosh; Intel Mac OS X 10_9_4) AppleWebKit/537.36 (KHTML, like Gecko) Chrome/36.0.1985.125 Safari/537.36" ! 70.42.157.6 - - [29/Jul/2014:22:03:07 +0000] "GET http://23.251.149.143/ admin/config/development/performance HTTP/1.0" 200 3500 "-" "Mozilla/5.0 (Macintosh; Intel Mac OS X 10_9_4) AppleWebKit/537.36 (KHTML, like Gecko) Chrome/36.0.1985.125 Safari/537.36" 0.045969 miss
- 33. SHIPPING LOGS
- 34. SHIP THOSE LOGS! • syslog-ng • rsyslogd •Ship syslog •Ship other log files • Logstash • logstash-forwarder (formerly Lumberjack) • Beaver
- 35. SHIPPING CONCERNS • Queueing •Behavior when shipping to remote servers •Max spool disk usage •Retries? • Security •Encrypted channel •Encrypted at rest •Access to sensitive data
- 36. SHIP LOGS WITH RSYSLOGD
- 37. CONFIGURING RSYSLOGD CLIENTS • Ship logs to another rsyslog server over TCP • *.* @@utility:514 • This defaults to shipping anything that it would normally log to /var/ log/syslog or /var/log/messages
- 38. CONFIGURING RSYSLOGD SERVERS • Prevent remote logs from showing up in /var/log/messages • if $source != 'utility' then ~ • Store logs coming in based on hostname and date • $template DailyPerHostLogs,"/var/log/rsyslog/%HOSTNAME%/%HOSTNAME%.% $YEAR%-%$MONTH%-%$DAY%.log" *.* -?DailyPerHostLogs;RSYSLOG_TraditionalFileFormat
- 39. CONFIGURING RSYSLOGD SHIPPING • Read lines from a particular file and ship over syslog • $ModLoad imfile $InputFileName /var/log/httpd/access_log $InputFileTag apache_access: $InputFileStateFile state-apache_access $InputFileSeverity info $InputFileFacility local0 $InputFilePollInterval 10 $InputRunFileMonitor
- 40. CONFIGURING RSYSLOGD SPOOLING • Configure spooling and queueing behavior • $WorkDirectory /var/lib/rsyslog # Where to place spool files $ActionQueueFileName fwdRule1 # Unique name prefix for spool files $ActionQueueMaxDiskSpace 1g # 1 GB space limit $ActionQueueSaveOnShutdown on # Save messages to disk on shutdown $ActionQueueType LinkedList # Run asynchronously $ActionResumeRetryCount -1 # Infinite retries if host is down
- 41. SYSLOG-SHIPPED LOG FILES Mar 11 15:38:14 drupal drupal: http://192.168.32.3|1394566694|system| 192.168.32.1|http://192.168.32.3/admin/modules/list /confirm|http://192.168.32.3/admin/modules|1||php module installed. ! Jul 30 15:04:14 drupal varnish_access: 156.40.118.178 - - [30/Jul/ 2014:15:04:09 +0000] "GET http://23.251.149.143/misc/tableheader.js?n9j5uu HTTP/1.1" 200 1848 "http://23.251.149.143/admin/modules" "Mozilla/5.0 (Macintosh; Intel Mac OS X 10_9_4) AppleWebKit/537.36 (KHTML, like Gecko) Chrome/36.0.1985.125 Safari/537.36" 0.000757 miss
- 42. AUTOMATED LOG AGGREGATION TOOLS
- 43. PROPRIETARY LOG AGGREGATION TOOLS • Third-party SaaS systems are plentiful in this area •Splunk •SumoLogic •Loggly •LogEntries
- 44. LOGSTASH • http://logstash.net/ • Great tool to work with logs of ALL sorts • Has input, filter, and output pipelines • Inputs can be parsed with different codecs (JSON, netflow) • http://logstash.net/docs/1.4.2/ describes many options
- 45. ELASTICSEARCH • http://www.elasticsearch.com/ • A Java search engine based on Lucene, similar to SOLR • Offers a far nicer REST API; easy discovery for clustering
- 46. KIBANA • Great viewer for Logstash logs • Needs direct HTTP access to ElasticSearch •You may need to protect this with nginx or the like • Uses ElasticSearch features to show statistical information • Can show any ElasticSearch data, not just Logstash • Logstash JARs/packages can also run Kibana from an embedded server • ./bin/logstash web -a ADDRESS -p PORT
- 47. GROK • Tool for pulling semantic data from logs; logstash filter • A regex engine with built-in named patterns • Online tools to parse sample logs •http://grokdebug.herokuapp.com/ •http://grokconstructor.appspot.com/
- 48. EXAMPLE: GROKKING NGINX LOGS 192.168.32.1 - - [11/Apr/2014:10:44:36 -0400] "GET /kibana/font/ fontawesome-webfont.woff?v=3.2.1 HTTP/1.1" 200 43572 "http:// 192.168.32.6/kibana/" "Mozilla/5.0 (Macintosh; Intel Mac OS X 10_9_2) AppleWebKit/537.36 (KHTML, like Gecko) Chrome/34.0.1847.116 Safari/537.36"
- 50. LOGSTASH CONFIG • By default Logstash looks in /etc/logstash/conf.d/*.conf • You many include multiple files • Each must have at least an input, filter, or output stanza • Example Logstash configuration follows to parse Drupal and nginx logs from syslog and normalize duration to milliseconds •The full example is posted at http://git.io/e6TvAg
- 51. LOGSTASH CONFIG input { file { path => "/var/log/rsyslog/*/*.log" exclude => "*.bz2" type => syslog sincedb_path => "/var/run/logstash/sincedb" sincedb_write_interval => 10 } } ! output { elasticsearch_http { host => "localhost" flush_size => 5000 } }
- 52. LOGSTASH CONFIG filter { if [type] == "syslog" { mutate { add_field => [ "syslog_message", "%{message}" ] remove_field => "message" } grok { match => [ "syslog_message", "%{SYSLOGLINE}" ] } date { match => [ "timestamp", "MMM d HH:mm:ss", "MMM dd HH:mm:ss" ] }
- 53. LOGSTASH CONFIG # Parse Drupal logs that are logged to syslog. if [program] == "drupal" { grok { match => [ "message", "https?://%{HOSTNAME:vhost}?|% {NUMBER:d_timestamp}|(?<d_type>[^|]*)|%{IP:d_ip}|(?<d_request_uri>[^ |]*)|(?<d_referer>[^|]*)|(?<d_uid>[^|]*)|(?<d_link>[^|]*)|(? <d_message>.*)" ] } }
- 54. LOGSTASH CONFIG # Parse nginx logs that have been shipped over syslog. if [program] == "nginx_access" { mutate { remove_field => [ "path", "pid", "syslog_message", "timestamp" ] } grok { match => [ "message", "%{COMBINEDAPACHELOG} %{BASE16FLOAT:duration} %{IPORHOST:hostname} %{POSINT:port}" ] } # Put the hostname into the request, a la Varnish. if [port] == "443" { mutate { replace => [ "request", "https://%{hostname}%{request}" ] } }
- 55. LOGSTASH CONFIG else { mutate { replace => [ "request", "http://%{hostname}%{request}" ] } } ruby { code => "event['duration'] = event['duration'].to_f * 1000.0" } date { match => [ "timestamp", "dd/MMM/yyyy:HH:mm:ss Z" ] } useragent { source => "agent" target => "browser" } }
- 56. MONITORING AND PERFORMANCE METRICS
- 57. LOGS VS PERFORMANCE COUNTERS • Generally, logs capture data at a particular time • You may also want to keep information about how your servers are running and performing • A separate set of tools are often used to help monitoring and manage systems performance • This data can then be trended to chart resource usage and capacity
- 58. PROPRIETARY METRICS TOOLS • Third-party SaaS systems are also plentiful in this area •DataDog •Librato Metrics •Circonus •New Relic / AppNeta
- 59. TIME-SERIES DATA • Generally, performance counters are taken with regular sampling at an interval, known as time-series data • Several OSS tools exist to store and query time-series data: •RRDTool •Whisper •InfluxDB
- 60. FIRST WAVE: RRD-BASED TOOLS • Many tools can graph metrics and make and plot RRD files •Munin •Cacti •Ganglia •collectd
- 61. SECOND WAVE: GRAPHITE • Graphite is a more general tool; it does not collect metrics • It uses an advanced storage engine called Whisper •It can buffer data and cache it under heavy load •It does not require data to be inserted all the time • It's fully designed to take time-series data and graph it
- 62. STATSD • Statsd is a tool created by Etsy as a simple stats aggregator • It aggregates counters and sends them to Graphite • It accepts data over TCP or UDP • Logstash can increment statsd counters based on log data • The canonical implementation is node.js, but many ports exist • statsite (C), bucky (Python) • For counters, sends raw stats each flush (stats.*) and also event counts per second (stats_counts.*)
- 63. LOGSTASH CONFIG output { if [program] == "varnish_access" { statsd { sender => "%{logsource}" # Count each event based on the HTTP response code. increment => "varnish.response.%{response}" # Also count Varnish hits and misses. increment => "varnish.cache.%{cache}" # Use the 'bytes' field from the varnish log as the count value. count => [ "varnish.bytes", "%{bytes}" ] } } }
- 64. GRAFANA • Grafana is to Graphite as Kibana is to ElasticSearch • HTML / JavaScript app • The user's browser needs direct HTTP access to Graphite •You may need to protect this with nginx or the like
- 65. COLLECTD • http://collectd.org/ • Collectd is a tool that makes it easy to capture many system-level statistics • It can write to RRD databases or to Graphite • Collectd is written in C and is efficient; it can remain resident in memory and report on a regular interval
- 66. DEMO: GRAPHITE / COLLECTD / GRAFANA
- 68. MONITORING TOOLS • Monitoring tools • Nagios • Icinga • Sensu • Zenoss • Zabbix • Monitoring check tools • Monitoring Plugins (née Nagios Plugins) • https://www.monitoring-plugins. org/ • #monitoringsucks • #monitoringlove
- 69. MONITORING CHECKS • Monitoring is generally used to get server state. • Are the web servers online - can I ping them? check_ping • Is the disk more than 80% full on any of my servers? check_disk • Is Redis running and responding to a PING command? check_tcp • Is the load average on any machine over 4? check_load • Have any Drush processes run for more than 10m? check_procs
- 70. METRICS EXAMPLES • Metrics have far deeper insight into application state. •How many failed login attempts have happened in the last 10m? •How many users have logged into the system this week? •What is the average Varnish cache hit rate over the last 5m? •How many 404s have we gotten in the last day? •What is the average backend response time in the last hour?
- 71. BRIDGING METRICS AND MONITORING • Specific metrics values can be very useful to turn into monitoring alerts. • The https://github.com/heroku/umpire project watches Graphite or Librato Metrics and responds with a HTTP 200 or 500. • Point check_http checks or external monitoring like Pingdom at it. • To avoid alert fatigue, try to establish conditions that you know are truly anomalous.
- 72. BRIDGING METRICS AND MONITORING • Example metrics/monitoring bridges with Umpire • Did the average Varnish cache hit rate fall under 60 over the last 5m? • /check?metric=statsd.varnish-hit-rate&min=60&range=300 • Did uid 1 have more than 5 failed login attempts in the past 1h? • /check?metric=statsd.uid-1-login-failure&max=60&range=3600
- 73. DEMO: UMPIRE / STATSD
- 74. THE DRUPAL.ORG LOGGING SETUP
- 75. SINGLE LOG HOST MACHINE • CentOS 5 • Dual quad-core Gulftown Xeons (8 cores, 16 threads) • 16 GB RAM • 600 GB of HDD storage dedicated to Logstash
- 76. SOFTWARE (CURRENT) • ElasticSearch 0.90 • Logstash 1.2 • Kibana 3.0.0m3 • Curator 0.6.2
- 77. SOFTWARE (THIS WEEK) • ElasticSearch 1.3.2 • Logstash 1.4.2 • Kibana 3.1 • Curator 2.0.0
- 78. STATS • Consolidating logs from ≈ 10 web servers • Incoming syslog (Drupal), Apache, and Varnish logs •Looking to add EdgeCast (CDN) logs if we have capacity • Non-syslog logs are updated every hour with rsync • > 2 billion logs processed per month
- 79. FINDING A PROBLEM USING LOGHOST • https://www.drupal.org/node/2186105 • PHP error on saving issues after the Drupal 7 upgrade • Did a Lucene query to get xjm's PHP errors • program:drupal AND d_uid:65776 AND d_type:php • Found PDOExceptions and an issue with a SQL field size
- 80. QUESTIONS?
- 81. RESOURCES
- 82. LINKS • http://httpd.apache.org/docs/2.2/mod/mod_log_config.html • http://logstash.net/ • http://elasticsearch.com/ • https://github.com/elasticsearch/kibana/ • http://graphite.wikidot.com/ • http://grafana.org/ • http://www.phase2technology.com/blog/adding-mysql-slow-query-logs- to-logstash/
- 83. LINKS • https://github.com/elasticsearch/logstash-forwarder • https://collectd.org/ • https://www.drupal.org/documentation/modules/syslog • https://www.monitoring-plugins.org/ • https://github.com/etsy/statsd/ • https://github.com/heroku/umpire • http://git.io/e6TvAg - sample Logstash config for Drupal/nginx
- 84. SPRINTS!
- 86. WHAT DID YOU THINK? E V A L U A T E T H I S S E S S I O N - AMSTERDAM2014.DRUPAL.ORG/SCHEDULE D E V O P S T R A C K , D R U P A L C O N A M ST E R D AM