OSDC 2015: Tudor Golubenco | Application Performance Management with Packetbeat, Elasticsearch and Kibana
0 likes204 views

Packetbeat is an open-source application monitoring tool designed for distributed applications, capturing wire traffic and decoding various protocols. It integrates with Elasticsearch and Kibana for scalable logging and flexible analytics, allowing for easy troubleshooting and performance management. While it has advantages like minimal performance overhead and no need for code changes, it also faces challenges such as handling large data volumes and privacy concerns.


OSDC 2015: Tudor Golubenco | Application Performance Management with Packetbeat, Elasticsearch and Kibana
- 1. Application performance management with PacketBeat, Elasticsearch and Kibana Tudor Golubenco (@tudor_g)
- 3. What is PacketBeat • “Open Source Application Monitoring” • “Monitoring & Troubleshooting for Distributed Applications” • “Distributed Wireshark with a lot more analytics features” • “Application Performance Management”
- 5. How it works • Captures the wire traffic • Follows TCP streams, decodes HTTP, MySQL, PgSQL, REDIS, Thrift-RPC • Looks for requests, waits for the matching response • Records response time, URLs, response codes, etc
- 8. What do we do with the data? ¯(°_o)/¯
- 9. The traditional way • Decide what metrics you need (requests per second for each server, response time percentiles, etc.) • Write code to extract these metrics, store them in a DB • Store the transactions in a DB • Drilling down is difficult • Features like “Top 10 method with errors” are difficult to implement
- 10. PacketBeat + ELK
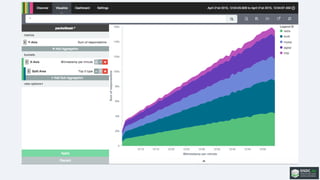
- 11. Why ELK? • Already proven to scale and perform for logs • Clear and simple flow for the data • You don’t have to pre-create the metrics • Ad-hoc troubleshooting and analytics by using Kibana • Drilling down to the problematic transactions is trivial • Top N features are trivial • Slicing by different dimensions is easy
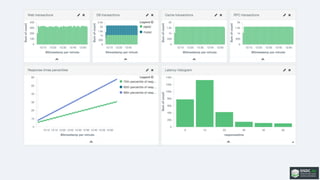
- 12. Show me! ( ̄^ ̄)
- 17. Pros of wire data • Captures a lot of things that other approaches miss • No changes to the code or to the monitored application • Minimal knowledge about the monitored app is required • No latency overhead • When using tap points, zero CPU/memory overhead on the app servers
- 18. Cons of wire data • There can be, like, tons of data • Compared to log processing, larger CPU requirements • Privacy concerns • Doesn’t work for encrypted protocols • Doesn’t work for “in-house” protocols
- 19. Next steps ( ͡ ° ͜ ʖ ͡ °)
- 20. More protocols • Available: • HTTP • MySQL • PostgreSQL • REDIS • Thrift-RPC • Soon (tm): • DNS • Memcache • MongoDB, RethinkDB • Oracle, MSSQL • XMLRPC / JSONRPC • Your suggestions?
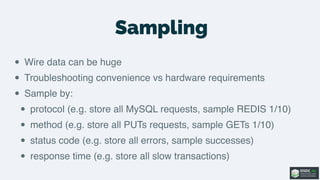
- 21. Sampling • Wire data can be huge • Troubleshooting convenience vs hardware requirements • Sample by: • protocol (e.g. store all MySQL requests, sample REDIS 1/10) • method (e.g. store all PUTs requests, sample GETs 1/10) • status code (e.g. store all errors, sample successes) • response time (e.g. store all slow transactions)
- 22. String obfuscation • Replace: select * from users where username=“Tudor” and id=3 • With: select * from users where username=S8 and id=N3 • Makes TopN charts better • “The Mature Optimisation Handbook” - Carlos Bueno
- 23. Bonito • Our own UI • Similar to Kibana, but focused more on app performance • Will be a Kibana 4 plugin
- 26. Deploying • Getting started guide • packetbeat-deploy • ansible roles for Packetbeat, Elasticsearch, Logstash, Redis, Kibana • supports multiple ES nodes or all-in-one server • ansible-playbook -i hosts site.yml
- 27. Thanks! ( ゚▽゚)/
- 28. Keep in touch • Twitter: @packetbeat or @tudor_g • www: packetbeat.com • github.com/packetbeat/packetbeat