SlideShare a Scribd company logo
How to improve database
observability?
@Charles_JUDITH
About me
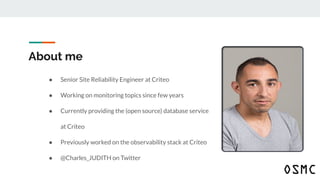
● Senior Site Reliability Engineer at Criteo
● Working on monitoring topics since few years
● Currently providing the (open source) database service
at Criteo
● Previously worked on the observability stack at Criteo
● @Charles_JUDITH on Twitter
Agenda
1. Context
2. First iteration
3. Second iteration
4. Next steps
5. Resources
Context
Context
● Feedback from my experience at Criteo
● MariaDB/MySQL setup on multiple data centers
● Bare metal servers
Context
● Hidden issues (backup, usage, …)
● Incident resolution was based on vague information
● No alerting
● Dashboard with metrics
Goal
● Alerting
● No more hidden issues
● Dashboards for everyone
● An observable platform!
● The DBA team shouldn’t be a “blocker” for the users!
What is observability?
OBSERVABILITY IS A MEASURE OF HOW WELL
INTERNAL STATES OF A SYSTEM CAN BE
INFERRED FROM KNOWLEDGE OF ITS EXTERNAL
OUTPUTS. »
SOURCE: WIKIPEDIA
What I think about observability
● It’s not only about the tools
● It’s not a fancy name to say “monitoring”
● It’s more about “transparency”
Why a system needs to be
observable?
Why a system needs to be observable?
● Is it working as expected by the users?
● To answer basic questions about your service/platform
● Increase the visibility for you and your users/customers
● Long term tends analysis
● “If can’t measure it, you can’t manage it”
Observability is fundamental for reliability
Analogy to the Maslow’s hierarchy of needs
The observability effects
● Giving superpowers
● It’s like a roller coaster
● You need to be patient
Let’s go!
Metrics
How to start?
USE method
● USE was introduced by @brendangregg
● Utilization: disk,CPU usage …
● Saturation: disk I/O
● Errors: network interface errors
The four golden signals
● Introduced in the Google SRE book
● Latency: response time, queue/wait time
● Traffic: A measure of how much demand is being placed on the service
● Errors: The rate of requests that fail
● Saturation: How “full” is the service
RED method
● RED was introduced by @tom_wilkie
● (Request) Rate - the number of requests, per second, you services are serving.
● (Request) Errors - the number of failed requests per second.
● (Request) Duration - distributions of the amount of time each request takes.
● Subset of “The Four Golden Signals”
The seven golden signals
● CELT + USE introduced by @xaprb
● Concurrency: number of simultaneous requests
● Error rate
● Latency: response time
● Throughput: query per seconds (QPS)
CASE method
● CASE was introduced by @gphat
● Context-heavy
● Actionnable
● Symptom-based
● Evaluated
OSMC 2019 | How to improve database Observability by Charles Judith
Preferred approach
● The seven golden signals
● Good to measure the service quality
● System and application metrics are valuable in our case
How to collect the metrics?
● Collectd
● Node exporter
● MySQLD exporter
● Python MySQL plugin for CollectD
● Few others
What to do with all these metrics?
● Pick some useful “indicators” like:
○ thread usage
○ service status
○ backup status, duration, size
○ replication lag
How to show/use those
metrics?
Global overview
InnoDB metrics
Simple user view
USE dashboard
Disk partition full with
tmp_table
Max connection reached
Database cleaning and
optimize table
DATABASES EXPOSE LOTS OF METRICS ABOUT
THEIR STATUS, BUT MUCH LESS ABOUT THE
DETAILS OF THEIR WORKLOAD.
Current status
● We have system and database metrics
● Alerting
● Dashboards with metrics easily available for everyone
“WE THINK OUR DATABASE IS SLOW?”
“Last week week we noticed that
the database was slow.”
OSMC 2019 | How to improve database Observability by Charles Judith
Logs
Logs
● Logs all the SQL queries (general log)
● Install an agent to ship those logs with “custom fields”
● Make the logs available for our users
Logs
● Logs all the SQL queries (general log)
● Install an agent to ship those logs with “custom fields”
● Configure MySQL/MariaDB to log the slow queries
● Use Rsyslog with a custom template!
● Make the logs available for our users
OSMC 2019 | How to improve database Observability by Charles Judith
Happy customers
Benefits
● The DBA is not a blocker for the developers
● Better visibility on the database service
● Happy customers/developers/users
Conclusions
● The visibility and transparency
● Effective monitoring
● Shipping slow queries is not easy
● In that case metrics and logs is a good combo but we want more!
Next steps
● Continue to improve the SQL logging
● Leverage the usage of sys_schema
● Metrics per database
● Publish the SLA
● Open source our probe for MySQL/MariaDB
Resources
https://github.com/CharlesJUDITH/database-observability-toolkit
Thank you!

More Related Content

What's hot (17)

PDF
MySQL 高可用性
YUCHENG HU
 
PPTX
Debugging the Deadlock for the Scheduler
Amit Banerjee
 
PDF
Quick dive into the big data pool without drowning - Demi Ben-Ari @ Panorays
Demi Ben-Ari
 
PDF
Security Best Practices for your Postgres Deployment
PGConf APAC
 
PPTX
Monitoring sql server
John Martin
 
PDF
Instaclustr Apache Cassandra Best Practices & Toubleshooting
Instaclustr
 
PPTX
Hardware Provisioning
MongoDB
 
PDF
Log Management: AtlSecCon2015
cameronevans
 
PDF
Instaclustr introduction to managing cassandra
Instaclustr
 
PPTX
Metrics lightning talk
Chris Lohfink
 
PDF
Cassandra Community Webinar | Data Model on Fire
DataStax
 
PDF
Flux architecture and Redux - theory, context and practice
Jakub Kocikowski
 
PPT
HBASE by Nicolas Liochon - Meetup HUGFR du 22 Sept 2014
Modern Data Stack France
 
PPTX
Zookeeper
SatyaHadoop
 
PPTX
Евгений Хыст "Application performance database related problems"
Anna Shymchenko
 
PDF
Architecture by Accident
Gleicon Moraes
 
MySQL 高可用性
YUCHENG HU
 
Debugging the Deadlock for the Scheduler
Amit Banerjee
 
Quick dive into the big data pool without drowning - Demi Ben-Ari @ Panorays
Demi Ben-Ari
 
Security Best Practices for your Postgres Deployment
PGConf APAC
 
Monitoring sql server
John Martin
 
Instaclustr Apache Cassandra Best Practices & Toubleshooting
Instaclustr
 
Hardware Provisioning
MongoDB
 
Log Management: AtlSecCon2015
cameronevans
 
Instaclustr introduction to managing cassandra
Instaclustr
 
Metrics lightning talk
Chris Lohfink
 
Cassandra Community Webinar | Data Model on Fire
DataStax
 
Flux architecture and Redux - theory, context and practice
Jakub Kocikowski
 
HBASE by Nicolas Liochon - Meetup HUGFR du 22 Sept 2014
Modern Data Stack France
 
Zookeeper
SatyaHadoop
 
Евгений Хыст "Application performance database related problems"
Anna Shymchenko
 
Architecture by Accident
Gleicon Moraes
 

Similar to OSMC 2019 | How to improve database Observability by Charles Judith (20)

PDF
#OSSPARIS19 - How to improve database observability - CHARLES JUDITH, Criteo
Paris Open Source Summit
 
PDF
kranonit S06E01 Игорь Цинько: High load
Krivoy Rog IT Community
 
PPTX
Scaling apps for the big time
proitconsult
 
PDF
Building a data pipeline to ingest data into Hadoop in minutes using Streamse...
Guglielmo Iozzia
 
PDF
Sql server tips from the field
JoAnna Cheshire
 
PPTX
Design patterns for scaling web applications
Ivan Dimitrov
 
PDF
MongoDB World 2019: Packing Up Your Data and Moving to MongoDB Atlas
MongoDB
 
PDF
Cloud arch patterns
Corey Huinker
 
PPTX
20240515 - Chicago PUG - Clustering in PostgreSQL: Because one database serve...
Umair Shahid
 
PPTX
Wayfair Storefront Performance Monitoring with InfluxEnterprise by Richard La...
InfluxData
 
PDF
Accelerating Data Science with Better Data Engineering on Databricks
Databricks
 
PDF
Data Con LA 2018 - Enabling real-time exploration and analytics at scale at H...
Data Con LA
 
PPTX
Training Webinar: Detect Performance Bottlenecks of Applications
OutSystems
 
PDF
Machine learning and big data @ uber a tale of two systems
Zhenxiao Luo
 
PDF
Best Practices for Becoming an Exceptional Postgres DBA
EDB
 
PDF
Apache Cassandra at Target - Cassandra Summit 2014
Dan Cundiff
 
PDF
Building a Database for the End of the World
jhugg
 
PPTX
Improve your SQL workload with observability
OVHcloud
 
PPTX
Druid Summit 2023 : Changing Druid Ingestion from 3 hours to 5 minutes
Shivji Kumar Jha
 
PPTX
DockerCon Europe 2018 Monitoring & Logging Workshop
Brian Christner
 
#OSSPARIS19 - How to improve database observability - CHARLES JUDITH, Criteo
Paris Open Source Summit
 
kranonit S06E01 Игорь Цинько: High load
Krivoy Rog IT Community
 
Scaling apps for the big time
proitconsult
 
Building a data pipeline to ingest data into Hadoop in minutes using Streamse...
Guglielmo Iozzia
 
Sql server tips from the field
JoAnna Cheshire
 
Design patterns for scaling web applications
Ivan Dimitrov
 
MongoDB World 2019: Packing Up Your Data and Moving to MongoDB Atlas
MongoDB
 
Cloud arch patterns
Corey Huinker
 
20240515 - Chicago PUG - Clustering in PostgreSQL: Because one database serve...
Umair Shahid
 
Wayfair Storefront Performance Monitoring with InfluxEnterprise by Richard La...
InfluxData
 
Accelerating Data Science with Better Data Engineering on Databricks
Databricks
 
Data Con LA 2018 - Enabling real-time exploration and analytics at scale at H...
Data Con LA
 
Training Webinar: Detect Performance Bottlenecks of Applications
OutSystems
 
Machine learning and big data @ uber a tale of two systems
Zhenxiao Luo
 
Best Practices for Becoming an Exceptional Postgres DBA
EDB
 
Apache Cassandra at Target - Cassandra Summit 2014
Dan Cundiff
 
Building a Database for the End of the World
jhugg
 
Improve your SQL workload with observability
OVHcloud
 
Druid Summit 2023 : Changing Druid Ingestion from 3 hours to 5 minutes
Shivji Kumar Jha
 
DockerCon Europe 2018 Monitoring & Logging Workshop
Brian Christner
 
Ad

Recently uploaded (20)

PPTX
Help for Correlations in IBM SPSS Statistics.pptx
Version 1 Analytics
 
PPTX
Foundations of Marketo Engage - Powering Campaigns with Marketo Personalization
bbedford2
 
PPTX
In From the Cold: Open Source as Part of Mainstream Software Asset Management
Shane Coughlan
 
PPTX
OpenChain @ OSS NA - In From the Cold: Open Source as Part of Mainstream Soft...
Shane Coughlan
 
PDF
Open Chain Q2 Steering Committee Meeting - 2025-06-25
Shane Coughlan
 
PDF
Technical-Careers-Roadmap-in-Software-Market.pdf
Hussein Ali
 
PDF
[Solution] Why Choose the VeryPDF DRM Protector Custom-Built Solution for You...
Lingwen1998
 
PDF
MiniTool Partition Wizard Free Crack + Full Free Download 2025
bashirkhan333g
 
PDF
Driver Easy Pro 6.1.1 Crack Licensce key 2025 FREE
utfefguu
 
PPTX
Comprehensive Risk Assessment Module for Smarter Risk Management
EHA Soft Solutions
 
PDF
Digger Solo: Semantic search and maps for your local files
seanpedersen96
 
PDF
Build It, Buy It, or Already Got It? Make Smarter Martech Decisions
bbedford2
 
PPTX
Milwaukee Marketo User Group - Summer Road Trip: Mapping and Personalizing Yo...
bbedford2
 
PDF
MiniTool Partition Wizard 12.8 Crack License Key LATEST
hashhshs786
 
PDF
The 5 Reasons for IT Maintenance - Arna Softech
Arna Softech
 
PPTX
Agentic Automation Journey Series Day 2 – Prompt Engineering for UiPath Agents
klpathrudu
 
PPTX
Finding Your License Details in IBM SPSS Statistics Version 31.pptx
Version 1 Analytics
 
PPTX
Coefficient of Variance in IBM SPSS Statistics Version 31.pptx
Version 1 Analytics
 
PDF
Odoo CRM vs Zoho CRM: Honest Comparison 2025
Odiware Technologies Private Limited
 
PDF
Add Background Images to Charts in IBM SPSS Statistics Version 31.pdf
Version 1 Analytics
 
Help for Correlations in IBM SPSS Statistics.pptx
Version 1 Analytics
 
Foundations of Marketo Engage - Powering Campaigns with Marketo Personalization
bbedford2
 
In From the Cold: Open Source as Part of Mainstream Software Asset Management
Shane Coughlan
 
OpenChain @ OSS NA - In From the Cold: Open Source as Part of Mainstream Soft...
Shane Coughlan
 
Open Chain Q2 Steering Committee Meeting - 2025-06-25
Shane Coughlan
 
Technical-Careers-Roadmap-in-Software-Market.pdf
Hussein Ali
 
[Solution] Why Choose the VeryPDF DRM Protector Custom-Built Solution for You...
Lingwen1998
 
MiniTool Partition Wizard Free Crack + Full Free Download 2025
bashirkhan333g
 
Driver Easy Pro 6.1.1 Crack Licensce key 2025 FREE
utfefguu
 
Comprehensive Risk Assessment Module for Smarter Risk Management
EHA Soft Solutions
 
Digger Solo: Semantic search and maps for your local files
seanpedersen96
 
Build It, Buy It, or Already Got It? Make Smarter Martech Decisions
bbedford2
 
Milwaukee Marketo User Group - Summer Road Trip: Mapping and Personalizing Yo...
bbedford2
 
MiniTool Partition Wizard 12.8 Crack License Key LATEST
hashhshs786
 
The 5 Reasons for IT Maintenance - Arna Softech
Arna Softech
 
Agentic Automation Journey Series Day 2 – Prompt Engineering for UiPath Agents
klpathrudu
 
Finding Your License Details in IBM SPSS Statistics Version 31.pptx
Version 1 Analytics
 
Coefficient of Variance in IBM SPSS Statistics Version 31.pptx
Version 1 Analytics
 
Odoo CRM vs Zoho CRM: Honest Comparison 2025
Odiware Technologies Private Limited
 
Add Background Images to Charts in IBM SPSS Statistics Version 31.pdf
Version 1 Analytics
 
Ad

OSMC 2019 | How to improve database Observability by Charles Judith

  • 1. How to improve database observability? @Charles_JUDITH
  • 2. About me ● Senior Site Reliability Engineer at Criteo ● Working on monitoring topics since few years ● Currently providing the (open source) database service at Criteo ● Previously worked on the observability stack at Criteo ● @Charles_JUDITH on Twitter
  • 3. Agenda 1. Context 2. First iteration 3. Second iteration 4. Next steps 5. Resources
  • 5. Context ● Feedback from my experience at Criteo ● MariaDB/MySQL setup on multiple data centers ● Bare metal servers
  • 6. Context ● Hidden issues (backup, usage, …) ● Incident resolution was based on vague information ● No alerting ● Dashboard with metrics
  • 7. Goal ● Alerting ● No more hidden issues ● Dashboards for everyone ● An observable platform! ● The DBA team shouldn’t be a “blocker” for the users!
  • 9. OBSERVABILITY IS A MEASURE OF HOW WELL INTERNAL STATES OF A SYSTEM CAN BE INFERRED FROM KNOWLEDGE OF ITS EXTERNAL OUTPUTS. » SOURCE: WIKIPEDIA
  • 10. What I think about observability ● It’s not only about the tools ● It’s not a fancy name to say “monitoring” ● It’s more about “transparency”
  • 11. Why a system needs to be observable?
  • 12. Why a system needs to be observable? ● Is it working as expected by the users? ● To answer basic questions about your service/platform ● Increase the visibility for you and your users/customers ● Long term tends analysis ● “If can’t measure it, you can’t manage it”
  • 13. Observability is fundamental for reliability Analogy to the Maslow’s hierarchy of needs
  • 15. The observability effects ● Giving superpowers ● It’s like a roller coaster ● You need to be patient
  • 19. USE method ● USE was introduced by @brendangregg ● Utilization: disk,CPU usage … ● Saturation: disk I/O ● Errors: network interface errors
  • 20. The four golden signals ● Introduced in the Google SRE book ● Latency: response time, queue/wait time ● Traffic: A measure of how much demand is being placed on the service ● Errors: The rate of requests that fail ● Saturation: How “full” is the service
  • 21. RED method ● RED was introduced by @tom_wilkie ● (Request) Rate - the number of requests, per second, you services are serving. ● (Request) Errors - the number of failed requests per second. ● (Request) Duration - distributions of the amount of time each request takes. ● Subset of “The Four Golden Signals”
  • 22. The seven golden signals ● CELT + USE introduced by @xaprb ● Concurrency: number of simultaneous requests ● Error rate ● Latency: response time ● Throughput: query per seconds (QPS)
  • 23. CASE method ● CASE was introduced by @gphat ● Context-heavy ● Actionnable ● Symptom-based ● Evaluated
  • 25. Preferred approach ● The seven golden signals ● Good to measure the service quality ● System and application metrics are valuable in our case
  • 26. How to collect the metrics? ● Collectd ● Node exporter ● MySQLD exporter ● Python MySQL plugin for CollectD ● Few others
  • 27. What to do with all these metrics? ● Pick some useful “indicators” like: ○ thread usage ○ service status ○ backup status, duration, size ○ replication lag
  • 28. How to show/use those metrics?
  • 33. Disk partition full with tmp_table
  • 36. DATABASES EXPOSE LOTS OF METRICS ABOUT THEIR STATUS, BUT MUCH LESS ABOUT THE DETAILS OF THEIR WORKLOAD.
  • 37. Current status ● We have system and database metrics ● Alerting ● Dashboards with metrics easily available for everyone
  • 38. “WE THINK OUR DATABASE IS SLOW?” “Last week week we noticed that the database was slow.”
  • 40. Logs
  • 41. Logs ● Logs all the SQL queries (general log) ● Install an agent to ship those logs with “custom fields” ● Make the logs available for our users
  • 42. Logs ● Logs all the SQL queries (general log) ● Install an agent to ship those logs with “custom fields” ● Configure MySQL/MariaDB to log the slow queries ● Use Rsyslog with a custom template! ● Make the logs available for our users
  • 47. Benefits ● The DBA is not a blocker for the developers ● Better visibility on the database service ● Happy customers/developers/users
  • 48. Conclusions ● The visibility and transparency ● Effective monitoring ● Shipping slow queries is not easy ● In that case metrics and logs is a good combo but we want more!
  • 49. Next steps ● Continue to improve the SQL logging ● Leverage the usage of sys_schema ● Metrics per database ● Publish the SLA ● Open source our probe for MySQL/MariaDB