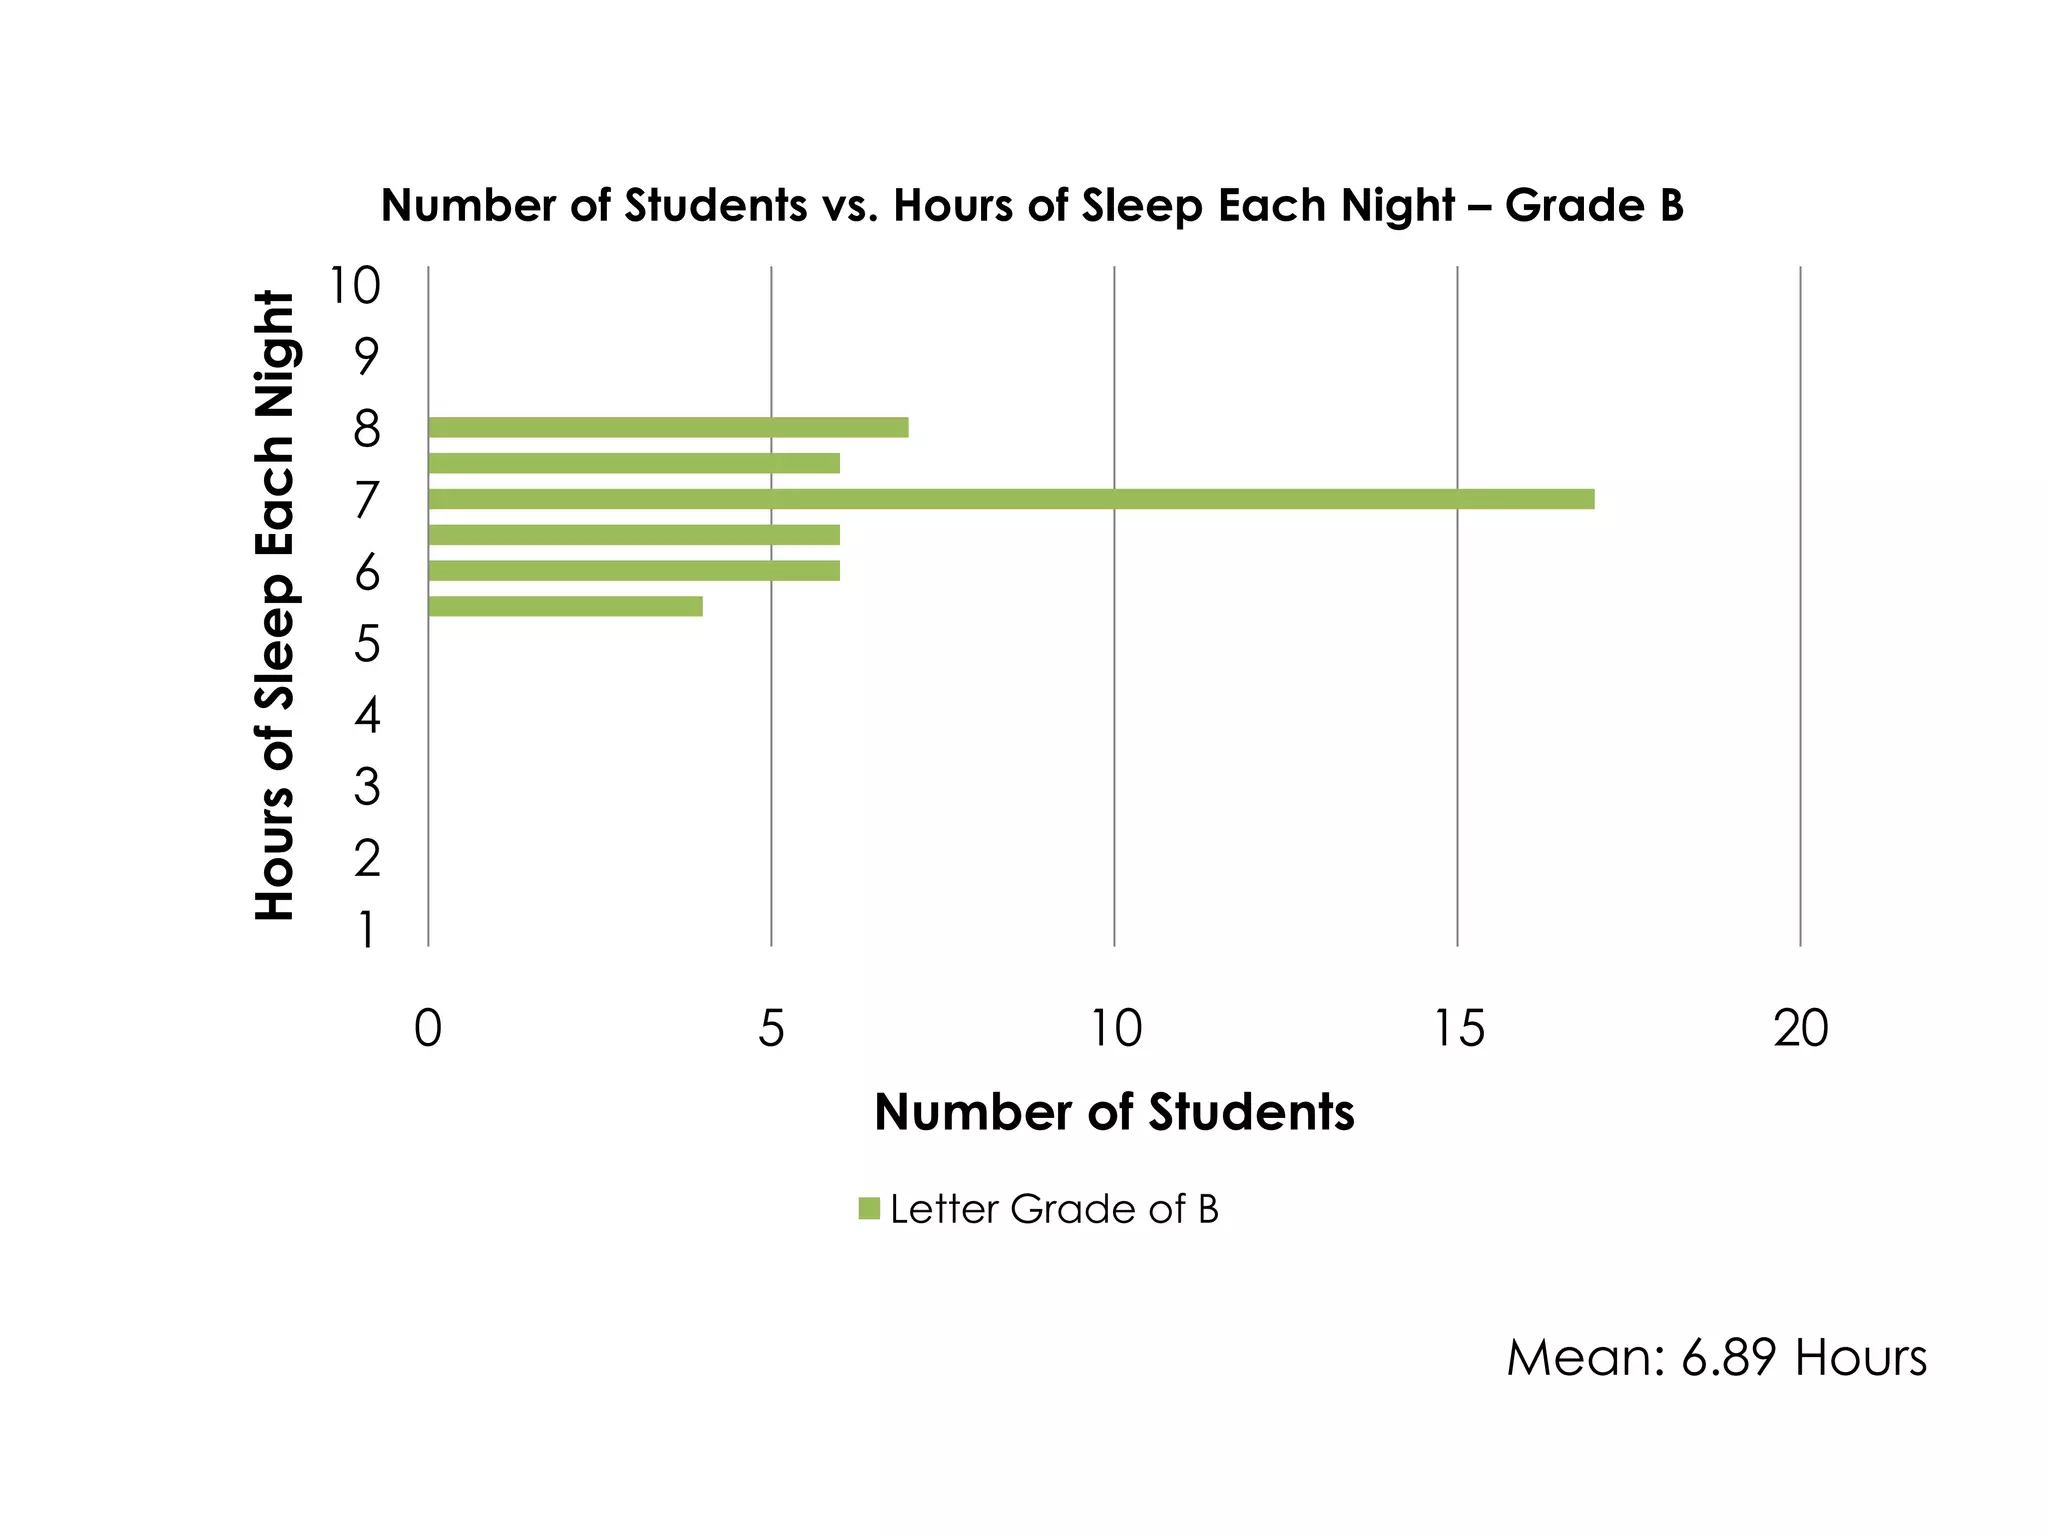
Our Statistical StudyBy Mia Coelho, Anne Duessel, and Mike Hynes
Research Question:Does the amount of sleep you get each night affect your school work?
Study BackgroundObservational/retrospective studyGrades from Quarter 1No treatments involvedPopulation: All high school studentsSample: 8 classes in Hampton High School
Conducting the StudySelecting classes:Stratify into 4 grade levels for equal representation; 2 classes per gradeAssign each class in each grade a number, use randomnumbers.org to determine which classes to surveyThe classes we chose:World Geography 9, Honors Biology 9, Honors English 10, Honors World History 10, Physics 1, Honors English 11, Honors English 12, and American Government.Gave survey to each student in class, 2 questions:How many hours of sleep do you typically get each night?What was your letter grade for the first quarter?
Our Results
Mean: 7.03 HoursAdjusted Mean: 7.05 Hours
Mean: 6.89 Hours
Mean: 6.29 HoursAdjusted Mean: 6.5 Hours
What can we determine?All graphs suggest a normal, unimodel distribution, with the exception of the one low outlier on the “Letter Grade of A” graph and the slightly low outlier on the “Letter Grade of C” graph.Interestingly, the distribution of the graphs actually suggests that as one’s hours of sleep each night go down, their grades also tend to go down.This is confirmed by taking the mean and adjusted mean of the graphsWhile we can’t conclude that less hours of sleep causes a lower grade, the model definitely suggests a relationship between the two.
Things to consider:There are some potential lurking variables and problems in this study:Potentially inaccurate data: outlier on “Letter Grade A” graph – student may have been lying, which would have altered our data.A lurking variable: students who get more sleep may be more academically focused and mature, which would also lead them to study habits, etc.Hampton inflation: With such a high number of A students compared to the number of C students, C students do not have equal representation.Confidentiality: Students who felt uncomfortable with taking the survey were allowed to refuse to take it, which may have led to some non-response bias.
SolutionsWhile there are some issues with our study that are impossible to fix, we took measures to make it as accurate as possible:We accounted for each grade level so there was equal representationWe randomized the classes we close to surveyWe contacted students who were absent the day the survey was conductedBy taking the mean and adjusted mean, we lessen the importance of not having enough C students to survey because we use the average.With the adjusted mean, we account for the difference the outliers (which may have been unreliable outliers) made.
Further study?If this study were to be duplicated on a larger level, we would recommend randomly selecting a high school, not just classes within a high school. This would mean we would account for each region we were hoping to study.Because this data is qualitative and not quantitative, extrapolation cannot really be used.If further studied, perhaps asking for a grade percentage would yield most accurate resultsAlso, there would need to be a way to assure reliable data—perhaps a prospective study, where a student would log in how many hours of sleep they got each night for 9 weeks?Prospective would be more accurate; as time passes, a retrospective study becomes more unreliable
Thank you! 

Our statistical study, anne

  • 1.
    Our Statistical StudyByMia Coelho, Anne Duessel, and Mike Hynes
  • 2.
    Research Question:Does theamount of sleep you get each night affect your school work?
  • 3.
    Study BackgroundObservational/retrospective studyGradesfrom Quarter 1No treatments involvedPopulation: All high school studentsSample: 8 classes in Hampton High School
  • 4.
    Conducting the StudySelectingclasses:Stratify into 4 grade levels for equal representation; 2 classes per gradeAssign each class in each grade a number, use randomnumbers.org to determine which classes to surveyThe classes we chose:World Geography 9, Honors Biology 9, Honors English 10, Honors World History 10, Physics 1, Honors English 11, Honors English 12, and American Government.Gave survey to each student in class, 2 questions:How many hours of sleep do you typically get each night?What was your letter grade for the first quarter?
  • 5.
  • 8.
    Mean: 7.03 HoursAdjustedMean: 7.05 Hours
  • 9.
  • 10.
    Mean: 6.29 HoursAdjustedMean: 6.5 Hours
  • 11.
    What can wedetermine?All graphs suggest a normal, unimodel distribution, with the exception of the one low outlier on the “Letter Grade of A” graph and the slightly low outlier on the “Letter Grade of C” graph.Interestingly, the distribution of the graphs actually suggests that as one’s hours of sleep each night go down, their grades also tend to go down.This is confirmed by taking the mean and adjusted mean of the graphsWhile we can’t conclude that less hours of sleep causes a lower grade, the model definitely suggests a relationship between the two.
  • 12.
    Things to consider:Thereare some potential lurking variables and problems in this study:Potentially inaccurate data: outlier on “Letter Grade A” graph – student may have been lying, which would have altered our data.A lurking variable: students who get more sleep may be more academically focused and mature, which would also lead them to study habits, etc.Hampton inflation: With such a high number of A students compared to the number of C students, C students do not have equal representation.Confidentiality: Students who felt uncomfortable with taking the survey were allowed to refuse to take it, which may have led to some non-response bias.
  • 13.
    SolutionsWhile there aresome issues with our study that are impossible to fix, we took measures to make it as accurate as possible:We accounted for each grade level so there was equal representationWe randomized the classes we close to surveyWe contacted students who were absent the day the survey was conductedBy taking the mean and adjusted mean, we lessen the importance of not having enough C students to survey because we use the average.With the adjusted mean, we account for the difference the outliers (which may have been unreliable outliers) made.
  • 14.
    Further study?If thisstudy were to be duplicated on a larger level, we would recommend randomly selecting a high school, not just classes within a high school. This would mean we would account for each region we were hoping to study.Because this data is qualitative and not quantitative, extrapolation cannot really be used.If further studied, perhaps asking for a grade percentage would yield most accurate resultsAlso, there would need to be a way to assure reliable data—perhaps a prospective study, where a student would log in how many hours of sleep they got each night for 9 weeks?Prospective would be more accurate; as time passes, a retrospective study becomes more unreliable
  • 15.