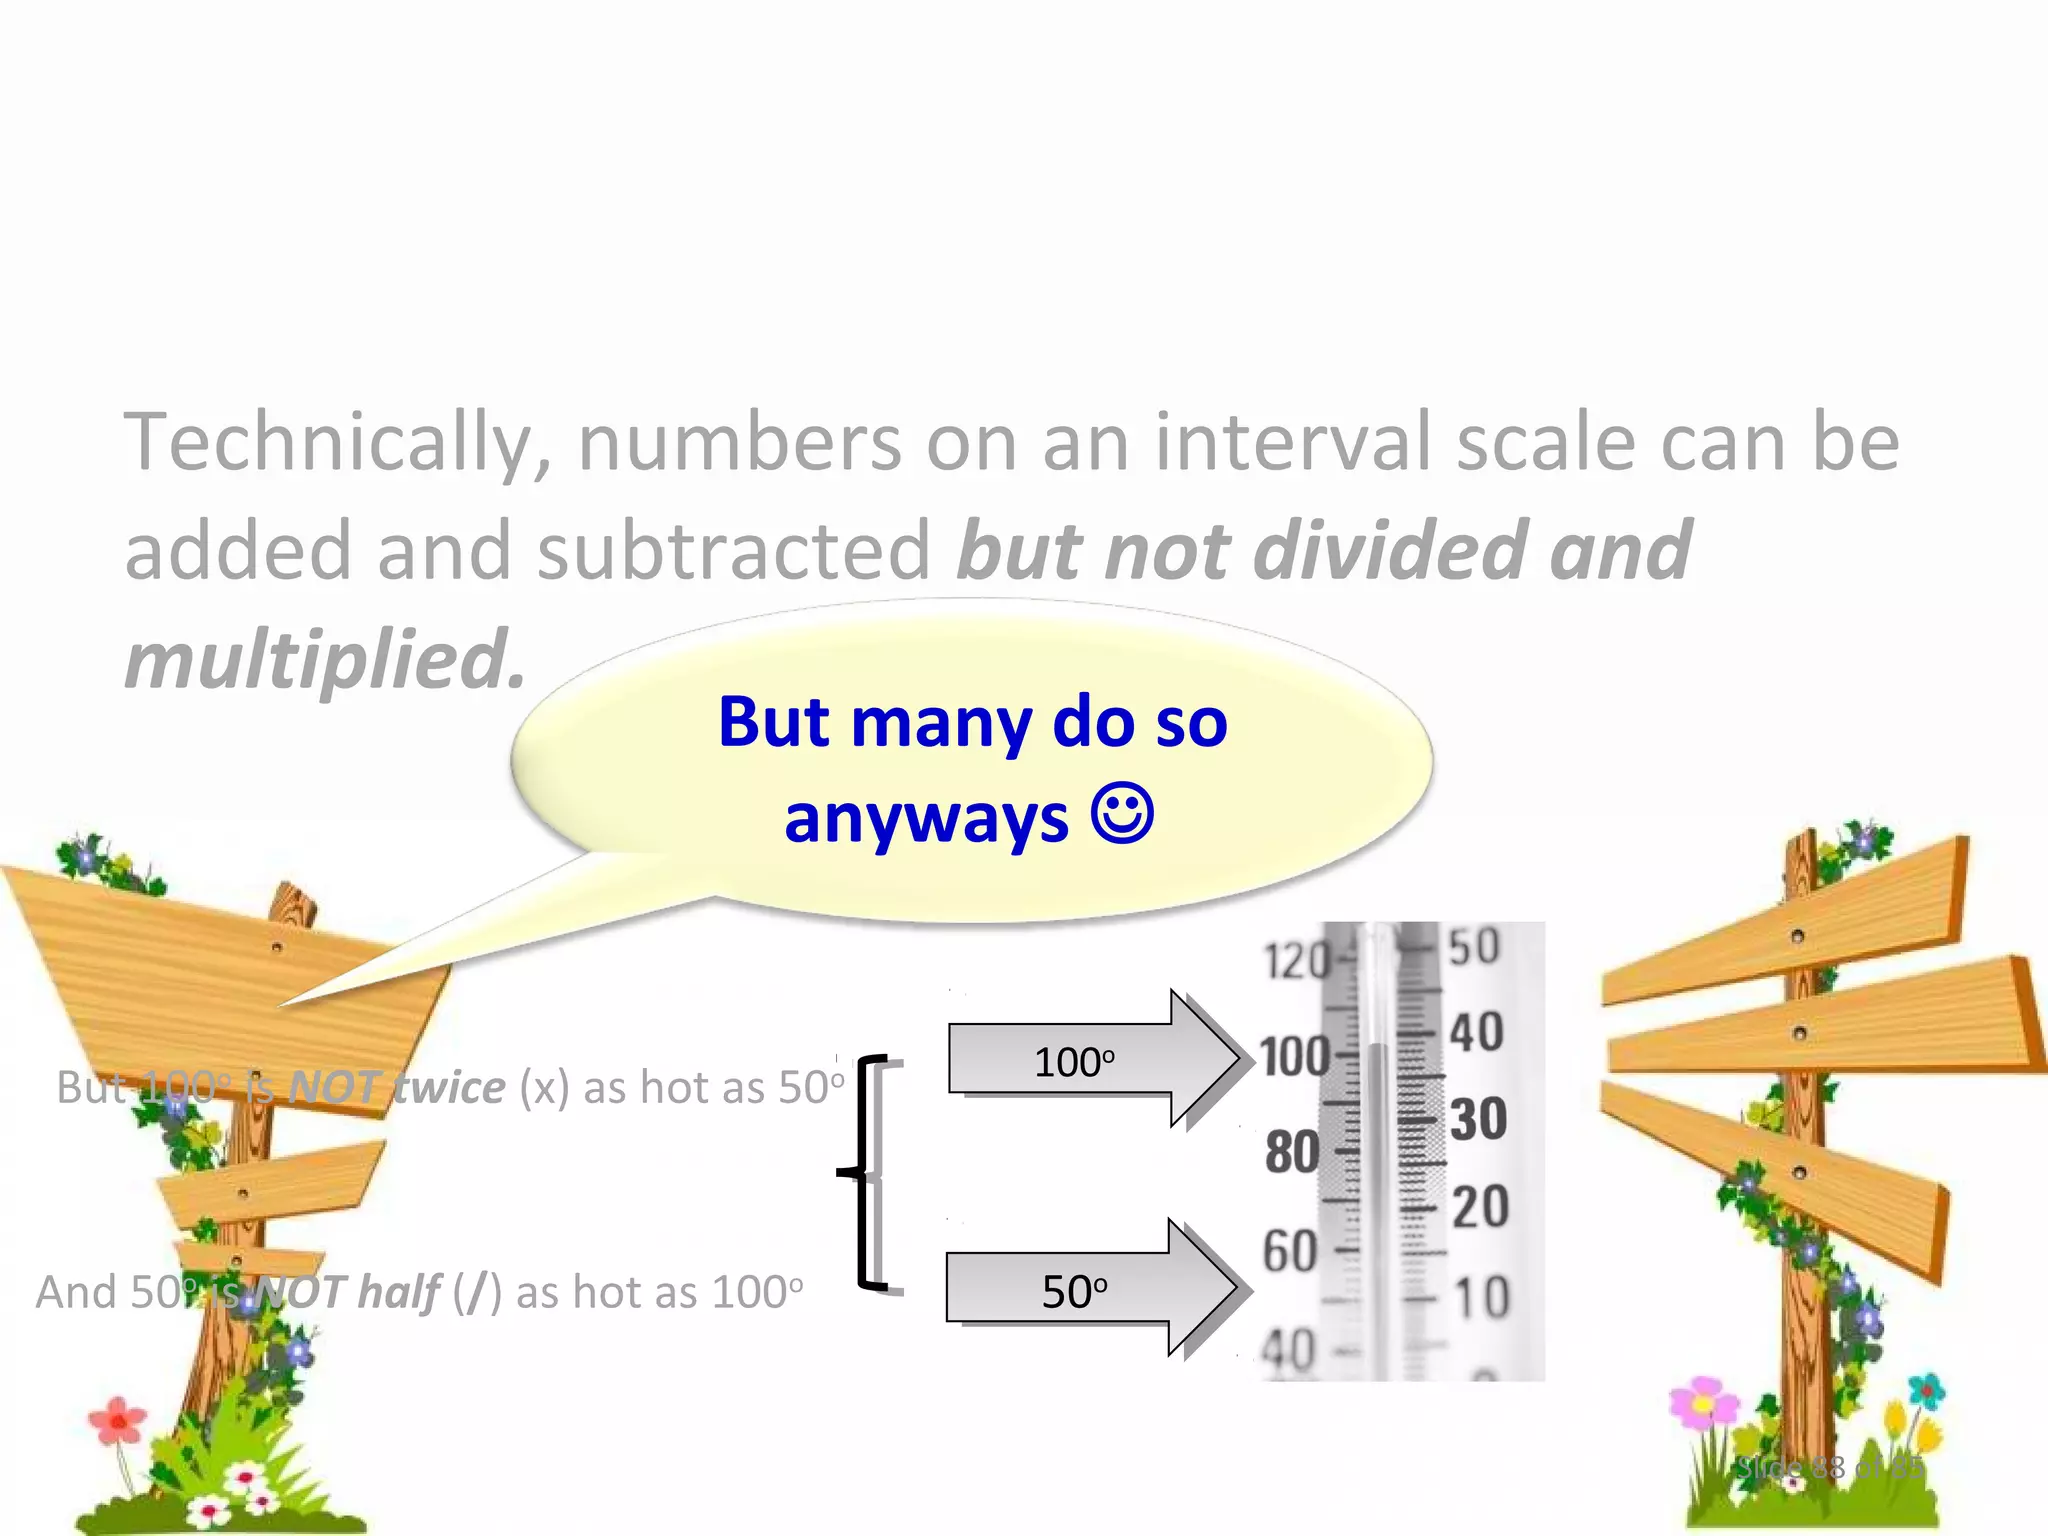
Numbers, Measurement and 
Numerical Relationships
In quantitative research, dependent, 
independent and relevant variables are describe 
in numeral form. 
Some variables may be easily defined or 
measured; other are more abstract and difficult 
to define. 
Slide 2 of 85
In quantitative research, dependent, 
independent and relevant variables are describe 
in numeral form. 
Some variables may be easily defined or 
measured; other are more abstract and difficult 
to define. 
Slide 3 of 85
Different measurement use the same numerals 
(i.e., 1, 2, 3, 4 . . .) 
But, the numerals carry different information 
and carry different information and symbolize 
different phenomena across scales (i.e., 1 = 
Catholic, 2 = Mormon . . . or 1 = Agree, 2 = 
Disagree, or 1 = correct, 0 = incorrect) 
Slide 4 of 85
Different measurement use the same numerals 
(i.e., 1, 2, 3, 4 . . .) 
But, the numerals carry different information 
and carry different information and symbolize 
different phenomena across scales (i.e., 1 = 
Catholic, 2 = Mormon . . . or 1 = Agree, 2 = 
Disagree, or 1 = correct, 0 = incorrect) 
Slide 5 of 85
Different measurement use the same numerals 
(i.e., 1, 2, 3, 4 . . .) 
But, the numerals carry different information 
and symbolize different phenomena across 
scales (i.e., 1 = Catholic, 2 = Mormon . . . or 1 = 
Agree, 2 = Disagree, or 1 = correct, 0 = incorrect) 
Slide 6 of 85
Different scales of measurement use the same 
numerals (i.e., 1, 2, 3, 4 . . .) 
But, the numerals carry different information and 
symbolize different phenomena across scales 
EX: 
•1 = Catholic, 2 = Mormon . . . 
•1 = Agree, 2 = Disagree 
•1 = correct, 0 = incorrect 
Slide 7 of 85
Different scales of measurement use the same 
numerals (i.e., 1, 2, 3, 4 . . .) 
But, the numerals carry different information 
and symbolize different phenomena across 
scales (i.e., 
•1 = Catholic, 2 = Mormon . . . 
•1 = Agree, 2 = Disagree 
•1 = correct, 0 = incorrect 
Slide 8 of 85
Different scales of measurement use the same 
numerals (i.e., 1, 2, 3, 4 . . .) 
But, the numerals carry different information 
and symbolize different phenomena across 
scales (i.e., 
•1 = Catholic, 2 = Mormon . . . 
•1 = Agree, 2 = Disagree 
•1 = correct, 0 = incorrect 
Slide 9 of 85
The Four Main Types of Measurement 
they are: 
Nominal (1 = Male, 2 = Female) 
Ordinal (1 = Private, 2 = Sergeant, 3 = Lieutenant . . .) 
Interval (30OF, 40OF, 50O . . .) 
Ratio (0 meters, 10 meters, 100 meters . . .) 
Slide 10 of 85
•Nominal (1 = Male, 2 = Female) 
•Ordinal (1 = Private, 2 = Sergeant, 3 = Lieutenant . . .) 
•Interval (30OF, 40OF, 50O . . .) 
•Ratio (0 meters, 10 meters, 100 meters . . .) 
Slide 11 of 85
Nominal (1 = Male, 2 = Female) 
Ordinal (1 = Private, 2 = Sergeant, 3 = Lieutenant . . .) 
Interval (30OF, 40OF, 50O . . .) 
Ratio (0 meters, 10 meters, 100 meters . . .) 
Slide 12 of 85
Nominal (1 = Male, 2 = Female) 
Ordinal (1 = Private, 2 = Sergeant, 3 = Lieutenant . . .) 
Interval (30OF, 40OF, 50O . . .) 
Ratio (0 meters, 10 meters, 100 meters . . .) 
Slide 13 of 85
Nominal (1 = Male, 2 = Female) 
Ordinal (1 = Private, 2 = Sergeant, 3 = Lieutenant ) 
Interval (30OF, 40OF, 50O . . .) 
Ratio (0 meters, 10 meters, 100 meters . . .) 
Slide 14 of 85
Nominal, Ordinal, Interval, Ratio 
Slide 15 of 85
Nominal, Ordinal, Interval, Ratio 
Nominal scales use numbers as replacements 
for names. 
Slide 16 of 85
Nominal, Ordinal, Interval, Ratio 
Nominal scales use numbers as replacements 
for names. 
1 = American 
Slide 17 of 85
Nominal, Ordinal, Interval, Ratio 
Nominal scales use numbers as replacements 
for names. 
1 = American 
2 = Canadian 
Slide 18 of 85
Nominal, Ordinal, Interval, Ratio 
Nominal scales use numbers as replacements 
for names. 
1 = American 
2 = Canadian 
3 = Mexican 
Slide 19 of 85
Nominal, Ordinal, Interval, Ratio 
Nominal scales use numbers as replacements 
for names. 
1 = American 
2 = Canadian 
3 = Mexican 
Data Set 
Slide 20 of 85
Nominal, Ordinal, Interval, Ratio 
Nominal scales use numbers as replacements 
for names. 
1 = American 
2 = Canadian 
3 = Mexican 
Data Set 
Slide 21 of 85
Nominal, Ordinal, Interval, Ratio 
Nominal scales use numbers as replacements 
for names. 
1 = American 
2 = Canadian 
3 = Mexican 
Data Set 
Slide 22 of 85
Nominal 
Nominal scales use numbers as replacements 
for names. 
1 = American 
2 = Canadian 
3 = Mexican 
Data Set 
Slide 23 of 85
Nominal, Ordinal, Interval, Ratio 
Nominal scales use numbers as replacements 
for names. 
1 = American 
2 = Canadian 
3 = Mexican 
Data Set 
Slide 24 of 85
Nominal, Ordinal, Interval, Ratio 
The root of the term “nominal” is “nom” 
meaning “name”. 
Slide 25 of 85
Nominal, Ordinal, Interval, Ratio 
Nominal scales 
•assume no quantity of the attribute. 
Slide 26 of 85
Nominal, Ordinal, Interval, Ratio 
Nominal scales 
•assume no quantity of the attribute. 
1 = American 
2 = Canadian 
Slide 27 of 85
Nominal, Ordinal, Interval, Ratio 
Nominal scales 
•assume no quantity of the attribute. 
1 = American 
2 = Canadian 
1 is not more than 2 and 
2 is not less than 1 in this context 
1 is not more than 2 and 
2 is not less than 1 in this context 
Slide 28 of 85
Nominal, Ordinal, Interval, Ratio 
Nominal scales 
•assume no quantity of the attribute. 
•has no particular interval 
Slide 29 of 85
Nominal, Ordinal, Interval, Ratio 
Nominal scales 
•assume no quantity of the attribute. 
•has no particular interval 
1 = American 
2 = Canadian 
3 = Mexican 
1 and 2 and 3 are not equal intervals because 
there is no quantity involved. 
1 and 2 and 3 are not equal intervals because 
there is no quantity involved. 
Slide 30 of 85
Nominal, Ordinal, Interval, Ratio 
Nominal scales 
•assume no quantity of the attribute. 
•has no particular interval. 
•has no zero or starting point. 
Slide 31 of 85
Nominal, Ordinal, Interval, Ratio 
Nominal scales 
•assume no quantity of the attribute. 
•has no particular interval. 
•has no zero or starting point. 
1 = American 
2 = Canadian 
3 = Mexican 
Slide 32 of 85
Nominal, Ordinal, Interval, Ratio 
Nominal scales 
•assume no quantity of the attribute. 
•has no particular interval. 
•has no zero or starting point. 
1 = American 
2 = Canadian 
3 = Mexican 
Because there is no quantity involved there is 
no such thing as a zero point (ie., complete 
absence of nationality). 
Because there is no quantity involved there is 
no such thing as a zero point (ie., complete 
absence of nationality). 
Slide 33 of 85
Nominal, Ordinal, Interval, Ratio 
Slide 34 of 85
Nominal, Ordinal, Interval, Ratio 
Ordinal scales use numbers to represent 
relative amounts of an attribute. 
Slide 35 of 85
Nominal, Ordinal, Interval, Ratio 
Ordinal scales use numbers to represent 
relative amounts of an attribute. 
Private 
1 
Corporal 
2 
Sargent 
3 
Lieutenant 
4 
Major 
5 
Colonel 
6 
General 
7 
Slide 36 of 85
Nominal, Ordinal, Interval, Ratio 
Ordinal scales use numbers to represent 
relative amounts of an attribute. 
Private 
1 
Corporal 
2 
Sargent 
3 
Lieutenant 
4 
Major 
5 
Colonel 
6 
General 
7 
Relative Amount of Authority 
Slide 37 of 85
Nominal, Ordinal, Interval, Ratio 
Ordinal scales use numbers to represent 
relative amounts of an attribute.
Nominal, Ordinal, Interval, Ratio 
Ordinal scales use numbers to represent 
relative amounts of an attribute. 
Slide 39 of 85
Nominal, Ordinal, Interval, Ratio 
Ordinal scales use numbers to represent 
relative amounts of an attribute. 
3rd 
Place 
15’ 2” 
2nd Place 
16’ 1” 
1st 
Place 
16’ 3” 
Relative in terms of PLACEMENT (1st, 2nd, & 3rd) Slide 40 of 85
Nominal, Ordinal, Interval, Ratio 
Ordinal scales use numbers to represent 
relative amounts of an attribute. 
3rd 
Place 
15’ 2” 
2nd Place 
16’ 1” 
1st 
Place 
16’ 3” 
Relative in terms of PLACEMENT (1st, 2nd, & 3rd) Slide 41 of 85
Nominal, Ordinal, Interval, Ratio 
Ordinal scales 
•assume quantity of the attribute. 
Slide 42 of 85
Nominal, Ordinal, Interval, Ratio 
Ordinal scales 
•assume quantity of the attribute. 
Lieutenant 
4 
Colonel 
6 
A colonel has more A colonel has more aauutthhoorriittyy tthhaann aa LLiieeuutteennaanntt 
Slide 43 of 85
Nominal, Ordinal, Interval, Ratio 
Ordinal scales 
•assume quantity of the attribute. 
3rd 
Place 
1st 
Place 
1st place is 1st place is hhiigghheerr tthhaann 33rdrd ppllaaccee 
Slide 44 of 85
Nominal, Ordinal, Interval, Ratio 
Ordinal scales 
•assume quantity of the attribute. 
•do not have equal intervals. 
Slide 45 of 85
Nominal, Ordinal, Interval, Ratio 
Ordinal scales 
•assume quantity of the attribute. 
•do not have equal intervals. 
3rd 
Place 
15’ 2” 
2nd 
Place 
16’ 1” 
Slide 46 of 85
Nominal, Ordinal, Interval, Ratio 
Ordinal scales 
•assume quantity of the attribute. 
•do not have equal intervals. 
3rd 
Place 
15’ 2” 
2nd 
Place 
16’ 1” 
The distance between 3rd and 2nd place (11”) is not the same 
interval as the distance between 2nd and 1st place (1”) 
Slide 47 of 85
Nominal, Ordinal, Interval, Ratio 
Ordinal scales 
•assume quantity of the attribute. 
•do not have equal intervals. 
3rd 
Place 
15’ 2” 
2nd 
Place 
16’ 1” 
1st 
Place 
16’ 3” 
Slide 48 of 85
Nominal, Ordinal, Interval, Ratio 
Ordinal scales 
•assume quantity of the attribute. 
•do not have equal intervals. 
3rd 
Place 
15’ 2” 
2nd 
Place 
16’ 1” 
1st 
Place 
16’ 3” 
The distance between 3rd and 2nd place (11”) is not the same 
interval as the distance between 2nd and 1st place (1”) 
Slide 49 of 85
Nominal, Ordinal, Interval, Ratio 
Ordinal scales 
•assume quantity of the attribute. 
•do not have equal intervals. 
A higher number 
only represents 
more of the 
attribute than a 
lower number, 
3rd 
Place 
15’ 2” 
3rd 
Place 
15’ 2” 
2nd 
Place 
16’ 1” 
2nd 
Place 
16’ 1” 
1st 
Place 
16’ 3” 
1st 
Place 
16’ 3” 
The distance between 3rd and 2nd place (11”) is not the same 
interval as the distance between 2nd and 1st place (1”) 
Slide 50 of 85
Nominal, Ordinal, Interval, Ratio 
Ordinal scales 
•assume quantity of the attribute. 
•do not have equal intervals. 
3rd 
Place 
15’ 2” 
3rd 
Place 
15’ 2” 
. . . but how 
much more is 
undefined. 
2nd 
Place 
16’ 1” 
2nd 
Place 
16’ 1” 
1st 
Place 
16’ 3” 
1st 
Place 
16’ 3” 
The distance between 3rd and 2nd place (11”) is not the same 
interval as the distance between 2nd and 1st place (1”) 
Slide 51 of 85
Nominal, Ordinal, Interval, Ratio 
Ordinal scales 
•assume quantity of the attribute. 
•do not have equal intervals. 
3rd 
Place 
15’ 2” 
3rd 
Place 
15’ 2” 
2nd 
Place 
16’ 1” 
2nd 
Place 
16’ 1” 
1st 
Place 
16’ 3” 
1st 
Place 
16’ 3” 
The difference 
between points 
on the scale 
varies from 
point to point 
The distance between 3rd and 2nd place (11”) is not the same 
interval as the distance between 2nd and 1st place (1”) 
Slide 52 of 85
Nominal, Ordinal, Interval, Ratio 
Ordinal scales 
•assume quantity of the attribute. 
•do not have equal intervals. 
•may have an arbitrary zero or starting point. 
Slide 53 of 85
Nominal, Ordinal, Interval, Ratio 
Ordinal scales 
•assume quantity of the attribute. 
•do not have equal intervals. 
•may have an arbitrary zero or starting point. 
O Mostly Disagree 
O Completely Disagree 
O Completely Agree 
O Mostly Agree 
Slide 54 of 85
Nominal, Ordinal, Interval, Ratio 
Ordinal scales 
•assume quantity of the attribute. 
•do not have equal intervals. 
•may have an arbitrary zero or starting point. 
O Mostly Disagree 
O Completely Disagree 
O Completely Agree 
O Mostly Agree 
Slide 55 of 85
Nominal, Ordinal, Interval, Ratio 
Ordinal scales 
•assume quantity of the attribute. 
•do not have equal intervals. 
•may have an arbitrary zero or starting point. 
Slide 56 of 85
Nominal, Ordinal, Interval, Ratio 
Ordinal scales 
•assume quantity of the attribute. 
•do not have equal intervals. 
•may have an arbitrary zero or starting point. 
O Not at All 
O Very Little 
O Somewhat 
O Quite a Bit 
Slide 57 of 85
Nominal, Ordinal, Interval, Ratio 
Ordinal scales 
•assume quantity of the attribute. 
•do not have equal intervals. 
•may have an arbitrary zero or starting point. 
O Not at All 
O Very Little 
O Somewhat 
O Quite a Bit 
Slide 58 of 85
Nominal, Ordinal, Interval, Ratio 
Ordinal scales 
•assume quantity of the attribute. 
•do not have equal intervals. 
•may have an arbitrary zero or starting point. 
Slide 59 of 85
Nominal, Ordinal, Interval, Ratio 
Ordinal scales 
•assume quantity of the attribute. 
•do not have equal intervals. 
•may have an arbitrary zero or starting point. 
O Not Important 
O Somewhat Important 
O Slightly Important 
O Very Important 
Slide 60 of 85
Nominal, Ordinal, Interval, Ratio 
Ordinal scales 
•assume quantity of the attribute. 
•do not have equal intervals. 
•may have an arbitrary zero or starting point. 
O Not Important 
O Somewhat Important 
O Slightly Important 
O Very Important 
Slide 61 of 85
Important Point 
Slide 62 of 85
Important Point 
Numbers on an ordinal scale are limited in the 
information they carry (i.e., no equal intervals, 
no zero point) 
Slide 63 of 85
Interesting Note 
Slide 64 of 85
Interesting Note 
Technically, numbers on an ordinal scale cannot 
be added or subtracted. 
Slide 65 of 85
Interesting Note 
Technically, numbers on an ordinal scale cannot 
be added or subtracted. 
(but we frequently do it anyway !) 
Slide 66 of 85
Ordinal Numbers in a Data Set 
Slide 67 of 85
Ordinal Numbers in a Data Set 
Data Set 
Student Nationality Place Test 
Scores 
1 3 3 32 
2 1 5 28 
3 3 2 33 
4 2 6 27 
5 1 1 34 
6 2 4 31 
Slide 68 of 85
Ordinal Numbers in a Data Set 
Data Set 
Student Nationality Place Test 
Scores 
1 3 3 32 
2 1 5 28 
3 3 2 33 
4 2 6 27 
5 1 1 34 
6 2 4 31 
Slide 69 of 85
Ordinal Numbers in a Data Set 
Data Set 
Student Nationality Place Test 
Scores 
1 3 3 32 
2 1 5 28 
3 3 2 33 
4 2 6 27 
5 1 1 34 
6 2 4 31 
Nominal 
Slide 70 of 85
Ordinal Numbers in a Data Set 
Data Set 
Student Nationality Place Test 
Scores 
1 3 3 32 
2 1 5 28 
3 3 2 33 
4 2 6 27 
5 1 1 34 
6 2 4 31 
Nominal Ordinal 
Slide 71 of 85
Nominal, Ordinal, Interval, Ratio 
Slide 72 of 85
Nominal, Ordinal, Interval, Ratio 
Interval scales 
•assume quantity of the attribute. 
Slide 73 of 85
Nominal, Ordinal, Interval, Ratio 
Interval scales 
•assume quantity of the attribute. 
Temperature 
Slide 74 of 85
Nominal, Ordinal, Interval, Ratio 
Interval scales 
•assume quantity of the attribute. 
•have equal intervals. 
Slide 75 of 85
Nominal, Ordinal, Interval, Ratio 
Interval scales 
•assume quantity of the attribute. 
•have equal intervals. 
Slide 76 of 85
Nominal, Ordinal, Interval, Ratio 
Interval scales 
•assume quantity of the attribute. 
•have equal intervals. 
100o - 101o 
70o - 71o 
40o - 41o 
Slide 77 of 85
Nominal, Ordinal, Interval, Ratio 
Interval scales 
•assume quantity of the attribute. 
•have equal intervals. 
100o - 101o 
70o - 71o 
40o - 41o 
Each set of readings are the same 
distance apart: 1o 
Slide 78 of 85
Nominal, Ordinal, Interval, Ratio 
Interval scales 
•assume quantity of the attribute. 
•have equal intervals. 
•may have an arbitrary zero or starting point. 
Slide 79 of 85
Technically, numbers on an interval scale can be 
added and subtracted 
Slide 80 of 85
Technically, numbers on an interval scale can be 
added and subtracted 
70o 
Slide 81 of 85
Technically, numbers on an interval scale can be 
added and subtracted 
100o 
70o 
Slide 82 of 85
Technically, numbers on an interval scale can be 
added and subtracted 
100o 
70o 
100o is 30o more (+) than 70o 
Slide 83 of 85
Technically, numbers on an interval scale can be 
added and subtracted 
100o 
70o 
100o is 30o more (+) than 70o 
70o is 30o less (-) than 100o 
Slide 84 of 85
Technically, numbers on an interval scale can be 
added and subtracted but not divided and 
multiplied. 
Slide 85 of 85
Technically, numbers on an interval scale can be 
added and subtracted but not divided and 
multiplied. 
100o 
50o 
Slide 86 of 85
Technically, numbers on an interval scale can be 
added and subtracted but not divided and 
multiplied. 
100o 
100o is NOT twice (x) as hot as 50o 
And 50o is NOT half (/) as hot as 100o 50o 
Slide 87 of 85
Technically, numbers on an interval scale can be 
added and subtracted but not divided and 
multiplied. 
But many do so 
anyways  
110000o o 
But 100o is NOT twice (x) as hot as 50o 
And 50o is NOT half (/) as hot as 100o 5500oo 
Slide 88 of 85
Interval Numbers in a Data Set 
Slide 89 of 85
Interval Numbers in a Data Set 
Data Set 
Student Nationality Place Test 
Scores 
1 3 3 32 
2 1 5 28 
3 3 2 33 
4 2 6 27 
5 1 1 34 
6 2 4 31 
Slide 90 of 85
Interval Numbers in a Data Set 
Data Set 
Student Nationality Place Test 
Scores 
1 3 3 32 
2 1 5 28 
3 3 2 33 
4 2 6 27 
5 1 1 34 
6 2 4 31 
Nominal Ordinal Interval 
Slide 91 of 85
Interval Numbers in a Data Set 
Data Set 
Student Nationality Place Test 
Scores 
1 3 3 32 
2 1 5 28 
3 3 2 33 
4 2 6 27 
5 1 1 34 
6 2 4 31 
Nominal Ordinal Interval 
Slide 92 of 85
Nominal, Ordinal, Interval, Ratio 
Slide 93 of 85
Nominal, Ordinal, Interval, Ratio 
Ratio scales 
•assume quantity of the attribute. 
Slide 94 of 85
Nominal, Ordinal, Interval, Ratio 
Ratio scales 
•assume quantity of the attribute. 
Slide 95 of 85
Nominal, Ordinal, Interval, Ratio 
Ratio scales 
•assume quantity of the attribute. 
5’3” 5’10” 6’4” 6’5” 5’11” 5’4” 
Slide 96 of 85
Nominal, Ordinal, Interval, Ratio 
Ratio scales 
•assume quantity of the attribute. 
•have equal intervals. 
5’3” 5’10” 6’4” 6’5” 5’11” 5’4” 
Slide 97 of 85
Nominal, Ordinal, Interval, Ratio 
Ratio scales 
•assume quantity of the attribute. 
•have equal intervals. 
5’3” 5’10” 6’4” 6’5” 5’11” 5’4” 
Every inch represents a unit of measure that is the 
same across all inches Slide 98 of 85 
same across all inches
Nominal, Ordinal, Interval, Ratio 
Ratio scales 
•assume quantity of the attribute. 
•have equal intervals. 
5’3” 5’10” 6’4” 6’5” 5’11” 5’4” 
With the interval nature of the data, you can say that player 4 
(blue team) is 6 inches taller than Player 19 (yellow teaSmlide) 99 of 85 
With the interval nature of the data, you can say that player 4 
(blue team) is 6 inches taller than Player 19 (yellow team)
Nominal, Ordinal, Interval, Ratio 
Ratio scales 
•assume quantity of the attribute. 
•have equal intervals. 
•has a zero or starting point. 
5’3” 5’10” 6’4” 6’5” 5’11” 5’4” 
With a zero starting point (0’0”) you can say that 
player 6 (blue team) is 4/5 the size of player 4 (blue 
With a zero starting point (0’0”) you can say that 
player 6 (blue team) is 4/5 the size of player 4 (blue 
team) 
team) 
Slide 100 of 85
Ratio Numbers in a Data Set 
Slide 101 of 85
Ratio Numbers in a Data Set 
Data Set 
Student Nationality Place Test 
Scores 
Height 
1 3 3 32 5’2” 
2 1 5 28 6’3” 
3 3 2 33 6’0” 
4 2 6 27 5’8” 
5 1 1 34 6’1” 
6 2 4 31 5’5” 
Nominal Ordinal Interval 
Slide 102 of 85
Ratio Numbers in a Data Set 
Data Set 
Student Nationality Place Test 
Scores 
Height 
1 3 3 32 5’2” 
2 1 5 28 6’3” 
3 3 2 33 6’0” 
4 2 6 27 5’8” 
5 1 1 34 6’1” 
6 2 4 31 5’5” 
Nominal Ordinal Interval Ratio 
Slide 103 of 85
Important Point 
Slide 104 of 85
Important Point 
Numbers on a ratio scale 
•carry more information than the same numbers 
on an interval or ordinal scale. 
•can be 
– added, 
– subtracted, 
– multiplied, or 
– divided. 
Slide 105 of 85
Important Point 
Numbers on a ratio scale 
•carry more information than the same numbers 
on an interval or ordinal scale. 
Slide 106 of 85
Important Point 
Numbers on a ratio scale 
•carry more information than the same numbers 
on an interval or ordinal scale. 
•can be 
– added, 
– subtracted, 
– multiplied, or 
– divided. 
Slide 107 of 85
Two more Important Points 
Slide 108 of 85
Two more Important Points 
1. More adequate scales can be easily 
converted to less adequate scales. 
Ratio - - - > Interval - - - > Ordinal - - - > Nominal 
2. Most statistical programs will treat interval 
and ratio data the same. 
Slide 109 of 85
Two more Important Points 
1. More adequate scales can be easily 
converted to less adequate scales. 
Ratio - - - > Interval - - - > Ordinal - - - > Nominal 
2. Most statistical programs will treat interval 
and ratio data the same. 
Slide 110 of 85
ASSESSMENT AND ANALYSIS 
Slide 111 of 85
Assessment and Analysis… 
The type of assessment measures determinants 
both the extent to which the data can be 
compared and the type of statistical analyses 
that can ba applied to these comparisons. 
Slide 112 of 85
Metric measures 
• Allow the full range of mathematical procedures to 
be applied. 
• These categories are measured by the percent that 
complete the task, how long it takes to complete the 
tasks, ratios of success to failure to complete the 
task, time spent on errors, the number of errors, 
rating scale of satisfactions, number of times user 
seems frustrated, etc 
Slide 113 of 85
• Metric measure 
Slide 114 of 85
Non-Metric Measure 
• Non Metric variables are intrinsic 
Slide 115 of 85
Slide 116 of 85
• Metric variables have numbers associated 
with them. For example: Team Members in a 
Call Center can be evaluated by how many 
calls they take per day. How many minutes 
they spend on average on those calls. The 
difficulty level of the calls they took, etc. Non 
Metric variables are intrinsic. The weather can 
affect an outdoor wedding, that is a non 
metric variable. In the record business, the 
non metric variable of illegal downloads 
affects the bottom line for the record 
producer. In this case the number of 
downloads is an unknown. Slide 117 of 85
Methods of Statistical Analysis 
Parametric 
o Parametric methods deal with the estimation of 
population parameters (like the mean). 
Non-parametric 
o non-parametric are distribution free methods. 
They rely on ordering (ranking) of observations. 
Slide 118 of 85
If data is normally distributed then you can 
apply parametric tests that compare the 
means among the groups and if data is not 
normally distributed then you can apply non 
parametric test that compare the median 
among the groups. 
Slide 119 of 85
“Unfamiliar Words” 
• Statistical Analyses 
• Metric Data 
• Data Analysis 
• Variables – The characteristic that is being 
studied. 
• Inferential Techniques 
Slide 120 of 85
• Interval Point 
• Histogram 
• Scattergram 
• Probability 
• Correlation Matrix 
Slide 121 of 85
What is (M) 
• “M” is means “means of data, scores” 
• expresses the mean difference between two 
groups in standard deviation units. 
• Is a qualitative measure describing the 
characteristic of a population and therefore, it 
is a parameter. 
Slide 122 of 85
Formula: 
Slide 123 of 85 
Means formula
What is (SD) 
• means Standard Deviation 
• is a widely used measurement of variability or 
diversity used instatistics and probability 
theory. It shows how much variation or 
"dispersion" there is from the "average" 
(mean, or expected/budgeted value). 
• standard deviation of a statistical population, 
data set, orprobability distribution is 
the square root of its variance. 
Slide 124 of 85
Formula: 
Standard Deviation formula 
Slide 125 of 85
Correlation and Regression 
Analysis 
• Correlation and regression analysis are 
related in the sense that both deal with 
relationships among variables. 
The correlation coefficient is a measure of 
linear association between two variables. 
Values of thecorrelation coefficient are 
always between -1 and +1. 
Slide 126 of 85
Chi-square Statistic 
• A measurement of how expectations compare 
to results. The data used in calculating a chi 
square statistic must be random, raw, 
mutually exclusive, drawn from independent 
variables and be drawn from a large enough 
sample. 
• A statistical test used to compare expected 
data with what we collected.(collected vs. 
expected no.s) 
Slide 127 of 85
Formula: 
chi-square formula 
Slide 128 of 85
Thank You 
for 
Listening 
 
Slide 129 of 85

p4 statistic no.0001709

  • 1.
    Numbers, Measurement and Numerical Relationships
  • 2.
    In quantitative research,dependent, independent and relevant variables are describe in numeral form. Some variables may be easily defined or measured; other are more abstract and difficult to define. Slide 2 of 85
  • 3.
    In quantitative research,dependent, independent and relevant variables are describe in numeral form. Some variables may be easily defined or measured; other are more abstract and difficult to define. Slide 3 of 85
  • 4.
    Different measurement usethe same numerals (i.e., 1, 2, 3, 4 . . .) But, the numerals carry different information and carry different information and symbolize different phenomena across scales (i.e., 1 = Catholic, 2 = Mormon . . . or 1 = Agree, 2 = Disagree, or 1 = correct, 0 = incorrect) Slide 4 of 85
  • 5.
    Different measurement usethe same numerals (i.e., 1, 2, 3, 4 . . .) But, the numerals carry different information and carry different information and symbolize different phenomena across scales (i.e., 1 = Catholic, 2 = Mormon . . . or 1 = Agree, 2 = Disagree, or 1 = correct, 0 = incorrect) Slide 5 of 85
  • 6.
    Different measurement usethe same numerals (i.e., 1, 2, 3, 4 . . .) But, the numerals carry different information and symbolize different phenomena across scales (i.e., 1 = Catholic, 2 = Mormon . . . or 1 = Agree, 2 = Disagree, or 1 = correct, 0 = incorrect) Slide 6 of 85
  • 7.
    Different scales ofmeasurement use the same numerals (i.e., 1, 2, 3, 4 . . .) But, the numerals carry different information and symbolize different phenomena across scales EX: •1 = Catholic, 2 = Mormon . . . •1 = Agree, 2 = Disagree •1 = correct, 0 = incorrect Slide 7 of 85
  • 8.
    Different scales ofmeasurement use the same numerals (i.e., 1, 2, 3, 4 . . .) But, the numerals carry different information and symbolize different phenomena across scales (i.e., •1 = Catholic, 2 = Mormon . . . •1 = Agree, 2 = Disagree •1 = correct, 0 = incorrect Slide 8 of 85
  • 9.
    Different scales ofmeasurement use the same numerals (i.e., 1, 2, 3, 4 . . .) But, the numerals carry different information and symbolize different phenomena across scales (i.e., •1 = Catholic, 2 = Mormon . . . •1 = Agree, 2 = Disagree •1 = correct, 0 = incorrect Slide 9 of 85
  • 10.
    The Four MainTypes of Measurement they are: Nominal (1 = Male, 2 = Female) Ordinal (1 = Private, 2 = Sergeant, 3 = Lieutenant . . .) Interval (30OF, 40OF, 50O . . .) Ratio (0 meters, 10 meters, 100 meters . . .) Slide 10 of 85
  • 11.
    •Nominal (1 =Male, 2 = Female) •Ordinal (1 = Private, 2 = Sergeant, 3 = Lieutenant . . .) •Interval (30OF, 40OF, 50O . . .) •Ratio (0 meters, 10 meters, 100 meters . . .) Slide 11 of 85
  • 12.
    Nominal (1 =Male, 2 = Female) Ordinal (1 = Private, 2 = Sergeant, 3 = Lieutenant . . .) Interval (30OF, 40OF, 50O . . .) Ratio (0 meters, 10 meters, 100 meters . . .) Slide 12 of 85
  • 13.
    Nominal (1 =Male, 2 = Female) Ordinal (1 = Private, 2 = Sergeant, 3 = Lieutenant . . .) Interval (30OF, 40OF, 50O . . .) Ratio (0 meters, 10 meters, 100 meters . . .) Slide 13 of 85
  • 14.
    Nominal (1 =Male, 2 = Female) Ordinal (1 = Private, 2 = Sergeant, 3 = Lieutenant ) Interval (30OF, 40OF, 50O . . .) Ratio (0 meters, 10 meters, 100 meters . . .) Slide 14 of 85
  • 15.
    Nominal, Ordinal, Interval,Ratio Slide 15 of 85
  • 16.
    Nominal, Ordinal, Interval,Ratio Nominal scales use numbers as replacements for names. Slide 16 of 85
  • 17.
    Nominal, Ordinal, Interval,Ratio Nominal scales use numbers as replacements for names. 1 = American Slide 17 of 85
  • 18.
    Nominal, Ordinal, Interval,Ratio Nominal scales use numbers as replacements for names. 1 = American 2 = Canadian Slide 18 of 85
  • 19.
    Nominal, Ordinal, Interval,Ratio Nominal scales use numbers as replacements for names. 1 = American 2 = Canadian 3 = Mexican Slide 19 of 85
  • 20.
    Nominal, Ordinal, Interval,Ratio Nominal scales use numbers as replacements for names. 1 = American 2 = Canadian 3 = Mexican Data Set Slide 20 of 85
  • 21.
    Nominal, Ordinal, Interval,Ratio Nominal scales use numbers as replacements for names. 1 = American 2 = Canadian 3 = Mexican Data Set Slide 21 of 85
  • 22.
    Nominal, Ordinal, Interval,Ratio Nominal scales use numbers as replacements for names. 1 = American 2 = Canadian 3 = Mexican Data Set Slide 22 of 85
  • 23.
    Nominal Nominal scalesuse numbers as replacements for names. 1 = American 2 = Canadian 3 = Mexican Data Set Slide 23 of 85
  • 24.
    Nominal, Ordinal, Interval,Ratio Nominal scales use numbers as replacements for names. 1 = American 2 = Canadian 3 = Mexican Data Set Slide 24 of 85
  • 25.
    Nominal, Ordinal, Interval,Ratio The root of the term “nominal” is “nom” meaning “name”. Slide 25 of 85
  • 26.
    Nominal, Ordinal, Interval,Ratio Nominal scales •assume no quantity of the attribute. Slide 26 of 85
  • 27.
    Nominal, Ordinal, Interval,Ratio Nominal scales •assume no quantity of the attribute. 1 = American 2 = Canadian Slide 27 of 85
  • 28.
    Nominal, Ordinal, Interval,Ratio Nominal scales •assume no quantity of the attribute. 1 = American 2 = Canadian 1 is not more than 2 and 2 is not less than 1 in this context 1 is not more than 2 and 2 is not less than 1 in this context Slide 28 of 85
  • 29.
    Nominal, Ordinal, Interval,Ratio Nominal scales •assume no quantity of the attribute. •has no particular interval Slide 29 of 85
  • 30.
    Nominal, Ordinal, Interval,Ratio Nominal scales •assume no quantity of the attribute. •has no particular interval 1 = American 2 = Canadian 3 = Mexican 1 and 2 and 3 are not equal intervals because there is no quantity involved. 1 and 2 and 3 are not equal intervals because there is no quantity involved. Slide 30 of 85
  • 31.
    Nominal, Ordinal, Interval,Ratio Nominal scales •assume no quantity of the attribute. •has no particular interval. •has no zero or starting point. Slide 31 of 85
  • 32.
    Nominal, Ordinal, Interval,Ratio Nominal scales •assume no quantity of the attribute. •has no particular interval. •has no zero or starting point. 1 = American 2 = Canadian 3 = Mexican Slide 32 of 85
  • 33.
    Nominal, Ordinal, Interval,Ratio Nominal scales •assume no quantity of the attribute. •has no particular interval. •has no zero or starting point. 1 = American 2 = Canadian 3 = Mexican Because there is no quantity involved there is no such thing as a zero point (ie., complete absence of nationality). Because there is no quantity involved there is no such thing as a zero point (ie., complete absence of nationality). Slide 33 of 85
  • 34.
    Nominal, Ordinal, Interval,Ratio Slide 34 of 85
  • 35.
    Nominal, Ordinal, Interval,Ratio Ordinal scales use numbers to represent relative amounts of an attribute. Slide 35 of 85
  • 36.
    Nominal, Ordinal, Interval,Ratio Ordinal scales use numbers to represent relative amounts of an attribute. Private 1 Corporal 2 Sargent 3 Lieutenant 4 Major 5 Colonel 6 General 7 Slide 36 of 85
  • 37.
    Nominal, Ordinal, Interval,Ratio Ordinal scales use numbers to represent relative amounts of an attribute. Private 1 Corporal 2 Sargent 3 Lieutenant 4 Major 5 Colonel 6 General 7 Relative Amount of Authority Slide 37 of 85
  • 38.
    Nominal, Ordinal, Interval,Ratio Ordinal scales use numbers to represent relative amounts of an attribute.
  • 39.
    Nominal, Ordinal, Interval,Ratio Ordinal scales use numbers to represent relative amounts of an attribute. Slide 39 of 85
  • 40.
    Nominal, Ordinal, Interval,Ratio Ordinal scales use numbers to represent relative amounts of an attribute. 3rd Place 15’ 2” 2nd Place 16’ 1” 1st Place 16’ 3” Relative in terms of PLACEMENT (1st, 2nd, & 3rd) Slide 40 of 85
  • 41.
    Nominal, Ordinal, Interval,Ratio Ordinal scales use numbers to represent relative amounts of an attribute. 3rd Place 15’ 2” 2nd Place 16’ 1” 1st Place 16’ 3” Relative in terms of PLACEMENT (1st, 2nd, & 3rd) Slide 41 of 85
  • 42.
    Nominal, Ordinal, Interval,Ratio Ordinal scales •assume quantity of the attribute. Slide 42 of 85
  • 43.
    Nominal, Ordinal, Interval,Ratio Ordinal scales •assume quantity of the attribute. Lieutenant 4 Colonel 6 A colonel has more A colonel has more aauutthhoorriittyy tthhaann aa LLiieeuutteennaanntt Slide 43 of 85
  • 44.
    Nominal, Ordinal, Interval,Ratio Ordinal scales •assume quantity of the attribute. 3rd Place 1st Place 1st place is 1st place is hhiigghheerr tthhaann 33rdrd ppllaaccee Slide 44 of 85
  • 45.
    Nominal, Ordinal, Interval,Ratio Ordinal scales •assume quantity of the attribute. •do not have equal intervals. Slide 45 of 85
  • 46.
    Nominal, Ordinal, Interval,Ratio Ordinal scales •assume quantity of the attribute. •do not have equal intervals. 3rd Place 15’ 2” 2nd Place 16’ 1” Slide 46 of 85
  • 47.
    Nominal, Ordinal, Interval,Ratio Ordinal scales •assume quantity of the attribute. •do not have equal intervals. 3rd Place 15’ 2” 2nd Place 16’ 1” The distance between 3rd and 2nd place (11”) is not the same The distance between 3rd and 2nd place (11”) is not the same interval as the distance between 2nd and 1st place (1”) interval as the distance between 2nd and 1st place (1”) Slide 47 of 85
  • 48.
    Nominal, Ordinal, Interval,Ratio Ordinal scales •assume quantity of the attribute. •do not have equal intervals. 3rd Place 15’ 2” 2nd Place 16’ 1” 1st Place 16’ 3” Slide 48 of 85
  • 49.
    Nominal, Ordinal, Interval,Ratio Ordinal scales •assume quantity of the attribute. •do not have equal intervals. 3rd Place 15’ 2” 2nd Place 16’ 1” 1st Place 16’ 3” The distance between 3rd and 2nd place (11”) is not the same The distance between 3rd and 2nd place (11”) is not the same interval as the distance between 2nd and 1st place (1”) interval as the distance between 2nd and 1st place (1”) Slide 49 of 85
  • 50.
    Nominal, Ordinal, Interval,Ratio Ordinal scales •assume quantity of the attribute. •do not have equal intervals. A higher number only represents more of the attribute than a lower number, 3rd Place 15’ 2” 3rd Place 15’ 2” 2nd Place 16’ 1” 2nd Place 16’ 1” 1st Place 16’ 3” 1st Place 16’ 3” The distance between 3rd and 2nd place (11”) is not the same The distance between 3rd and 2nd place (11”) is not the same interval as the distance between 2nd and 1st place (1”) interval as the distance between 2nd and 1st place (1”) Slide 50 of 85
  • 51.
    Nominal, Ordinal, Interval,Ratio Ordinal scales •assume quantity of the attribute. •do not have equal intervals. 3rd Place 15’ 2” 3rd Place 15’ 2” . . . but how much more is undefined. 2nd Place 16’ 1” 2nd Place 16’ 1” 1st Place 16’ 3” 1st Place 16’ 3” The distance between 3rd and 2nd place (11”) is not the same The distance between 3rd and 2nd place (11”) is not the same interval as the distance between 2nd and 1st place (1”) interval as the distance between 2nd and 1st place (1”) Slide 51 of 85
  • 52.
    Nominal, Ordinal, Interval,Ratio Ordinal scales •assume quantity of the attribute. •do not have equal intervals. 3rd Place 15’ 2” 3rd Place 15’ 2” 2nd Place 16’ 1” 2nd Place 16’ 1” 1st Place 16’ 3” 1st Place 16’ 3” The difference between points on the scale varies from point to point The distance between 3rd and 2nd place (11”) is not the same The distance between 3rd and 2nd place (11”) is not the same interval as the distance between 2nd and 1st place (1”) interval as the distance between 2nd and 1st place (1”) Slide 52 of 85
  • 53.
    Nominal, Ordinal, Interval,Ratio Ordinal scales •assume quantity of the attribute. •do not have equal intervals. •may have an arbitrary zero or starting point. Slide 53 of 85
  • 54.
    Nominal, Ordinal, Interval,Ratio Ordinal scales •assume quantity of the attribute. •do not have equal intervals. •may have an arbitrary zero or starting point. O Mostly Disagree O Completely Disagree O Completely Agree O Mostly Agree Slide 54 of 85
  • 55.
    Nominal, Ordinal, Interval,Ratio Ordinal scales •assume quantity of the attribute. •do not have equal intervals. •may have an arbitrary zero or starting point. O Mostly Disagree O Completely Disagree O Completely Agree O Mostly Agree Slide 55 of 85
  • 56.
    Nominal, Ordinal, Interval,Ratio Ordinal scales •assume quantity of the attribute. •do not have equal intervals. •may have an arbitrary zero or starting point. Slide 56 of 85
  • 57.
    Nominal, Ordinal, Interval,Ratio Ordinal scales •assume quantity of the attribute. •do not have equal intervals. •may have an arbitrary zero or starting point. O Not at All O Very Little O Somewhat O Quite a Bit Slide 57 of 85
  • 58.
    Nominal, Ordinal, Interval,Ratio Ordinal scales •assume quantity of the attribute. •do not have equal intervals. •may have an arbitrary zero or starting point. O Not at All O Very Little O Somewhat O Quite a Bit Slide 58 of 85
  • 59.
    Nominal, Ordinal, Interval,Ratio Ordinal scales •assume quantity of the attribute. •do not have equal intervals. •may have an arbitrary zero or starting point. Slide 59 of 85
  • 60.
    Nominal, Ordinal, Interval,Ratio Ordinal scales •assume quantity of the attribute. •do not have equal intervals. •may have an arbitrary zero or starting point. O Not Important O Somewhat Important O Slightly Important O Very Important Slide 60 of 85
  • 61.
    Nominal, Ordinal, Interval,Ratio Ordinal scales •assume quantity of the attribute. •do not have equal intervals. •may have an arbitrary zero or starting point. O Not Important O Somewhat Important O Slightly Important O Very Important Slide 61 of 85
  • 62.
  • 63.
    Important Point Numberson an ordinal scale are limited in the information they carry (i.e., no equal intervals, no zero point) Slide 63 of 85
  • 64.
  • 65.
    Interesting Note Technically,numbers on an ordinal scale cannot be added or subtracted. Slide 65 of 85
  • 66.
    Interesting Note Technically,numbers on an ordinal scale cannot be added or subtracted. (but we frequently do it anyway !) Slide 66 of 85
  • 67.
    Ordinal Numbers ina Data Set Slide 67 of 85
  • 68.
    Ordinal Numbers ina Data Set Data Set Student Nationality Place Test Scores 1 3 3 32 2 1 5 28 3 3 2 33 4 2 6 27 5 1 1 34 6 2 4 31 Slide 68 of 85
  • 69.
    Ordinal Numbers ina Data Set Data Set Student Nationality Place Test Scores 1 3 3 32 2 1 5 28 3 3 2 33 4 2 6 27 5 1 1 34 6 2 4 31 Slide 69 of 85
  • 70.
    Ordinal Numbers ina Data Set Data Set Student Nationality Place Test Scores 1 3 3 32 2 1 5 28 3 3 2 33 4 2 6 27 5 1 1 34 6 2 4 31 Nominal Slide 70 of 85
  • 71.
    Ordinal Numbers ina Data Set Data Set Student Nationality Place Test Scores 1 3 3 32 2 1 5 28 3 3 2 33 4 2 6 27 5 1 1 34 6 2 4 31 Nominal Ordinal Slide 71 of 85
  • 72.
    Nominal, Ordinal, Interval,Ratio Slide 72 of 85
  • 73.
    Nominal, Ordinal, Interval,Ratio Interval scales •assume quantity of the attribute. Slide 73 of 85
  • 74.
    Nominal, Ordinal, Interval,Ratio Interval scales •assume quantity of the attribute. Temperature Slide 74 of 85
  • 75.
    Nominal, Ordinal, Interval,Ratio Interval scales •assume quantity of the attribute. •have equal intervals. Slide 75 of 85
  • 76.
    Nominal, Ordinal, Interval,Ratio Interval scales •assume quantity of the attribute. •have equal intervals. Slide 76 of 85
  • 77.
    Nominal, Ordinal, Interval,Ratio Interval scales •assume quantity of the attribute. •have equal intervals. 100o - 101o 70o - 71o 40o - 41o Slide 77 of 85
  • 78.
    Nominal, Ordinal, Interval,Ratio Interval scales •assume quantity of the attribute. •have equal intervals. 100o - 101o 70o - 71o 40o - 41o Each set of readings are the same distance apart: 1o Slide 78 of 85
  • 79.
    Nominal, Ordinal, Interval,Ratio Interval scales •assume quantity of the attribute. •have equal intervals. •may have an arbitrary zero or starting point. Slide 79 of 85
  • 80.
    Technically, numbers onan interval scale can be added and subtracted Slide 80 of 85
  • 81.
    Technically, numbers onan interval scale can be added and subtracted 70o Slide 81 of 85
  • 82.
    Technically, numbers onan interval scale can be added and subtracted 100o 70o Slide 82 of 85
  • 83.
    Technically, numbers onan interval scale can be added and subtracted 100o 70o 100o is 30o more (+) than 70o Slide 83 of 85
  • 84.
    Technically, numbers onan interval scale can be added and subtracted 100o 70o 100o is 30o more (+) than 70o 70o is 30o less (-) than 100o Slide 84 of 85
  • 85.
    Technically, numbers onan interval scale can be added and subtracted but not divided and multiplied. Slide 85 of 85
  • 86.
    Technically, numbers onan interval scale can be added and subtracted but not divided and multiplied. 100o 50o Slide 86 of 85
  • 87.
    Technically, numbers onan interval scale can be added and subtracted but not divided and multiplied. 100o 100o is NOT twice (x) as hot as 50o And 50o is NOT half (/) as hot as 100o 50o Slide 87 of 85
  • 88.
    Technically, numbers onan interval scale can be added and subtracted but not divided and multiplied. But many do so anyways  110000o o But 100o is NOT twice (x) as hot as 50o And 50o is NOT half (/) as hot as 100o 5500oo Slide 88 of 85
  • 89.
    Interval Numbers ina Data Set Slide 89 of 85
  • 90.
    Interval Numbers ina Data Set Data Set Student Nationality Place Test Scores 1 3 3 32 2 1 5 28 3 3 2 33 4 2 6 27 5 1 1 34 6 2 4 31 Slide 90 of 85
  • 91.
    Interval Numbers ina Data Set Data Set Student Nationality Place Test Scores 1 3 3 32 2 1 5 28 3 3 2 33 4 2 6 27 5 1 1 34 6 2 4 31 Nominal Ordinal Interval Slide 91 of 85
  • 92.
    Interval Numbers ina Data Set Data Set Student Nationality Place Test Scores 1 3 3 32 2 1 5 28 3 3 2 33 4 2 6 27 5 1 1 34 6 2 4 31 Nominal Ordinal Interval Slide 92 of 85
  • 93.
    Nominal, Ordinal, Interval,Ratio Slide 93 of 85
  • 94.
    Nominal, Ordinal, Interval,Ratio Ratio scales •assume quantity of the attribute. Slide 94 of 85
  • 95.
    Nominal, Ordinal, Interval,Ratio Ratio scales •assume quantity of the attribute. Slide 95 of 85
  • 96.
    Nominal, Ordinal, Interval,Ratio Ratio scales •assume quantity of the attribute. 5’3” 5’10” 6’4” 6’5” 5’11” 5’4” Slide 96 of 85
  • 97.
    Nominal, Ordinal, Interval,Ratio Ratio scales •assume quantity of the attribute. •have equal intervals. 5’3” 5’10” 6’4” 6’5” 5’11” 5’4” Slide 97 of 85
  • 98.
    Nominal, Ordinal, Interval,Ratio Ratio scales •assume quantity of the attribute. •have equal intervals. 5’3” 5’10” 6’4” 6’5” 5’11” 5’4” Every inch represents a unit of measure that is the Every inch represents a unit of measure that is the same across all inches Slide 98 of 85 same across all inches
  • 99.
    Nominal, Ordinal, Interval,Ratio Ratio scales •assume quantity of the attribute. •have equal intervals. 5’3” 5’10” 6’4” 6’5” 5’11” 5’4” With the interval nature of the data, you can say that player 4 (blue team) is 6 inches taller than Player 19 (yellow teaSmlide) 99 of 85 With the interval nature of the data, you can say that player 4 (blue team) is 6 inches taller than Player 19 (yellow team)
  • 100.
    Nominal, Ordinal, Interval,Ratio Ratio scales •assume quantity of the attribute. •have equal intervals. •has a zero or starting point. 5’3” 5’10” 6’4” 6’5” 5’11” 5’4” With a zero starting point (0’0”) you can say that player 6 (blue team) is 4/5 the size of player 4 (blue With a zero starting point (0’0”) you can say that player 6 (blue team) is 4/5 the size of player 4 (blue team) team) Slide 100 of 85
  • 101.
    Ratio Numbers ina Data Set Slide 101 of 85
  • 102.
    Ratio Numbers ina Data Set Data Set Student Nationality Place Test Scores Height 1 3 3 32 5’2” 2 1 5 28 6’3” 3 3 2 33 6’0” 4 2 6 27 5’8” 5 1 1 34 6’1” 6 2 4 31 5’5” Nominal Ordinal Interval Slide 102 of 85
  • 103.
    Ratio Numbers ina Data Set Data Set Student Nationality Place Test Scores Height 1 3 3 32 5’2” 2 1 5 28 6’3” 3 3 2 33 6’0” 4 2 6 27 5’8” 5 1 1 34 6’1” 6 2 4 31 5’5” Nominal Ordinal Interval Ratio Slide 103 of 85
  • 104.
  • 105.
    Important Point Numberson a ratio scale •carry more information than the same numbers on an interval or ordinal scale. •can be – added, – subtracted, – multiplied, or – divided. Slide 105 of 85
  • 106.
    Important Point Numberson a ratio scale •carry more information than the same numbers on an interval or ordinal scale. Slide 106 of 85
  • 107.
    Important Point Numberson a ratio scale •carry more information than the same numbers on an interval or ordinal scale. •can be – added, – subtracted, – multiplied, or – divided. Slide 107 of 85
  • 108.
    Two more ImportantPoints Slide 108 of 85
  • 109.
    Two more ImportantPoints 1. More adequate scales can be easily converted to less adequate scales. Ratio - - - > Interval - - - > Ordinal - - - > Nominal 2. Most statistical programs will treat interval and ratio data the same. Slide 109 of 85
  • 110.
    Two more ImportantPoints 1. More adequate scales can be easily converted to less adequate scales. Ratio - - - > Interval - - - > Ordinal - - - > Nominal 2. Most statistical programs will treat interval and ratio data the same. Slide 110 of 85
  • 111.
    ASSESSMENT AND ANALYSIS Slide 111 of 85
  • 112.
    Assessment and Analysis… The type of assessment measures determinants both the extent to which the data can be compared and the type of statistical analyses that can ba applied to these comparisons. Slide 112 of 85
  • 113.
    Metric measures •Allow the full range of mathematical procedures to be applied. • These categories are measured by the percent that complete the task, how long it takes to complete the tasks, ratios of success to failure to complete the task, time spent on errors, the number of errors, rating scale of satisfactions, number of times user seems frustrated, etc Slide 113 of 85
  • 114.
    • Metric measure Slide 114 of 85
  • 115.
    Non-Metric Measure •Non Metric variables are intrinsic Slide 115 of 85
  • 116.
  • 117.
    • Metric variableshave numbers associated with them. For example: Team Members in a Call Center can be evaluated by how many calls they take per day. How many minutes they spend on average on those calls. The difficulty level of the calls they took, etc. Non Metric variables are intrinsic. The weather can affect an outdoor wedding, that is a non metric variable. In the record business, the non metric variable of illegal downloads affects the bottom line for the record producer. In this case the number of downloads is an unknown. Slide 117 of 85
  • 118.
    Methods of StatisticalAnalysis Parametric o Parametric methods deal with the estimation of population parameters (like the mean). Non-parametric o non-parametric are distribution free methods. They rely on ordering (ranking) of observations. Slide 118 of 85
  • 119.
    If data isnormally distributed then you can apply parametric tests that compare the means among the groups and if data is not normally distributed then you can apply non parametric test that compare the median among the groups. Slide 119 of 85
  • 120.
    “Unfamiliar Words” •Statistical Analyses • Metric Data • Data Analysis • Variables – The characteristic that is being studied. • Inferential Techniques Slide 120 of 85
  • 121.
    • Interval Point • Histogram • Scattergram • Probability • Correlation Matrix Slide 121 of 85
  • 122.
    What is (M) • “M” is means “means of data, scores” • expresses the mean difference between two groups in standard deviation units. • Is a qualitative measure describing the characteristic of a population and therefore, it is a parameter. Slide 122 of 85
  • 123.
    Formula: Slide 123of 85 Means formula
  • 124.
    What is (SD) • means Standard Deviation • is a widely used measurement of variability or diversity used instatistics and probability theory. It shows how much variation or "dispersion" there is from the "average" (mean, or expected/budgeted value). • standard deviation of a statistical population, data set, orprobability distribution is the square root of its variance. Slide 124 of 85
  • 125.
    Formula: Standard Deviationformula Slide 125 of 85
  • 126.
    Correlation and Regression Analysis • Correlation and regression analysis are related in the sense that both deal with relationships among variables. The correlation coefficient is a measure of linear association between two variables. Values of thecorrelation coefficient are always between -1 and +1. Slide 126 of 85
  • 127.
    Chi-square Statistic •A measurement of how expectations compare to results. The data used in calculating a chi square statistic must be random, raw, mutually exclusive, drawn from independent variables and be drawn from a large enough sample. • A statistical test used to compare expected data with what we collected.(collected vs. expected no.s) Slide 127 of 85
  • 128.
  • 129.
    Thank You for Listening  Slide 129 of 85

Editor's Notes

  • #73 Temperature, Dates (data that has has an arbitrary zero) The boiling temperatures of different liquids are listed. This is an example of interval level data. We can tell whether a temperature is higher or lower than another, so we can put them in an order. Also, if water boils at 212 degrees and another liquid boils at 284 degrees, the second temperature is 72 degrees higher than the first. So the differences between data are measurable and meaningful.
  • #74 Temperature, Dates (data that has has an arbitrary zero) The boiling temperatures of different liquids are listed. This is an example of interval level data. We can tell whether a temperature is higher or lower than another, so we can put them in an order. Also, if water boils at 212 degrees and another liquid boils at 284 degrees, the second temperature is 72 degrees higher than the first. So the differences between data are measurable and meaningful.
  • #75 Temperature, Dates (data that has has an arbitrary zero) The boiling temperatures of different liquids are listed. This is an example of interval level data. We can tell whether a temperature is higher or lower than another, so we can put them in an order. Also, if water boils at 212 degrees and another liquid boils at 284 degrees, the second temperature is 72 degrees higher than the first. So the differences between data are measurable and meaningful.
  • #76 Temperature, Dates (data that has has an arbitrary zero) The boiling temperatures of different liquids are listed. This is an example of interval level data. We can tell whether a temperature is higher or lower than another, so we can put them in an order. Also, if water boils at 212 degrees and another liquid boils at 284 degrees, the second temperature is 72 degrees higher than the first. So the differences between data are measurable and meaningful.
  • #77 Temperature, Dates (data that has has an arbitrary zero) The boiling temperatures of different liquids are listed. This is an example of interval level data. We can tell whether a temperature is higher or lower than another, so we can put them in an order. Also, if water boils at 212 degrees and another liquid boils at 284 degrees, the second temperature is 72 degrees higher than the first. So the differences between data are measurable and meaningful.
  • #78 Temperature, Dates (data that has has an arbitrary zero) The boiling temperatures of different liquids are listed. This is an example of interval level data. We can tell whether a temperature is higher or lower than another, so we can put them in an order. Also, if water boils at 212 degrees and another liquid boils at 284 degrees, the second temperature is 72 degrees higher than the first. So the differences between data are measurable and meaningful.
  • #79 Temperature, Dates (data that has has an arbitrary zero) The boiling temperatures of different liquids are listed. This is an example of interval level data. We can tell whether a temperature is higher or lower than another, so we can put them in an order. Also, if water boils at 212 degrees and another liquid boils at 284 degrees, the second temperature is 72 degrees higher than the first. So the differences between data are measurable and meaningful.
  • #80 he used a mixture of ice, water, and ammonium chloride, a salt, at a 1:1:1 ratio. This is a frigorific mixture which stabilizes its temperature automatically: that stable temperature
  • #94 Temperature, Dates (data that has has an arbitrary zero) The boiling temperatures of different liquids are listed. This is an example of interval level data. We can tell whether a temperature is higher or lower than another, so we can put them in an order. Also, if water boils at 212 degrees and another liquid boils at 284 degrees, the second temperature is 72 degrees higher than the first. So the differences between data are measurable and meaningful.
  • #95 Temperature, Dates (data that has has an arbitrary zero) The boiling temperatures of different liquids are listed. This is an example of interval level data. We can tell whether a temperature is higher or lower than another, so we can put them in an order. Also, if water boils at 212 degrees and another liquid boils at 284 degrees, the second temperature is 72 degrees higher than the first. So the differences between data are measurable and meaningful.
  • #96 Temperature, Dates (data that has has an arbitrary zero) The boiling temperatures of different liquids are listed. This is an example of interval level data. We can tell whether a temperature is higher or lower than another, so we can put them in an order. Also, if water boils at 212 degrees and another liquid boils at 284 degrees, the second temperature is 72 degrees higher than the first. So the differences between data are measurable and meaningful.
  • #97 Temperature, Dates (data that has has an arbitrary zero) The boiling temperatures of different liquids are listed. This is an example of interval level data. We can tell whether a temperature is higher or lower than another, so we can put them in an order. Also, if water boils at 212 degrees and another liquid boils at 284 degrees, the second temperature is 72 degrees higher than the first. So the differences between data are measurable and meaningful.
  • #98 Temperature, Dates (data that has has an arbitrary zero) The boiling temperatures of different liquids are listed. This is an example of interval level data. We can tell whether a temperature is higher or lower than another, so we can put them in an order. Also, if water boils at 212 degrees and another liquid boils at 284 degrees, the second temperature is 72 degrees higher than the first. So the differences between data are measurable and meaningful.
  • #99 Temperature, Dates (data that has has an arbitrary zero) The boiling temperatures of different liquids are listed. This is an example of interval level data. We can tell whether a temperature is higher or lower than another, so we can put them in an order. Also, if water boils at 212 degrees and another liquid boils at 284 degrees, the second temperature is 72 degrees higher than the first. So the differences between data are measurable and meaningful.
  • #100 Temperature, Dates (data that has has an arbitrary zero) The boiling temperatures of different liquids are listed. This is an example of interval level data. We can tell whether a temperature is higher or lower than another, so we can put them in an order. Also, if water boils at 212 degrees and another liquid boils at 284 degrees, the second temperature is 72 degrees higher than the first. So the differences between data are measurable and meaningful.
  • #101 Temperature, Dates (data that has has an arbitrary zero) The boiling temperatures of different liquids are listed. This is an example of interval level data. We can tell whether a temperature is higher or lower than another, so we can put them in an order. Also, if water boils at 212 degrees and another liquid boils at 284 degrees, the second temperature is 72 degrees higher than the first. So the differences between data are measurable and meaningful.