SlideShare a Scribd company logo
Patterns for Success in
Data Science Engagements
Dr. David Michel
Overview
Overview
ThoughtWorks has been expanding the quantity and depth of our data related engagements across the
EU and globally under our Intelligent Empowerment offering.
This talk will focus on lessons learned from 4 short term engagements with four different clients over the
last 18 months
● Length of engagements varied between 2 weeks - 2 months
● Commonalities/differences in necessary approach
● Themes for success
● Pitfalls to avoid
Project Summary
CLIENT 1 CLIENT 2 CLIENT 3 CLIENT 4
Web presence for South
American media conglomerate
Home recipe delivery service
offered by major UK retailer
Major UK automobile reseller Major UK retailer
Wanted to predict age/sex of
anonymous users based on
behaviour of registered users
Wanted to more accurately
predict demand for new recipes
and different combinations of
existing ones
Wanted better insight and put
themselves on the path towards
making more data driven
decisions
Wanted to determine optimum
shelf capacity for preset product
range
Existing model and infrastructure
in place
Set of heuristics in use Lots of reports and excel
spreadsheets. No modelling to
speak of
Existing tool in use. Series of
SQL queries run directly off data
warehouse
Client 1
Client 1 (Web Branch for Media Company)
● Problem clearly defined
○ Identify men/women
○ Identify men 18-35, women 25-49
● Data clearly accessible (though latency was high)
○ Jupyter sandbox with access to BigQuery data store
● Existing model in place
○ XGBoost with ~250 features
○ Updated weekly with ~2 hour training time
● Metrics in place (though likely suboptimal)
○ Accuracy in all three demos as defined by Nielsen
Client 1 (Web Branch for Media Company)
● Limited time period (5 weeks) required scaling level of
ambition and comprehensiveness of work
● Focus limited to three areas:
○ Quality of training data
○ Time period over which features were aggregated
○ Sub selection of training data to better serve usecase
● Emphasis placed on logging and reproducibility of results
Results in Six Graphs
Client 2
Client 2 (Home Recipe Box)
● Problem clearly defined
○ Better forecast demand three weeks in advance of recipe offerings (when ingredients are
ordered) to lower waste
● Data clearly accessible (and small)
○ ~35 week order history comprising ~6000 orders from ~5000 unique customers
● No model in place
○ Set of heuristics whose usefulness were visibly depreciating over time as number of recipes
and variety combinations increased
● Metrics in place (though likely suboptimal)
○ Percentage over/undershoot of prediction compared to actual orders
Client 2 (Home Recipe Box)
● Limited time period (3 weeks to deliver)
● Emphasis placed on creating functional forecasting tool and with large amounts of time
budgeted for training and handover
● Self updating forecasting/visualisation tool built in Colaboratory Notebook
○ Recipe metadata and historical sales used to retrain random forest (initial attempts with
regularised linear models were problematic) weekly with rolling 10 week windows of
historical sales
Results
● Internal forecasting for 9 weeks worth of data:
○ Mean error: 2.6%
○ Median error: 2.0%
○ Max overestimate: 10%
○ Max underestimate: 10%
● New model:
○ Mean error: 2.0%
○ Median error: 1.5%
○ Max overestimate: 7.2%
○ Max underestimate: 8.7%
Client 3
Client 3 (B2B Auto reseller)
● No real problem defined
○ Interest in sales channel allocation, but no internal agreement on desired output
● Data clearly accessible (in varying degrees of quality and latency)
○ SQL server 2008 enterprise warehouse with vehicle information
○ Refurb and auction information available only via spreadsheets downloaded from partner
portals
● No existing model in place
● Metrics for success not defined
Client 3 (B2B Auto reseller)
● 2 weeks to investigate available data and provide POC
● Lots of room to choose right/wrong problem
● Area chosen was POC for sale price forecasting based on channel and vehicle specifications
● Was thought to be the lowest hanging fruit that would allow for higher return on
investment for each asset
○ Website vs Auction
○ Optimal refurb parameters for specific vehicles
Results
Auction
Website
Refurb
Client 4
Client 4 (Major Grocer)
● Problem (reasonably) well defined
○ Investigate efficacy of current tool in use to determine shelf capacity
(given fixed product range)
● Data accessible, but not discoverable and with numerous
(often conflicting) sources of truth
● No existing model in place
○ Existing product used fixed calculation that was run via a series of SQL
queries inside data warehouse
● No metrics in use to benchmark existing product
Client 4 (Major Grocer)
● ~8 weeks to investigate
● With no metric to evaluate existing metric this was the obvious place to start
● What makes an ideal shelf capacity:
○ Availability (minimise lost sales)
○ Minimise labour costs re: stocking
○ Minimise waste
● Versions of these of varying quality/usefulness available internally
Results: Conceptual Metric
Tool Output
Store Info
Prod Info
Shelf Cap History
Lost Sales History
Labour History
Waste History
Lost Sales
Forecast
Labour
Forecast
Waste
Forecast
∑ Metric
Results: Forecasting
● Two years sample data
● Subset of stores and products
○ ~500 “essential” products
○ 2 stores of varying design and location (most recent 20% set aside for validation)
● Forecasting POC done for labour costs and lost sales
○ Cross validation grid with PCA used to reduce feature space
○ Random forest regressor gave better results than regularised linear models
Results: Lost Sales Forecasting
Results: Labour Forecasting
Lessons
learned
Important Questions to Ask
Technology/information
● Do they have historical data and what is its
consistency?
● Multiple sources?
● Access in volume and at speed?
● Discoverable?
Enthusiasm
● Have they defined a problem or class of
problems they would like to solve?
● How comfortable are they with more
modern ML/AI based approaches?
Important Questions to Ask
● Measurement of outcomes
○ Is there a metric or metrics in place to optimise for?
○ Do said metrics relate to valuable business outcomes in a meaningful way?
● History/Reproducibility
○ What have they tried before?
○ Have those efforts been logged in a way such that they are accessible and understandable?
Takeaways
● Start simple
○ Easier to solve problems can often help quickly sway the unconverted and there is usually
some obvious low-hanging fruit
○ Less complex models are easier to explain, train and maintain
● Align goals and expectations
○ Agree on metrics and what they actually represent
○ Call out any disconnects between KPIs and the value the client believes they represent
○ Take the time to explain ways of working and potential outcomes to team members
Takeaways
● Demonstrate value
○ In cases where clients are suspicious/unconvinced of new methodologies, easy wins and new
knowledge trump elegant solutions
● Invest time in knowledge transfer and training
○ Do your best to log your efforts (especially those that were unsuccessful) in a manner easier
accessible to potential future investigators
○ If you’re going to leave what you’ve created in someone else’s hands they should be
comfortable maintaining it
Thank you

More Related Content

Similar to Patterns for Success in Data Science Engagements (20)

PDF
Digicorp - Supply Chain Analytics Apps
Digicorp
 
PPTX
Day 1 (Lecture 2): Business Analytics
Aseda Owusua Addai-Deseh
 
DOC
Yaswanthreddy- 4.4Yrs Exp Product Management
YASWANTH REDDY KETHIREDDY
 
PDF
Data Drive Better Sales Conversions - Dawn of the Data Age Lecture Series
Luciano Pesci, PhD
 
PDF
Customer Research For Product Managers - Dawn of The Data Age Lecture Series
Luciano Pesci, PhD
 
PPTX
Supply Chain Strategy Assessment
Chief Innovation
 
PPTX
Legacy Content: Applying your new content strategy to old information
Salesforce Engineering
 
PDF
Doing Analytics Right - Designing and Automating Analytics
Tasktop
 
PDF
GraphTour London 2020 - Customer Journey
Neo4j
 
DOC
Yaswanth reddy 4.7 years.docx
YASWANTH REDDY KETHIREDDY
 
PDF
Leverage The Power of Small Data
Karyn Zuidinga
 
PDF
"From Insights to Production with Big Data Analytics", Eliano Marques, Senior...
Dataconomy Media
 
PDF
Big Data Analytics: From Insights to Production
Think Big, a Teradata Company
 
PDF
OKR framing (1).pdf
UmashankarTriplicane
 
PPTX
Process Redesign or Improvement Approach Options
Chief Innovation
 
PDF
Agile practices for management
Icalia Labs
 
PPTX
The How, Why and What of Metrics?
The Wisdom Daily
 
PDF
Growth Hacking Master Class
Dani Hart
 
DOC
Yaswanth reddy 4.8 years
YASWANTH REDDY KETHIREDDY
 
PPTX
What for all those PO tools & techniques_9.06.2018
Małgorzata Maksimczyk
 
Digicorp - Supply Chain Analytics Apps
Digicorp
 
Day 1 (Lecture 2): Business Analytics
Aseda Owusua Addai-Deseh
 
Yaswanthreddy- 4.4Yrs Exp Product Management
YASWANTH REDDY KETHIREDDY
 
Data Drive Better Sales Conversions - Dawn of the Data Age Lecture Series
Luciano Pesci, PhD
 
Customer Research For Product Managers - Dawn of The Data Age Lecture Series
Luciano Pesci, PhD
 
Supply Chain Strategy Assessment
Chief Innovation
 
Legacy Content: Applying your new content strategy to old information
Salesforce Engineering
 
Doing Analytics Right - Designing and Automating Analytics
Tasktop
 
GraphTour London 2020 - Customer Journey
Neo4j
 
Yaswanth reddy 4.7 years.docx
YASWANTH REDDY KETHIREDDY
 
Leverage The Power of Small Data
Karyn Zuidinga
 
"From Insights to Production with Big Data Analytics", Eliano Marques, Senior...
Dataconomy Media
 
Big Data Analytics: From Insights to Production
Think Big, a Teradata Company
 
OKR framing (1).pdf
UmashankarTriplicane
 
Process Redesign or Improvement Approach Options
Chief Innovation
 
Agile practices for management
Icalia Labs
 
The How, Why and What of Metrics?
The Wisdom Daily
 
Growth Hacking Master Class
Dani Hart
 
Yaswanth reddy 4.8 years
YASWANTH REDDY KETHIREDDY
 
What for all those PO tools & techniques_9.06.2018
Małgorzata Maksimczyk
 

More from Thoughtworks (20)

PDF
Design System as a Product
Thoughtworks
 
PDF
Designers, Developers & Dogs
Thoughtworks
 
PDF
Cloud-first for fast innovation
Thoughtworks
 
PDF
More impact with flexible teams
Thoughtworks
 
PDF
Culture of Innovation
Thoughtworks
 
PDF
Dual-Track Agile
Thoughtworks
 
PDF
Developer Experience
Thoughtworks
 
PDF
When we design together
Thoughtworks
 
PDF
Hardware is hard(er)
Thoughtworks
 
PDF
Customer-centric innovation enabled by cloud
Thoughtworks
 
PDF
Amazon's Culture of Innovation
Thoughtworks
 
PDF
When in doubt, go live
Thoughtworks
 
PDF
Don't cross the Rubicon
Thoughtworks
 
PDF
Error handling
Thoughtworks
 
PDF
Your test coverage is a lie!
Thoughtworks
 
PDF
Docker container security
Thoughtworks
 
PDF
Redefining the unit
Thoughtworks
 
PPTX
Technology Radar Webinar UK - Vol. 22
Thoughtworks
 
PDF
A Tribute to Turing
Thoughtworks
 
PDF
Rsa maths worked out
Thoughtworks
 
Design System as a Product
Thoughtworks
 
Designers, Developers & Dogs
Thoughtworks
 
Cloud-first for fast innovation
Thoughtworks
 
More impact with flexible teams
Thoughtworks
 
Culture of Innovation
Thoughtworks
 
Dual-Track Agile
Thoughtworks
 
Developer Experience
Thoughtworks
 
When we design together
Thoughtworks
 
Hardware is hard(er)
Thoughtworks
 
Customer-centric innovation enabled by cloud
Thoughtworks
 
Amazon's Culture of Innovation
Thoughtworks
 
When in doubt, go live
Thoughtworks
 
Don't cross the Rubicon
Thoughtworks
 
Error handling
Thoughtworks
 
Your test coverage is a lie!
Thoughtworks
 
Docker container security
Thoughtworks
 
Redefining the unit
Thoughtworks
 
Technology Radar Webinar UK - Vol. 22
Thoughtworks
 
A Tribute to Turing
Thoughtworks
 
Rsa maths worked out
Thoughtworks
 
Ad

Recently uploaded (20)

PDF
MiniTool Partition Wizard Free Crack + Full Free Download 2025
bashirkhan333g
 
PDF
Wondershare PDFelement Pro Crack for MacOS New Version Latest 2025
bashirkhan333g
 
PPTX
Finding Your License Details in IBM SPSS Statistics Version 31.pptx
Version 1 Analytics
 
PDF
[Solution] Why Choose the VeryPDF DRM Protector Custom-Built Solution for You...
Lingwen1998
 
PDF
Automate Cybersecurity Tasks with Python
VICTOR MAESTRE RAMIREZ
 
PPTX
ChiSquare Procedure in IBM SPSS Statistics Version 31.pptx
Version 1 Analytics
 
PDF
IDM Crack with Internet Download Manager 6.42 Build 43 with Patch Latest 2025
bashirkhan333g
 
PDF
How to Hire AI Developers_ Step-by-Step Guide in 2025.pdf
DianApps Technologies
 
PDF
Open Chain Q2 Steering Committee Meeting - 2025-06-25
Shane Coughlan
 
PDF
Odoo CRM vs Zoho CRM: Honest Comparison 2025
Odiware Technologies Private Limited
 
PPTX
AEM User Group: India Chapter Kickoff Meeting
jennaf3
 
PDF
Empower Your Tech Vision- Why Businesses Prefer to Hire Remote Developers fro...
logixshapers59
 
PPTX
Homogeneity of Variance Test Options IBM SPSS Statistics Version 31.pptx
Version 1 Analytics
 
PPTX
Hardware(Central Processing Unit ) CU and ALU
RizwanaKalsoom2
 
PDF
vMix Pro 28.0.0.42 Download vMix Registration key Bundle
kulindacore
 
PDF
TheFutureIsDynamic-BoxLang witch Luis Majano.pdf
Ortus Solutions, Corp
 
PPTX
Agentic Automation: Build & Deploy Your First UiPath Agent
klpathrudu
 
PDF
유니티에서 Burst Compiler+ThreadedJobs+SIMD 적용사례
Seongdae Kim
 
PDF
iTop VPN With Crack Lifetime Activation Key-CODE
utfefguu
 
PDF
MiniTool Partition Wizard 12.8 Crack License Key LATEST
hashhshs786
 
MiniTool Partition Wizard Free Crack + Full Free Download 2025
bashirkhan333g
 
Wondershare PDFelement Pro Crack for MacOS New Version Latest 2025
bashirkhan333g
 
Finding Your License Details in IBM SPSS Statistics Version 31.pptx
Version 1 Analytics
 
[Solution] Why Choose the VeryPDF DRM Protector Custom-Built Solution for You...
Lingwen1998
 
Automate Cybersecurity Tasks with Python
VICTOR MAESTRE RAMIREZ
 
ChiSquare Procedure in IBM SPSS Statistics Version 31.pptx
Version 1 Analytics
 
IDM Crack with Internet Download Manager 6.42 Build 43 with Patch Latest 2025
bashirkhan333g
 
How to Hire AI Developers_ Step-by-Step Guide in 2025.pdf
DianApps Technologies
 
Open Chain Q2 Steering Committee Meeting - 2025-06-25
Shane Coughlan
 
Odoo CRM vs Zoho CRM: Honest Comparison 2025
Odiware Technologies Private Limited
 
AEM User Group: India Chapter Kickoff Meeting
jennaf3
 
Empower Your Tech Vision- Why Businesses Prefer to Hire Remote Developers fro...
logixshapers59
 
Homogeneity of Variance Test Options IBM SPSS Statistics Version 31.pptx
Version 1 Analytics
 
Hardware(Central Processing Unit ) CU and ALU
RizwanaKalsoom2
 
vMix Pro 28.0.0.42 Download vMix Registration key Bundle
kulindacore
 
TheFutureIsDynamic-BoxLang witch Luis Majano.pdf
Ortus Solutions, Corp
 
Agentic Automation: Build & Deploy Your First UiPath Agent
klpathrudu
 
유니티에서 Burst Compiler+ThreadedJobs+SIMD 적용사례
Seongdae Kim
 
iTop VPN With Crack Lifetime Activation Key-CODE
utfefguu
 
MiniTool Partition Wizard 12.8 Crack License Key LATEST
hashhshs786
 
Ad

Patterns for Success in Data Science Engagements

  • 1. Patterns for Success in Data Science Engagements Dr. David Michel
  • 3. Overview ThoughtWorks has been expanding the quantity and depth of our data related engagements across the EU and globally under our Intelligent Empowerment offering. This talk will focus on lessons learned from 4 short term engagements with four different clients over the last 18 months ● Length of engagements varied between 2 weeks - 2 months ● Commonalities/differences in necessary approach ● Themes for success ● Pitfalls to avoid
  • 4. Project Summary CLIENT 1 CLIENT 2 CLIENT 3 CLIENT 4 Web presence for South American media conglomerate Home recipe delivery service offered by major UK retailer Major UK automobile reseller Major UK retailer Wanted to predict age/sex of anonymous users based on behaviour of registered users Wanted to more accurately predict demand for new recipes and different combinations of existing ones Wanted better insight and put themselves on the path towards making more data driven decisions Wanted to determine optimum shelf capacity for preset product range Existing model and infrastructure in place Set of heuristics in use Lots of reports and excel spreadsheets. No modelling to speak of Existing tool in use. Series of SQL queries run directly off data warehouse
  • 6. Client 1 (Web Branch for Media Company) ● Problem clearly defined ○ Identify men/women ○ Identify men 18-35, women 25-49 ● Data clearly accessible (though latency was high) ○ Jupyter sandbox with access to BigQuery data store ● Existing model in place ○ XGBoost with ~250 features ○ Updated weekly with ~2 hour training time ● Metrics in place (though likely suboptimal) ○ Accuracy in all three demos as defined by Nielsen
  • 7. Client 1 (Web Branch for Media Company) ● Limited time period (5 weeks) required scaling level of ambition and comprehensiveness of work ● Focus limited to three areas: ○ Quality of training data ○ Time period over which features were aggregated ○ Sub selection of training data to better serve usecase ● Emphasis placed on logging and reproducibility of results
  • 8. Results in Six Graphs
  • 10. Client 2 (Home Recipe Box) ● Problem clearly defined ○ Better forecast demand three weeks in advance of recipe offerings (when ingredients are ordered) to lower waste ● Data clearly accessible (and small) ○ ~35 week order history comprising ~6000 orders from ~5000 unique customers ● No model in place ○ Set of heuristics whose usefulness were visibly depreciating over time as number of recipes and variety combinations increased ● Metrics in place (though likely suboptimal) ○ Percentage over/undershoot of prediction compared to actual orders
  • 11. Client 2 (Home Recipe Box) ● Limited time period (3 weeks to deliver) ● Emphasis placed on creating functional forecasting tool and with large amounts of time budgeted for training and handover ● Self updating forecasting/visualisation tool built in Colaboratory Notebook ○ Recipe metadata and historical sales used to retrain random forest (initial attempts with regularised linear models were problematic) weekly with rolling 10 week windows of historical sales
  • 12. Results ● Internal forecasting for 9 weeks worth of data: ○ Mean error: 2.6% ○ Median error: 2.0% ○ Max overestimate: 10% ○ Max underestimate: 10% ● New model: ○ Mean error: 2.0% ○ Median error: 1.5% ○ Max overestimate: 7.2% ○ Max underestimate: 8.7%
  • 14. Client 3 (B2B Auto reseller) ● No real problem defined ○ Interest in sales channel allocation, but no internal agreement on desired output ● Data clearly accessible (in varying degrees of quality and latency) ○ SQL server 2008 enterprise warehouse with vehicle information ○ Refurb and auction information available only via spreadsheets downloaded from partner portals ● No existing model in place ● Metrics for success not defined
  • 15. Client 3 (B2B Auto reseller) ● 2 weeks to investigate available data and provide POC ● Lots of room to choose right/wrong problem ● Area chosen was POC for sale price forecasting based on channel and vehicle specifications ● Was thought to be the lowest hanging fruit that would allow for higher return on investment for each asset ○ Website vs Auction ○ Optimal refurb parameters for specific vehicles
  • 18. Client 4 (Major Grocer) ● Problem (reasonably) well defined ○ Investigate efficacy of current tool in use to determine shelf capacity (given fixed product range) ● Data accessible, but not discoverable and with numerous (often conflicting) sources of truth ● No existing model in place ○ Existing product used fixed calculation that was run via a series of SQL queries inside data warehouse ● No metrics in use to benchmark existing product
  • 19. Client 4 (Major Grocer) ● ~8 weeks to investigate ● With no metric to evaluate existing metric this was the obvious place to start ● What makes an ideal shelf capacity: ○ Availability (minimise lost sales) ○ Minimise labour costs re: stocking ○ Minimise waste ● Versions of these of varying quality/usefulness available internally
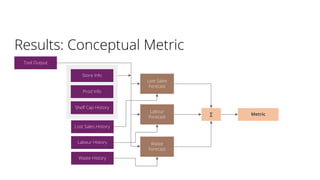
  • 20. Results: Conceptual Metric Tool Output Store Info Prod Info Shelf Cap History Lost Sales History Labour History Waste History Lost Sales Forecast Labour Forecast Waste Forecast ∑ Metric
  • 21. Results: Forecasting ● Two years sample data ● Subset of stores and products ○ ~500 “essential” products ○ 2 stores of varying design and location (most recent 20% set aside for validation) ● Forecasting POC done for labour costs and lost sales ○ Cross validation grid with PCA used to reduce feature space ○ Random forest regressor gave better results than regularised linear models
  • 22. Results: Lost Sales Forecasting
  • 25. Important Questions to Ask Technology/information ● Do they have historical data and what is its consistency? ● Multiple sources? ● Access in volume and at speed? ● Discoverable? Enthusiasm ● Have they defined a problem or class of problems they would like to solve? ● How comfortable are they with more modern ML/AI based approaches?
  • 26. Important Questions to Ask ● Measurement of outcomes ○ Is there a metric or metrics in place to optimise for? ○ Do said metrics relate to valuable business outcomes in a meaningful way? ● History/Reproducibility ○ What have they tried before? ○ Have those efforts been logged in a way such that they are accessible and understandable?
  • 27. Takeaways ● Start simple ○ Easier to solve problems can often help quickly sway the unconverted and there is usually some obvious low-hanging fruit ○ Less complex models are easier to explain, train and maintain ● Align goals and expectations ○ Agree on metrics and what they actually represent ○ Call out any disconnects between KPIs and the value the client believes they represent ○ Take the time to explain ways of working and potential outcomes to team members
  • 28. Takeaways ● Demonstrate value ○ In cases where clients are suspicious/unconvinced of new methodologies, easy wins and new knowledge trump elegant solutions ● Invest time in knowledge transfer and training ○ Do your best to log your efforts (especially those that were unsuccessful) in a manner easier accessible to potential future investigators ○ If you’re going to leave what you’ve created in someone else’s hands they should be comfortable maintaining it