SlideShare a Scribd company logo
Performing Data Science with HBase

  Aaron Kimball – CTO
  Kiyan Ahmadizadeh – MTS
MapReduce and log files


  Log files
              Batch analysis
                               Result data set
The way we build apps is changing
HBase plays a big role
• High performance random access
• Flexible schema & sparse storage
• Natural mechanism for time series data
  … organized by user
Batch machine learning
WibiData: architecture
Data science lays the groundwork
• Feature selection requires insight
• Data lies in HBase, not log files
• MapReduce is too cumbersome for
  exploratory analytics
Data science lays the groundwork
• Feature selection requires insight
• Data lies in HBase, not log files
• MapReduce is too cumbersome for
  exploratory analytics

• This talk: How do we explore data in HBase?
Why not Hive?

• Need to manually sync column schemas
• No complex type support for HBase + Hive
  – Our use of Avro facilitates complex record types
• No support for time series events in columns
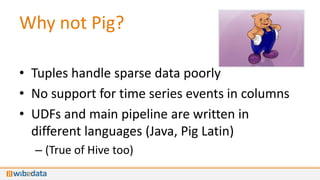
Why not Pig?

• Tuples handle sparse data poorly
• No support for time series events in columns
• UDFs and main pipeline are written in
  different languages (Java, Pig Latin)
  – (True of Hive too)
Our analysis needs
•   Read from HBase
•   Express complex concepts
•   Support deep MapReduce pipelines
•   Be written in concise code
•   Be accessible to data scientists more
    comfortable with R & python than Java
Our analysis needs

• Concise: We use Scala
• Powerful: We use Apache Crunch
• Interactive: We built a shell

wibi>
WDL: The WibiData Language

wibi> 2 + 2     wibi> :tables
res0: Int = 4   Table     Description
                ======== ===========
                page      Wiki page info
                user      per-user stats
Outline
•   Analyzing Wikipedia
•   Introducing Scala
•   An Overview of Crunch
•   Extending Crunch to HBase + WibiData
•   Demo!
Analyzing Wikipedia

• All revisions of all English pages
• Simulates real system that could be built on
  top of WibiData
• Allows us to practice real analysis at scale
Per-user information
• Rows keyed by Wikipedia user id or IP address
• Statistics for several metrics on all edits made
  by each user
Introducing
• Scala language allows declarative statements
• Easier to express transformations over your
  data in an intuitive way
• Integrates with Java and runs on the JVM
• Supports interactive evaluation
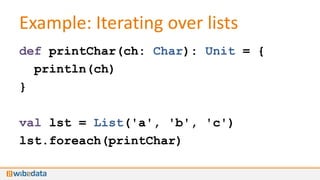
Example: Iterating over lists
def printChar(ch: Char): Unit = {
  println(ch)
}

val lst = List('a', 'b', 'c')
lst.foreach(printChar)
… with an anonymous function
val lst = List('a', 'b', 'c')
lst.foreach( ch => println(ch) )


• Anonymous function can be specified as
  argument to foreach() method of a list.
• Lists, sets, etc. are immutable by default
Example: Transforming a list
val lst = List(1, 4, 7)
val doubled = lst.map(x => x * 2)


• map() applies a function to each element,
  yielding a new list. (doubled is the list [2,
  8, 14])
Example: Filtering
• Apply a boolean function to each element of a
  list, keep the ones that return true:

val lst = List(1, 3, 5, 6, 9)
val threes =
  lst.filter(x => x % 3 == 0)
// ‘threes’ is the list [3, 6, 9]
Example: Aggregation
val lst = List(1, 2, 12, 5)
lst.reduceLeft( (sum, x) => sum + x )
// Evaluates to 20.


• reduceLeft() aggregates elements left-to-right,
  in this case by keeping a running sum.
Crunch: MapReduce pipelines
def runWordCount(input, output) = {
  val wordCounts = read(From.textFile(input))
    .flatMap(line =>
        line.toLowerCase.split("""s+"""))
    .filter(word => !word.isEmpty())
    .count
  wordCounts.write(To.textFile(output))
}
PCollections: Crunch data sets
• Represent a parallel record-oriented data set
• Items in PCollections can be lines of text,
  tuples, or complex data structures
• Crunch functions (like flatMap() and
  filter()) do work on partitions of
  PCollections in parallel.
PCollections… of WibiRows
•   WibiRow: Represents a row in a Wibi table
•   Enables access to sparse columns
•   … as a value: row(someColumn): Value
•   … As a timeline of values to iterate/aggregate:
    row.timeline(someColumn): Timeline[Value]
Introducing: Kiyan Ahmadizadeh
Demo!
Demo: Visualizing Distributions
• Suppose you have a metric taken on some population of
  users.
• Want to visualize what the distribution of the metric among
  the population looks like.
   – Could inform next analysis steps, feature selection for models,
     etc.
• Histograms can give insight on the shape of a distribution.
   – Choose a set of bins for the metric.
   – Count the number of population members whose metric falls
     into each bin.
Demo: Wikimedia Dataset
• We have a user table containing the average
  delta for all edits made by a user to pages.
• Edit Delta: The number of characters added or
  deleted by an edit to a page.
• Want to visualize the distribution of average
  deltas among users.
Demo!
Code: Accessing Data
val stats =
   ColumnFamily[Stats]("edit_metric_stats")

val userTable = read(
    From.wibi(WibiTableAddress.of("user"), stats))
Code: Accessing Data
val stats =
   ColumnFamily[Stats]("edit_metric_stats")

val userTable = read(
    From.wibi(WibiTableAddress.of("user"), stats))


Will act as a handle
for accessing the
column family.
Code: Accessing Data
val stats =
   ColumnFamily[Stats]("edit_metric_stats")

val userTable = read(
    From.wibi(WibiTableAddress.of("user"), stats))


                Type annotation tells
                WDL what kind of
                data to read out of
                the family.
Code: Accessing Data
val stats =
   ColumnFamily[Stats]("edit_metric_stats")

val userTable = read(
    From.wibi(WibiTableAddress.of("user"), stats))


userTable is a PCollection[WibiRow] obtained by reading the
column family “edit_metric_stats” from the Wibi table
“user.”
Code: UDFs
def getBin(bins: Range, value: Double): Int = {
  bins.reduceLeft ( (choice, bin) =>
    if (value < bin) choice else bin )
}

def inRange(bins: Range, value: Double): Boolean =
  range.start <= value && value <= range.end
Code: UDFs
def getBin(bins: Range, value: Double): Int = {
  bins.reduceLeft ( (choice, bin) =>
    if (value < bin) choice else bin )
}

def inRange(bins: Range, value: Double): Boolean =
  range.start <= value && value <= range.end


Everyday Scala function declarations!
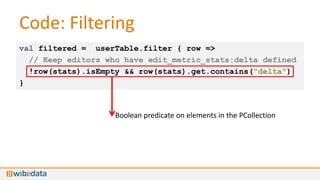
Code: Filtering
val filtered = userTable.filter { row =>
  // Keep editors who have edit_metric_stats:delta defined
  !row(stats).isEmpty && row(stats).get.contains("delta")
}
Code: Filtering
val filtered = userTable.filter { row =>
  // Keep editors who have edit_metric_stats:delta defined
  !row(stats).isEmpty && row(stats).get.contains("delta")
}


                    Boolean predicate on elements in the PCollection
Code: Filtering
val filtered = userTable.filter { row =>
  // Keep editors who have edit_metric_stats:delta defined
  !row(stats).isEmpty && row(stats).get.contains("delta")
}

  filtered is a PCollection of rows that have the column edit_metric_stats:delta
Code: Filtering
val filtered = userTable.filter { row =>
  // Keep editors who have edit_metric_stats:delta defined
  !row(stats).isEmpty && row(stats).get.contains("delta")
}


Use stats variable we declared earlier to access the column family.
       val stats = ColumnFamily[Stats]("edit_metric_stats")
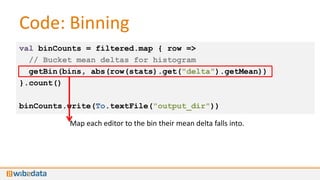
Code: Binning
val binCounts = filtered.map { row =>
  // Bucket mean deltas for histogram
  getBin(bins, abs(row(stats).get("delta").getMean))
}.count()

binCounts.write(To.textFile("output_dir"))
Code: Binning
val binCounts = filtered.map { row =>
  // Bucket mean deltas for histogram
  getBin(bins, abs(row(stats).get("delta").getMean))
}.count()

binCounts.write(To.textFile("output_dir"))

          Map each editor to the bin their mean delta falls into.
Code: Binning
val binCounts = filtered.map { row =>
  // Bucket mean deltas for histogram
  getBin(bins, abs(row(stats).get("delta").getMean))
}.count()

binCounts.write(To.textFile("output_dir"))


Count how many times each bin occurs in the resulting collection.
Code: Binning
val binCounts = filtered.map { row =>
  // Bucket mean deltas for histogram
  getBin(bins, abs(row(stats).get("delta").getMean))
}.count()

binCounts.write(To.textFile("output_dir"))


        binCounts contains the number of editors that fall in each bin.
Code: Binning
val binCounts = filtered.map { row =>
  // Bucket mean deltas for histogram
  getBin(bins, abs(row(stats).get("delta").getMean))
}.count()

binCounts.write(To.textFile("output_dir"))


        Writes the result to HDFS.
Code: Visualization
Histogram.plot(binCounts,
    bins,
    "Histogram of Editors by Mean Delta",
    "Mean Delta",
    "Number of Editors",
    "delta_mean_hist.html")
Analysis Results: 1% of Data
Analysis Results: Full Data Set
Conclusions


           +                   +

     = Scalable analysis of sparse data
Aaron Kimball – aaron@wibidata.com
Kiyan Ahmadizadeh – kiyan@wibidata.com

More Related Content

What's hot (20)

PDF
Hive Functions Cheat Sheet
Hortonworks
 
PDF
R Introduction
Sangeetha S
 
PPT
sets and maps
Rajkattamuri
 
PDF
Dynamodb
Jean-Tiare LE BIGOT
 
PPT
Hive(ppt)
Abhinav Tyagi
 
PDF
Practical data science_public
Long Nguyen
 
PDF
pandas - Python Data Analysis
Andrew Henshaw
 
PPTX
Unit 5-apache hive
vishal choudhary
 
PPTX
Be A Hero: Transforming GoPro Analytics Data Pipeline
Chester Chen
 
PDF
Apache hive
Inthra onsap
 
PPTX
Apache Hive
Abhishek Gautam
 
PPTX
Using Spectrum on Demand from MapInfo Pro
Peter Horsbøll Møller
 
PPT
Hadoop World 2011: Building Web Analytics Processing on Hadoop at CBS Interac...
Cloudera, Inc.
 
PPT
Unit 5-lecture4
vishal choudhary
 
PPTX
Introduction to Azure Data Lake and U-SQL for SQL users (SQL Saturday 635)
Michael Rys
 
PDF
Data profiling with Apache Calcite
Julian Hyde
 
PPTX
Introduction to HBase - Phoenix HUG 5/14
Jeremy Walsh
 
PDF
Python business intelligence (PyData 2012 talk)
Stefan Urbanek
 
PPTX
U-SQL Partitioned Data and Tables (SQLBits 2016)
Michael Rys
 
PPT
Generalized framework for using NoSQL Databases
KIRAN V
 
Hive Functions Cheat Sheet
Hortonworks
 
R Introduction
Sangeetha S
 
sets and maps
Rajkattamuri
 
Hive(ppt)
Abhinav Tyagi
 
Practical data science_public
Long Nguyen
 
pandas - Python Data Analysis
Andrew Henshaw
 
Unit 5-apache hive
vishal choudhary
 
Be A Hero: Transforming GoPro Analytics Data Pipeline
Chester Chen
 
Apache hive
Inthra onsap
 
Apache Hive
Abhishek Gautam
 
Using Spectrum on Demand from MapInfo Pro
Peter Horsbøll Møller
 
Hadoop World 2011: Building Web Analytics Processing on Hadoop at CBS Interac...
Cloudera, Inc.
 
Unit 5-lecture4
vishal choudhary
 
Introduction to Azure Data Lake and U-SQL for SQL users (SQL Saturday 635)
Michael Rys
 
Data profiling with Apache Calcite
Julian Hyde
 
Introduction to HBase - Phoenix HUG 5/14
Jeremy Walsh
 
Python business intelligence (PyData 2012 talk)
Stefan Urbanek
 
U-SQL Partitioned Data and Tables (SQLBits 2016)
Michael Rys
 
Generalized framework for using NoSQL Databases
KIRAN V
 

Similar to Performing Data Science with HBase (20)

PDF
Building a Big Data Machine Learning Platform
Cliff Click
 
PDF
Final Report_798 Project_Nithin_Sharmila
Nithin Kakkireni
 
PPT
Hive Percona 2009
prasadc
 
PDF
GBM in H2O with Cliff Click: H2O API
Sri Ambati
 
PPTX
HBase_-_data_operaet le opérations de calciletions_final.pptx
HmadSADAQ2
 
PPTX
HBaseCon 2012 | Mignify: A Big Data Refinery Built on HBase - Internet Memory...
Cloudera, Inc.
 
PPTX
Unit II Hadoop Ecosystem_Updated.pptx
BhavanaHotchandani
 
PPTX
Hive : WareHousing Over hadoop
Chirag Ahuja
 
PDF
Data Analysis with Hadoop and Hive, ChicagoDB 2/21/2011
Jonathan Seidman
 
PPT
Hive Apachecon 2008
athusoo
 
PPTX
Hadoop Summit 2012 | Bayesian Counters AKA In Memory Data Mining for Large Da...
Cloudera, Inc.
 
PDF
Lecture 2 part 3
Jazan University
 
PPTX
Coding serbia
Dusan Zamurovic
 
PPTX
Zaharia spark-scala-days-2012
Skills Matter Talks
 
PPT
Data-Intensive Scalable Science
University of Washington
 
PDF
rhbase_tutorial
Aaron Benz
 
PPTX
Hadoop and HBase experiences in perf log project
Mao Geng
 
PDF
Big data distributed processing: Spark introduction
Hektor Jacynycz García
 
PDF
Exploratory Data Analysis
Katy Allen
 
PPTX
Big Data Everywhere Chicago: SQL on Hadoop
BigDataEverywhere
 
Building a Big Data Machine Learning Platform
Cliff Click
 
Final Report_798 Project_Nithin_Sharmila
Nithin Kakkireni
 
Hive Percona 2009
prasadc
 
GBM in H2O with Cliff Click: H2O API
Sri Ambati
 
HBase_-_data_operaet le opérations de calciletions_final.pptx
HmadSADAQ2
 
HBaseCon 2012 | Mignify: A Big Data Refinery Built on HBase - Internet Memory...
Cloudera, Inc.
 
Unit II Hadoop Ecosystem_Updated.pptx
BhavanaHotchandani
 
Hive : WareHousing Over hadoop
Chirag Ahuja
 
Data Analysis with Hadoop and Hive, ChicagoDB 2/21/2011
Jonathan Seidman
 
Hive Apachecon 2008
athusoo
 
Hadoop Summit 2012 | Bayesian Counters AKA In Memory Data Mining for Large Da...
Cloudera, Inc.
 
Lecture 2 part 3
Jazan University
 
Coding serbia
Dusan Zamurovic
 
Zaharia spark-scala-days-2012
Skills Matter Talks
 
Data-Intensive Scalable Science
University of Washington
 
rhbase_tutorial
Aaron Benz
 
Hadoop and HBase experiences in perf log project
Mao Geng
 
Big data distributed processing: Spark introduction
Hektor Jacynycz García
 
Exploratory Data Analysis
Katy Allen
 
Big Data Everywhere Chicago: SQL on Hadoop
BigDataEverywhere
 
Ad

More from WibiData (6)

PDF
Data Evolution on HBase with Kiji
WibiData
 
PDF
Exploring the Enron Email Dataset with Kiji and Hive
WibiData
 
PDF
Analyzing Large-Scale User Data with Hadoop and HBase
WibiData
 
PDF
Building Personalized Applications at Scale
WibiData
 
PDF
Analyzing Large-Scale User Data with Hadoop and HBase
WibiData
 
PDF
Building Personalized Applications with HBase
WibiData
 
Data Evolution on HBase with Kiji
WibiData
 
Exploring the Enron Email Dataset with Kiji and Hive
WibiData
 
Analyzing Large-Scale User Data with Hadoop and HBase
WibiData
 
Building Personalized Applications at Scale
WibiData
 
Analyzing Large-Scale User Data with Hadoop and HBase
WibiData
 
Building Personalized Applications with HBase
WibiData
 
Ad

Recently uploaded (20)

PDF
Chris Elwell Woburn, MA - Passionate About IT Innovation
Chris Elwell Woburn, MA
 
PDF
Achieving Consistent and Reliable AI Code Generation - Medusa AI
medusaaico
 
PDF
Presentation - Vibe Coding The Future of Tech
yanuarsinggih1
 
PDF
[Newgen] NewgenONE Marvin Brochure 1.pdf
darshakparmar
 
PDF
How Startups Are Growing Faster with App Developers in Australia.pdf
India App Developer
 
PPTX
AI Penetration Testing Essentials: A Cybersecurity Guide for 2025
defencerabbit Team
 
PDF
Jak MŚP w Europie Środkowo-Wschodniej odnajdują się w świecie AI
dominikamizerska1
 
PDF
Transcript: New from BookNet Canada for 2025: BNC BiblioShare - Tech Forum 2025
BookNet Canada
 
PDF
Log-Based Anomaly Detection: Enhancing System Reliability with Machine Learning
Mohammed BEKKOUCHE
 
PDF
Fl Studio 24.2.2 Build 4597 Crack for Windows Free Download 2025
faizk77g
 
PPTX
WooCommerce Workshop: Bring Your Laptop
Laura Hartwig
 
PDF
Exolore The Essential AI Tools in 2025.pdf
Srinivasan M
 
PPTX
UiPath Academic Alliance Educator Panels: Session 2 - Business Analyst Content
DianaGray10
 
PDF
CIFDAQ Market Insights for July 7th 2025
CIFDAQ
 
PPTX
Q2 FY26 Tableau User Group Leader Quarterly Call
lward7
 
PDF
"AI Transformation: Directions and Challenges", Pavlo Shaternik
Fwdays
 
PDF
NewMind AI - Journal 100 Insights After The 100th Issue
NewMind AI
 
PDF
HubSpot Main Hub: A Unified Growth Platform
Jaswinder Singh
 
PDF
Complete JavaScript Notes: From Basics to Advanced Concepts.pdf
haydendavispro
 
PDF
Bitcoin for Millennials podcast with Bram, Power Laws of Bitcoin
Stephen Perrenod
 
Chris Elwell Woburn, MA - Passionate About IT Innovation
Chris Elwell Woburn, MA
 
Achieving Consistent and Reliable AI Code Generation - Medusa AI
medusaaico
 
Presentation - Vibe Coding The Future of Tech
yanuarsinggih1
 
[Newgen] NewgenONE Marvin Brochure 1.pdf
darshakparmar
 
How Startups Are Growing Faster with App Developers in Australia.pdf
India App Developer
 
AI Penetration Testing Essentials: A Cybersecurity Guide for 2025
defencerabbit Team
 
Jak MŚP w Europie Środkowo-Wschodniej odnajdują się w świecie AI
dominikamizerska1
 
Transcript: New from BookNet Canada for 2025: BNC BiblioShare - Tech Forum 2025
BookNet Canada
 
Log-Based Anomaly Detection: Enhancing System Reliability with Machine Learning
Mohammed BEKKOUCHE
 
Fl Studio 24.2.2 Build 4597 Crack for Windows Free Download 2025
faizk77g
 
WooCommerce Workshop: Bring Your Laptop
Laura Hartwig
 
Exolore The Essential AI Tools in 2025.pdf
Srinivasan M
 
UiPath Academic Alliance Educator Panels: Session 2 - Business Analyst Content
DianaGray10
 
CIFDAQ Market Insights for July 7th 2025
CIFDAQ
 
Q2 FY26 Tableau User Group Leader Quarterly Call
lward7
 
"AI Transformation: Directions and Challenges", Pavlo Shaternik
Fwdays
 
NewMind AI - Journal 100 Insights After The 100th Issue
NewMind AI
 
HubSpot Main Hub: A Unified Growth Platform
Jaswinder Singh
 
Complete JavaScript Notes: From Basics to Advanced Concepts.pdf
haydendavispro
 
Bitcoin for Millennials podcast with Bram, Power Laws of Bitcoin
Stephen Perrenod
 

Performing Data Science with HBase

  • 2. Performing Data Science with HBase Aaron Kimball – CTO Kiyan Ahmadizadeh – MTS
  • 3. MapReduce and log files Log files Batch analysis Result data set
  • 4. The way we build apps is changing
  • 5. HBase plays a big role • High performance random access • Flexible schema & sparse storage • Natural mechanism for time series data … organized by user
  • 8. Data science lays the groundwork • Feature selection requires insight • Data lies in HBase, not log files • MapReduce is too cumbersome for exploratory analytics
  • 9. Data science lays the groundwork • Feature selection requires insight • Data lies in HBase, not log files • MapReduce is too cumbersome for exploratory analytics • This talk: How do we explore data in HBase?
  • 10. Why not Hive? • Need to manually sync column schemas • No complex type support for HBase + Hive – Our use of Avro facilitates complex record types • No support for time series events in columns
  • 11. Why not Pig? • Tuples handle sparse data poorly • No support for time series events in columns • UDFs and main pipeline are written in different languages (Java, Pig Latin) – (True of Hive too)
  • 12. Our analysis needs • Read from HBase • Express complex concepts • Support deep MapReduce pipelines • Be written in concise code • Be accessible to data scientists more comfortable with R & python than Java
  • 13. Our analysis needs • Concise: We use Scala • Powerful: We use Apache Crunch • Interactive: We built a shell wibi>
  • 14. WDL: The WibiData Language wibi> 2 + 2 wibi> :tables res0: Int = 4 Table Description ======== =========== page Wiki page info user per-user stats
  • 15. Outline • Analyzing Wikipedia • Introducing Scala • An Overview of Crunch • Extending Crunch to HBase + WibiData • Demo!
  • 16. Analyzing Wikipedia • All revisions of all English pages • Simulates real system that could be built on top of WibiData • Allows us to practice real analysis at scale
  • 17. Per-user information • Rows keyed by Wikipedia user id or IP address • Statistics for several metrics on all edits made by each user
  • 18. Introducing • Scala language allows declarative statements • Easier to express transformations over your data in an intuitive way • Integrates with Java and runs on the JVM • Supports interactive evaluation
  • 19. Example: Iterating over lists def printChar(ch: Char): Unit = { println(ch) } val lst = List('a', 'b', 'c') lst.foreach(printChar)
  • 20. … with an anonymous function val lst = List('a', 'b', 'c') lst.foreach( ch => println(ch) ) • Anonymous function can be specified as argument to foreach() method of a list. • Lists, sets, etc. are immutable by default
  • 21. Example: Transforming a list val lst = List(1, 4, 7) val doubled = lst.map(x => x * 2) • map() applies a function to each element, yielding a new list. (doubled is the list [2, 8, 14])
  • 22. Example: Filtering • Apply a boolean function to each element of a list, keep the ones that return true: val lst = List(1, 3, 5, 6, 9) val threes = lst.filter(x => x % 3 == 0) // ‘threes’ is the list [3, 6, 9]
  • 23. Example: Aggregation val lst = List(1, 2, 12, 5) lst.reduceLeft( (sum, x) => sum + x ) // Evaluates to 20. • reduceLeft() aggregates elements left-to-right, in this case by keeping a running sum.
  • 24. Crunch: MapReduce pipelines def runWordCount(input, output) = { val wordCounts = read(From.textFile(input)) .flatMap(line => line.toLowerCase.split("""s+""")) .filter(word => !word.isEmpty()) .count wordCounts.write(To.textFile(output)) }
  • 25. PCollections: Crunch data sets • Represent a parallel record-oriented data set • Items in PCollections can be lines of text, tuples, or complex data structures • Crunch functions (like flatMap() and filter()) do work on partitions of PCollections in parallel.
  • 26. PCollections… of WibiRows • WibiRow: Represents a row in a Wibi table • Enables access to sparse columns • … as a value: row(someColumn): Value • … As a timeline of values to iterate/aggregate: row.timeline(someColumn): Timeline[Value]
  • 28. Demo!
  • 29. Demo: Visualizing Distributions • Suppose you have a metric taken on some population of users. • Want to visualize what the distribution of the metric among the population looks like. – Could inform next analysis steps, feature selection for models, etc. • Histograms can give insight on the shape of a distribution. – Choose a set of bins for the metric. – Count the number of population members whose metric falls into each bin.
  • 30. Demo: Wikimedia Dataset • We have a user table containing the average delta for all edits made by a user to pages. • Edit Delta: The number of characters added or deleted by an edit to a page. • Want to visualize the distribution of average deltas among users.
  • 31. Demo!
  • 32. Code: Accessing Data val stats = ColumnFamily[Stats]("edit_metric_stats") val userTable = read( From.wibi(WibiTableAddress.of("user"), stats))
  • 33. Code: Accessing Data val stats = ColumnFamily[Stats]("edit_metric_stats") val userTable = read( From.wibi(WibiTableAddress.of("user"), stats)) Will act as a handle for accessing the column family.
  • 34. Code: Accessing Data val stats = ColumnFamily[Stats]("edit_metric_stats") val userTable = read( From.wibi(WibiTableAddress.of("user"), stats)) Type annotation tells WDL what kind of data to read out of the family.
  • 35. Code: Accessing Data val stats = ColumnFamily[Stats]("edit_metric_stats") val userTable = read( From.wibi(WibiTableAddress.of("user"), stats)) userTable is a PCollection[WibiRow] obtained by reading the column family “edit_metric_stats” from the Wibi table “user.”
  • 36. Code: UDFs def getBin(bins: Range, value: Double): Int = { bins.reduceLeft ( (choice, bin) => if (value < bin) choice else bin ) } def inRange(bins: Range, value: Double): Boolean = range.start <= value && value <= range.end
  • 37. Code: UDFs def getBin(bins: Range, value: Double): Int = { bins.reduceLeft ( (choice, bin) => if (value < bin) choice else bin ) } def inRange(bins: Range, value: Double): Boolean = range.start <= value && value <= range.end Everyday Scala function declarations!
  • 38. Code: Filtering val filtered = userTable.filter { row => // Keep editors who have edit_metric_stats:delta defined !row(stats).isEmpty && row(stats).get.contains("delta") }
  • 39. Code: Filtering val filtered = userTable.filter { row => // Keep editors who have edit_metric_stats:delta defined !row(stats).isEmpty && row(stats).get.contains("delta") } Boolean predicate on elements in the PCollection
  • 40. Code: Filtering val filtered = userTable.filter { row => // Keep editors who have edit_metric_stats:delta defined !row(stats).isEmpty && row(stats).get.contains("delta") } filtered is a PCollection of rows that have the column edit_metric_stats:delta
  • 41. Code: Filtering val filtered = userTable.filter { row => // Keep editors who have edit_metric_stats:delta defined !row(stats).isEmpty && row(stats).get.contains("delta") } Use stats variable we declared earlier to access the column family. val stats = ColumnFamily[Stats]("edit_metric_stats")
  • 42. Code: Binning val binCounts = filtered.map { row => // Bucket mean deltas for histogram getBin(bins, abs(row(stats).get("delta").getMean)) }.count() binCounts.write(To.textFile("output_dir"))
  • 43. Code: Binning val binCounts = filtered.map { row => // Bucket mean deltas for histogram getBin(bins, abs(row(stats).get("delta").getMean)) }.count() binCounts.write(To.textFile("output_dir")) Map each editor to the bin their mean delta falls into.
  • 44. Code: Binning val binCounts = filtered.map { row => // Bucket mean deltas for histogram getBin(bins, abs(row(stats).get("delta").getMean)) }.count() binCounts.write(To.textFile("output_dir")) Count how many times each bin occurs in the resulting collection.
  • 45. Code: Binning val binCounts = filtered.map { row => // Bucket mean deltas for histogram getBin(bins, abs(row(stats).get("delta").getMean)) }.count() binCounts.write(To.textFile("output_dir")) binCounts contains the number of editors that fall in each bin.
  • 46. Code: Binning val binCounts = filtered.map { row => // Bucket mean deltas for histogram getBin(bins, abs(row(stats).get("delta").getMean)) }.count() binCounts.write(To.textFile("output_dir")) Writes the result to HDFS.
  • 47. Code: Visualization Histogram.plot(binCounts, bins, "Histogram of Editors by Mean Delta", "Mean Delta", "Number of Editors", "delta_mean_hist.html")
  • 50. Conclusions + + = Scalable analysis of sparse data