SlideShare a Scribd company logo
Cloud-Native Monitoring
With Prometheus
Valentina Contenti
Kubernets Solutions Engineer
valentina@sighup.io
What is Prometheus?
Community Driven Open-source Monitoring and
Alerting stack, ships a time series database, an
alerting entity and a number of integration tools to
expose metrics.
Made for dynamic cloud environments.
What is Prometheus made for?
• Instrumentation for applications and
systems
• Metrics collection and storage
• Querying, alerting, dashboarding
What is Prometheus not made for?
• Logging or tracing
• Automatic anomaly detection
• Scalable or durable storage
A brief but distinguished history
Started in 2012 as a SoundCloud
internal project
Second project to join CNCF after
Kubernetes
Prometheus v1.0.0 released in 2016
Prometheus v2.0.0 released in 2017
Core features
• Simplicity + efficiency
• Dimensional data model
• Powerful query language - PromQL
• Service discovery integration
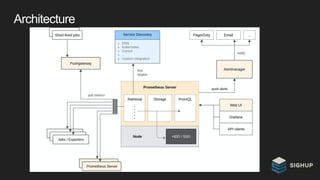
Architecture
Simplicity + efficiency:
• Local storage, no clustering
• 1 million+ samples/s
• Millions of series
• 1-2 bytes per sample
• HA by running two
• Go: static binary
Data model
https://prometheus.io/docs/concepts/data_model/
• Prometheus stores all data as time series: streams
of timestamped values belonging to the same metric
and the same set of labeled dimensions.
• Every time series is uniquely identified by its metric
name and optional key-value pairs called labels.
• The metric name specifies the general feature of a
system that is measured
Time series with labels
node_cpu_seconds_total{cpu="0",instance="demo.robustperception.io:9100",job="nod
e",mode="idle"} 14838327.84
metric name labels
• Flexible
• No hierarchy
• Explicit dimensions
Time series with labels
• Time series: tuple {time, value}
PromQL - simple but powerful
Queries in action
Better, persistent graphs: Grafana
https://grafana.com/
Pulling metrics
How do you expose those metrics?
• Exporters
• Language specific client libraries
• Service Discovery
/metrics endpoints
Exporters/Clientlibs
The community has contributed
exporters and clientlibs for pretty
much everything
https://prometheus.io/docs/instrumenting/exporters/
https://prometheus.io/docs/instrumenting/clientlibs/
Dynamic Environments: new challenges!
• Dynamic VMs
• Cluster schedulers
• Microservices
• …many services, dynamic hosts, and
ports
Service Discovery
https://prometheus.io/docs/prometheus/latest/configuration/configuration/
Prometheus has built-in support for:
• VM providers (AWS, Azure, Google, ...)
• Cluster managers (Kubernetes,
Marathon, …)
• Generic mechanisms (DNS, Consul,
Zookeeper, custom, ...)
Service Discovery
https://github.com/prometheus/prometheus/blob/master/documentation/examples/prometheus-
kubernetes.yml
Let’s use Kubernetes as an example
Alerting
https://prometheus.io/docs/practices/alerting/
You can write your own alerting rules.
(of course, the community has
examples/projects)
Writing alerts: a simple example
- alert: <alert_name>
annotations:
message: '{{ $labels.<some_label> }} <summary>'
doc: "<description>"
expr: |
<condition>
for: 15m
labels:
severity: warning
Writing alerts: a real-world example
- alert: NodeCPUStuckInIOWait
annotations:
message: '{{ $labels.instance }} spent more than half its CPU time in
IOWait in the last 5 minutes'
doc: "This alert fires if CPU time in IOWait mode calculated on a 5
minutes window for a given instance was more than 50% in the last 15
minutes."
expr: |
rate(node_cpu_seconds_total{mode="iowait"}[5m]) > 0.5
for: 15m
labels:
severity: warning
Alert Dispatching
The alertmanager dispatches alerts to
the right channel according to their
severity
Alertmanger
https://prometheus.io/docs/alerting/configuration/
You can configure your dispatching service just the way you like it.
(again, of course, there are examples)
To recap:
• Simplicity + efficiency
• Dimensional data model
• Powerful query language
• Service discovery integration
Try it at home!
http://demo.robustperception.io:9090/consoles/index.html

More Related Content

What's hot (20)

PDF
Infrastructure & System Monitoring using Prometheus
Marco Pas
 
PPTX
Prometheus 101
Paul Podolny
 
PDF
Autoscaling Kubernetes
craigbox
 
PDF
Intro to open source observability with grafana, prometheus, loki, and tempo(...
LibbySchulze
 
PDF
Server monitoring using grafana and prometheus
Celine George
 
PPTX
Azure kubernetes service (aks)
Akash Agrawal
 
PPTX
OpenTelemetry For Architects
Kevin Brockhoff
 
PPTX
Comprehensive Terraform Training
Yevgeniy Brikman
 
PDF
Deploy 22 microservices from scratch in 30 mins with GitOps
Opsta
 
PDF
[오픈소스컨설팅] Open Stack Ceph, Neutron, HA, Multi-Region
Ji-Woong Choi
 
PDF
Getting Started Monitoring with Prometheus and Grafana
Syah Dwi Prihatmoko
 
PDF
Introduction to GitHub Actions
Bo-Yi Wu
 
PPTX
Docker introduction &amp; benefits
Amit Manwade
 
PDF
Prometheus Overview
Brian Brazil
 
PPTX
Prometheus (Prometheus London, 2016)
Brian Brazil
 
PDF
End to end Machine Learning using Kubeflow - Build, Train, Deploy and Manage
Animesh Singh
 
PDF
Airflow introduction
Chandler Huang
 
PDF
Observability
Diego Pacheco
 
PDF
Terraform Introduction
soniasnowfrog
 
PDF
Docker Introduction
Peng Xiao
 
Infrastructure & System Monitoring using Prometheus
Marco Pas
 
Prometheus 101
Paul Podolny
 
Autoscaling Kubernetes
craigbox
 
Intro to open source observability with grafana, prometheus, loki, and tempo(...
LibbySchulze
 
Server monitoring using grafana and prometheus
Celine George
 
Azure kubernetes service (aks)
Akash Agrawal
 
OpenTelemetry For Architects
Kevin Brockhoff
 
Comprehensive Terraform Training
Yevgeniy Brikman
 
Deploy 22 microservices from scratch in 30 mins with GitOps
Opsta
 
[오픈소스컨설팅] Open Stack Ceph, Neutron, HA, Multi-Region
Ji-Woong Choi
 
Getting Started Monitoring with Prometheus and Grafana
Syah Dwi Prihatmoko
 
Introduction to GitHub Actions
Bo-Yi Wu
 
Docker introduction &amp; benefits
Amit Manwade
 
Prometheus Overview
Brian Brazil
 
Prometheus (Prometheus London, 2016)
Brian Brazil
 
End to end Machine Learning using Kubeflow - Build, Train, Deploy and Manage
Animesh Singh
 
Airflow introduction
Chandler Huang
 
Observability
Diego Pacheco
 
Terraform Introduction
soniasnowfrog
 
Docker Introduction
Peng Xiao
 

Similar to Prometheus - basics (20)

PDF
Monitoring Cloud Native Applications with Prometheus
Jacopo Nardiello
 
PDF
Monitoring in Big Data Platform - Albert Lewandowski, GetInData
GetInData
 
PPTX
MeetUp Monitoring with Prometheus and Grafana (September 2018)
Lucas Jellema
 
PPTX
Prometheus workshop
OpsTree solutions
 
PDF
Monitoring Kubernetes with Prometheus (Kubernetes Ireland, 2016)
Brian Brazil
 
PDF
Jacopo Nardiello - Monitoring Cloud-Native applications with Prometheus - Cod...
Codemotion
 
PPTX
Prometheus Training
Tim Tyler
 
PDF
Prometheus monitoring
Hien Nguyen Van
 
PDF
The hitchhiker’s guide to Prometheus
Bol.com Techlab
 
PDF
The hitchhiker’s guide to Prometheus
Bol.com Techlab
 
PDF
Prometheus Course from beginners to expert course
anil490062
 
PDF
Time series denver an introduction to prometheus
Bob Cotton
 
PDF
Prometheus kubernetes tech talk
Chandresh Pancholi
 
PDF
ApacheCon2019 Talk: Improving the Observability of Cassandra, Kafka and Kuber...
Paul Brebner
 
PDF
Prometheus
Mike Frampton
 
PDF
Prometheus course
Jorn Jambers
 
PDF
DevOps Braga #15: Agentless monitoring with icinga and prometheus
DevOps Braga
 
PPTX
Prometheus
Aakanksha Mane
 
PPTX
How to Improve the Observability of Apache Cassandra and Kafka applications...
Paul Brebner
 
PDF
Prometheus_Alertmanager_Presentation.pdf
ajithkumar29b
 
Monitoring Cloud Native Applications with Prometheus
Jacopo Nardiello
 
Monitoring in Big Data Platform - Albert Lewandowski, GetInData
GetInData
 
MeetUp Monitoring with Prometheus and Grafana (September 2018)
Lucas Jellema
 
Prometheus workshop
OpsTree solutions
 
Monitoring Kubernetes with Prometheus (Kubernetes Ireland, 2016)
Brian Brazil
 
Jacopo Nardiello - Monitoring Cloud-Native applications with Prometheus - Cod...
Codemotion
 
Prometheus Training
Tim Tyler
 
Prometheus monitoring
Hien Nguyen Van
 
The hitchhiker’s guide to Prometheus
Bol.com Techlab
 
The hitchhiker’s guide to Prometheus
Bol.com Techlab
 
Prometheus Course from beginners to expert course
anil490062
 
Time series denver an introduction to prometheus
Bob Cotton
 
Prometheus kubernetes tech talk
Chandresh Pancholi
 
ApacheCon2019 Talk: Improving the Observability of Cassandra, Kafka and Kuber...
Paul Brebner
 
Prometheus
Mike Frampton
 
Prometheus course
Jorn Jambers
 
DevOps Braga #15: Agentless monitoring with icinga and prometheus
DevOps Braga
 
Prometheus
Aakanksha Mane
 
How to Improve the Observability of Apache Cassandra and Kafka applications...
Paul Brebner
 
Prometheus_Alertmanager_Presentation.pdf
ajithkumar29b
 
Ad

More from Juraj Hantak (20)

PDF
Kubernetes day 2_jozef_halgas_pf
Juraj Hantak
 
PDF
Kubernetes day 2 @ zse energia
Juraj Hantak
 
PDF
Dev ops culture_final
Juraj Hantak
 
PDF
Promise of DevOps
Juraj Hantak
 
PDF
23 meetup rancher
Juraj Hantak
 
PDF
Integracia security do ci cd pipelines
Juraj Hantak
 
PDF
CNCF opa
Juraj Hantak
 
PDF
Secrets management vault cncf meetup
Juraj Hantak
 
PDF
Introductiontohelmcharts2021
Juraj Hantak
 
PDF
Intro to creating kubernetes operators
Juraj Hantak
 
PDF
19. stretnutie komunity kubernetes
Juraj Hantak
 
PDF
16. Cncf meetup-docker
Juraj Hantak
 
PDF
16. meetup sietovy model v kubernetes
Juraj Hantak
 
PDF
16.meetup uvod
Juraj Hantak
 
PDF
14. meetup
Juraj Hantak
 
PDF
Terraform a gitlab ci
Juraj Hantak
 
PDF
Monitoring with prometheus at scale
Juraj Hantak
 
PDF
Kubernetes monitoring using prometheus stack
Juraj Hantak
 
PDF
12.cncfsk meetup observability and analysis
Juraj Hantak
 
PDF
Grafana 7.0
Juraj Hantak
 
Kubernetes day 2_jozef_halgas_pf
Juraj Hantak
 
Kubernetes day 2 @ zse energia
Juraj Hantak
 
Dev ops culture_final
Juraj Hantak
 
Promise of DevOps
Juraj Hantak
 
23 meetup rancher
Juraj Hantak
 
Integracia security do ci cd pipelines
Juraj Hantak
 
CNCF opa
Juraj Hantak
 
Secrets management vault cncf meetup
Juraj Hantak
 
Introductiontohelmcharts2021
Juraj Hantak
 
Intro to creating kubernetes operators
Juraj Hantak
 
19. stretnutie komunity kubernetes
Juraj Hantak
 
16. Cncf meetup-docker
Juraj Hantak
 
16. meetup sietovy model v kubernetes
Juraj Hantak
 
16.meetup uvod
Juraj Hantak
 
14. meetup
Juraj Hantak
 
Terraform a gitlab ci
Juraj Hantak
 
Monitoring with prometheus at scale
Juraj Hantak
 
Kubernetes monitoring using prometheus stack
Juraj Hantak
 
12.cncfsk meetup observability and analysis
Juraj Hantak
 
Grafana 7.0
Juraj Hantak
 
Ad

Recently uploaded (20)

PPTX
B2B_Ecommerce_Internship_Simranpreet.pptx
LipakshiJindal
 
PPT
Introduction to dns domain name syst.ppt
MUHAMMADKAVISHSHABAN
 
PDF
LOGENVIDAD DANNYFGRETRRTTRRRTRRRRRRRRR.pdf
juan456ytpro
 
DOCX
An_Operating_System by chidi kingsley wo
kingsleywokocha4
 
PPTX
Perkembangan Perangkat jaringan komputer dan telekomunikasi 3.pptx
Prayudha3
 
PPTX
Different Generation Of Computers .pptx
divcoder9507
 
PDF
The Internet of Things (IoT) refers to a vast network of interconnected devic...
chethana8182
 
PDF
Latest Scam Shocking the USA in 2025.pdf
onlinescamreport4
 
PPTX
The Latest Scam Shocking the USA in 2025.pptx
onlinescamreport4
 
PDF
GEO Strategy 2025: Complete Presentation Deck for AI-Powered Customer Acquisi...
Zam Man
 
PDF
UI/UX Developer Guide: Tools, Trends, and Tips for 2025
Penguin peak
 
PPTX
Blue and Dark Blue Modern Technology Presentation.pptx
ap177979
 
PPTX
Artificial-Intelligence-in-Daily-Life (2).pptx
nidhigoswami335
 
PDF
How Much GB RAM Do You Need for Coding? 5 Powerful Reasons 8GB Is More Than E...
freeshopbudget
 
PPTX
Pengenalan perangkat Jaringan komputer pada teknik jaringan komputer dan tele...
Prayudha3
 
PPTX
The Internet of Things (IoT) refers to a vast network of interconnected devic...
chethana8182
 
PPTX
原版北不列颠哥伦比亚大学毕业证文凭UNBC成绩单2025年新版在线制作学位证书
e7nw4o4
 
PPTX
How tech helps people in the modern era.
upadhyayaryan154
 
PDF
Data Protection & Resilience in Focus.pdf
AmyPoblete3
 
PPT
1965 INDO PAK WAR which Pak will never forget.ppt
sanjaychief112
 
B2B_Ecommerce_Internship_Simranpreet.pptx
LipakshiJindal
 
Introduction to dns domain name syst.ppt
MUHAMMADKAVISHSHABAN
 
LOGENVIDAD DANNYFGRETRRTTRRRTRRRRRRRRR.pdf
juan456ytpro
 
An_Operating_System by chidi kingsley wo
kingsleywokocha4
 
Perkembangan Perangkat jaringan komputer dan telekomunikasi 3.pptx
Prayudha3
 
Different Generation Of Computers .pptx
divcoder9507
 
The Internet of Things (IoT) refers to a vast network of interconnected devic...
chethana8182
 
Latest Scam Shocking the USA in 2025.pdf
onlinescamreport4
 
The Latest Scam Shocking the USA in 2025.pptx
onlinescamreport4
 
GEO Strategy 2025: Complete Presentation Deck for AI-Powered Customer Acquisi...
Zam Man
 
UI/UX Developer Guide: Tools, Trends, and Tips for 2025
Penguin peak
 
Blue and Dark Blue Modern Technology Presentation.pptx
ap177979
 
Artificial-Intelligence-in-Daily-Life (2).pptx
nidhigoswami335
 
How Much GB RAM Do You Need for Coding? 5 Powerful Reasons 8GB Is More Than E...
freeshopbudget
 
Pengenalan perangkat Jaringan komputer pada teknik jaringan komputer dan tele...
Prayudha3
 
The Internet of Things (IoT) refers to a vast network of interconnected devic...
chethana8182
 
原版北不列颠哥伦比亚大学毕业证文凭UNBC成绩单2025年新版在线制作学位证书
e7nw4o4
 
How tech helps people in the modern era.
upadhyayaryan154
 
Data Protection & Resilience in Focus.pdf
AmyPoblete3
 
1965 INDO PAK WAR which Pak will never forget.ppt
sanjaychief112
 

Prometheus - basics