使用 Prometheus 監控 Kubernetes Cluster
Download as PPTX, PDF5 likes2,521 views

The document discusses monitoring Kubernetes clusters using Prometheus and Grafana. It describes how Prometheus scrapes metrics using exporters like Node Exporter and stores them in a time series database. Grafana is used to build dashboards and visualize the metrics collected by Prometheus. It provides configuration details for deploying Prometheus, Node Exporter, and Grafana as Kubernetes deployments and accessing the services.


![Copyright 2016 ITRI 工業技術研究院
使用RBAC創建Cluster Role並設置訪問權限
apiVersion: rbac.authorization.k8s.io/v1beta1
kind: ClusterRole
metadata:
name: prometheus
rules:
- apiGroups: ["", "extensions", "apps"]
resources:
- nodes
- nodes/proxy
- services
- endpoints
- pods
- deployments
- services
verbs: ["get", "list", "watch"]
- nonResourceURLs: ["/metrics"]
verbs: ["get"]
apiVersion: v1
kind: ServiceAccount
metadata:
name: prometheus
namespace: default
---
apiVersion: rbac.authorization.k8s.io/v1beta1
kind: ClusterRoleBinding
metadata:
name: prometheus
roleRef:
apiGroup: rbac.authorization.k8s.io
kind: ClusterRole
name: prometheus
subjects:
- kind: ServiceAccount
name: prometheus
namespace: default](https://image.slidesharecdn.com/kubernetesmonitoringbyprometheus-180517024510/85/Prometheus-Kubernetes-Cluster-8-320.jpg)

![Copyright 2016 ITRI 工業技術研究院
prometheus-ConfigMap.yaml
apiVersion: v1
kind: ConfigMap
metadata:
name: prometheus-server-conf
labels:
name: prometheus-server-conf
namespace: default
data:
prometheus.yml: |-
global:
scrape_interval: 15s
scrape_configs:
- job_name: 'kubernetes-apiservers'
kubernetes_sd_configs:
- role: endpoints
scheme: https
tls_config:
ca_file: /var/run/secrets/kubernetes.io/serviceaccount/ca.crt
bearer_token_file: /var/run/secrets/kubernetes.io/serviceaccount/token
relabel_configs:
- source_labels: [__meta_kubernetes_namespace, __meta_kubernetes_service_name, __meta_kubernetes_endpoint_port_name]
action: keep
regex: default;kubernetes;https](https://image.slidesharecdn.com/kubernetesmonitoringbyprometheus-180517024510/85/Prometheus-Kubernetes-Cluster-10-320.jpg)
![Copyright 2016 ITRI 工業技術研究院
prometheus-ConfigMap.yaml
- job_name: 'kubernetes-nodes'
scheme: https
tls_config:
ca_file: /var/run/secrets/kubernetes.io/serviceaccount/ca.crt
bearer_token_file: /var/run/secrets/kubernetes.io/serviceaccount/token
kubernetes_sd_configs:
- role: node
relabel_configs:
- action: labelmap
regex: __meta_kubernetes_node_label_(.+)
- target_label: __address__
replacement: kubernetes.default.svc:443
- source_labels: [__meta_kubernetes_node_name]
regex: (.+)
target_label: __metrics_path__
replacement: /api/v1/nodes/${1}/proxy/metrics](https://image.slidesharecdn.com/kubernetesmonitoringbyprometheus-180517024510/85/Prometheus-Kubernetes-Cluster-11-320.jpg)
![Copyright 2016 ITRI 工業技術研究院
- job_name: 'kubernetes-pods'
kubernetes_sd_configs:
- role: pod
relabel_configs:
- source_labels: [__meta_kubernetes_pod_annotation_prometheus_io_scrape]
action: keep
regex: true
- source_labels: [__meta_kubernetes_pod_annotation_prometheus_io_path]
action: replace
target_label: __metrics_path__
regex: (.+)
- source_labels: [__address__, __meta_kubernetes_pod_annotation_prometheus_io_port]
action: replace
regex: ([^:]+)(?::d+)?;(d+)
replacement: $1:$2
target_label: __address__
- action: labelmap
regex: __meta_kubernetes_pod_label_(.+)
- source_labels: [__meta_kubernetes_namespace]
action: replace
target_label: kubernetes_namespace
- source_labels: [__meta_kubernetes_pod_name]
action: replace
target_label: kubernetes_pod_name
prometheus-ConfigMap.yaml](https://image.slidesharecdn.com/kubernetesmonitoringbyprometheus-180517024510/85/Prometheus-Kubernetes-Cluster-12-320.jpg)
![Copyright 2016 ITRI 工業技術研究院
prometheus-ConfigMap.yaml
- job_name: 'kubernetes-service-endpoints'
kubernetes_sd_configs:
- role: endpoints
relabel_configs:
- source_labels: [__meta_kubernetes_service_annotation_prometheus_io_scrape]
action: keep
regex: true
- source_labels: [__meta_kubernetes_service_annotation_prometheus_io_scheme]
action: replace
target_label: __scheme__
regex: (https?)
- source_labels: [__meta_kubernetes_service_annotation_prometheus_io_path]
action: replace
target_label: __metrics_path__
regex: (.+)
- source_labels: [__address__, __meta_kubernetes_service_annotation_prometheus_io_port]
action: replace
target_label: __address__
regex: ([^:]+)(?::d+)?;(d+)
replacement: $1:$2
- action: labelmap
regex: __meta_kubernetes_service_label_(.+)
- source_labels: [__meta_kubernetes_namespace]
action: replace
target_label: kubernetes_namespace
- source_labels: [__meta_kubernetes_service_name]
action: replace
target_label: kubernetes_name](https://image.slidesharecdn.com/kubernetesmonitoringbyprometheus-180517024510/85/Prometheus-Kubernetes-Cluster-13-320.jpg)
![Copyright 2016 ITRI 工業技術研究院
nvidia_smi_exporter
到每台GPU-node做以下步驟
1.下載並執行nvidia_smi_exporter
git clone https://github.com/kevin7674/nvidia_smi_exporter.git
cd nvidia_smi_exporter
./nvidia_smi_exporter 9101 &
2.修改 vi /etc/rc.local
./nvidia_smi_exporter 9101 &
修改Prometheus-configmap.yaml
- job_name: "nvidia_smi_exporter"
static_configs:
- targets: [‘Node_IP:9101']
- targets: [‘Node_IP:9101']](https://image.slidesharecdn.com/kubernetesmonitoringbyprometheus-180517024510/85/Prometheus-Kubernetes-Cluster-15-320.jpg)


![Copyright 2016 ITRI 工業技術研究院
sum by (pod_name)( rate(container_cpu_usage_seconds_total{image!="", pod_name!=""}[1m] ) )](https://image.slidesharecdn.com/kubernetesmonitoringbyprometheus-180517024510/85/Prometheus-Kubernetes-Cluster-22-320.jpg)


![Copyright 2016 ITRI 工業技術研究院
apiVersion: v1
kind: ConfigMap
metadata:
name: prometheus-server-conf
labels:
name: prometheus-server-conf
namespace: default
data:
prometheus.yml: |-
global:
scrape_interval: 15s
rule_files:
- '/etc/prometheus-rules/alert.rules'
alerting:
alertmanagers:
- static_configs:
- targets: ["10.241.1.11:30009"]
修改prometheus-ConfigMap.yaml](https://image.slidesharecdn.com/kubernetesmonitoringbyprometheus-180517024510/85/Prometheus-Kubernetes-Cluster-37-320.jpg)
![Copyright 2016 ITRI 工業技術研究院
apiVersion: v1
kind: ConfigMap
metadata:
name: prometheus-alert-rules
data:
alert.rules: |-
ALERT GPUHighTemperature
IF nvidia_temperature_gpu{instance="10.241.1.22:9101",gpu="Tesla V100-SXM2-16GB[0]"} > 25
FOR 1m
ANNOTATIONS {
summary = "{{$labels.instance}}: GPU Temperature High",
description = "{{$labels.instance}}: This GPU Temperature has really high for over 1m",
}
Alert-rules-configmap.yaml](https://image.slidesharecdn.com/kubernetesmonitoringbyprometheus-180517024510/85/Prometheus-Kubernetes-Cluster-38-320.jpg)


![Copyright 2016 ITRI 工業技術研究院
Alert Mail設置
修改 grafana image 設定發信功能
docker run -d -p 3000:3000 monitoringartist/grafana-xxl
docker ps
docker exec -ti <container_ID> sh
apt-get update
apt-get install vim
vim /usr/share/grafana/conf/defaults.ini
SMTP / Emailing [smtp]
enabled = true
host = smtp.gmail.com:587
user = itriccmabin@gmail.com
password =“XXXX"
cert_file =
key_file =
skip_verify = false
from_address = itriccmabin@gmail.com
from_name = DNN_Monitor
[emails] welcome_email_on_sign_up = false templates_pattern = emails/*.html](https://image.slidesharecdn.com/kubernetesmonitoringbyprometheus-180517024510/85/Prometheus-Kubernetes-Cluster-43-320.jpg)


使用 Prometheus 監控 Kubernetes Cluster
- 1. Kubernetes monitoring by Prometheus and Grafana Kevin Jen Div X/ICL 2018/04/27
- 2. Copyright 2016 ITRI 工業技術研究院 個人簡介 • 任博煜 Kevin Jen • 工研院資通所 • 資料中心與雲端應用軟體組 • 協助整合以及維運由Kubernetes 搭建的 ITRI DNN Farm
- 3. Copyright 2016 ITRI 工業技術研究院 Tools Prometheus This is the central piece, it contains the time series database and the logic of scraping stats from exporters (see below) as well as alerts. Node-exporter A Node Exporter to export system metrics in a Prometheus-compatible format. There are many other types of expoter ,like container expoter or snmp expoter. Nvidia-smi-exporter nvidia-smi metrics exporter for Prometheus Grafana A web-based graphical dashboard builder that supports Prometheus
- 4. Copyright 2016 ITRI 工業技術研究院 What is Prometheus • Prometheus is an open-source systems monitoring and alerting toolkit originally built at SoundCloud. • Since its inception in 2012, many companies and organizations have adopted Prometheus, and the project has a very active developer and user community. It is now a standalone open source project and maintained independently of any company. • To emphasize this and clarify the project's governance structure, Prometheus joined the Cloud Native Computing Foundation in 2016 as the second hosted project after Kubernetes.
- 5. Copyright 2016 ITRI 工業技術研究院 Features • A multi-dimensional data model (time series identified by metric name and key/value pairs) • A flexible query language to leverage this dimensionality • Targets are discovered via service discovery or static configuration
- 6. Copyright 2016 ITRI 工業技術研究院 Grafana • Grafana is an open source metric analytics & visualization suite. • Prometheus delegates the heavy lifting of proper graphical displays and dashboards to Grafana. • Grafana features pluggable panels and data sources allowing easy extensibility and a variety of panels, including fully featured graph panels with rich visualization options. • Easily create alert rules from within the UI and have them be continually evaluated by the Grafana backend.
- 7. Copyright 2016 ITRI 工業技術研究院 部署 kubectl create -f node-exporter.yaml kubectl create -f rbac-setup.yaml.yaml kubectl create -f prometheus-config-map.yaml kubectl create -f prometheus-deploy.yaml kubectl create -f grafana-deploy.yaml git clone https://github.com/kevin7674/prometheus.git cd Prometheus 下載 部署 檢查 kubectl get pod
- 8. Copyright 2016 ITRI 工業技術研究院 使用RBAC創建Cluster Role並設置訪問權限 apiVersion: rbac.authorization.k8s.io/v1beta1 kind: ClusterRole metadata: name: prometheus rules: - apiGroups: ["", "extensions", "apps"] resources: - nodes - nodes/proxy - services - endpoints - pods - deployments - services verbs: ["get", "list", "watch"] - nonResourceURLs: ["/metrics"] verbs: ["get"] apiVersion: v1 kind: ServiceAccount metadata: name: prometheus namespace: default --- apiVersion: rbac.authorization.k8s.io/v1beta1 kind: ClusterRoleBinding metadata: name: prometheus roleRef: apiGroup: rbac.authorization.k8s.io kind: ClusterRole name: prometheus subjects: - kind: ServiceAccount name: prometheus namespace: default
- 9. Copyright 2016 ITRI 工業技術研究院 node-exporter.yaml apiVersion: extensions/v1beta1 kind: DaemonSet metadata: name: node-exporter spec: template: metadata: labels: app: node-exporter name: node-exporter spec: containers: - image: prom/node-exporter:latest name: node-exporter ports: - containerPort: 9100 hostPort: 9100 name: scrape hostNetwork: true hostPID: true restartPolicy: Always apiVersion: v1 kind: Service metadata: annotations: prometheus.io/scrape: 'true' labels: app: node-exporter name: node-exporter name: node-exporter spec: clusterIP: None ports: - name: scrape port: 9100 protocol: TCP selector: app: node-exporter type: ClusterIP
- 10. Copyright 2016 ITRI 工業技術研究院 prometheus-ConfigMap.yaml apiVersion: v1 kind: ConfigMap metadata: name: prometheus-server-conf labels: name: prometheus-server-conf namespace: default data: prometheus.yml: |- global: scrape_interval: 15s scrape_configs: - job_name: 'kubernetes-apiservers' kubernetes_sd_configs: - role: endpoints scheme: https tls_config: ca_file: /var/run/secrets/kubernetes.io/serviceaccount/ca.crt bearer_token_file: /var/run/secrets/kubernetes.io/serviceaccount/token relabel_configs: - source_labels: [__meta_kubernetes_namespace, __meta_kubernetes_service_name, __meta_kubernetes_endpoint_port_name] action: keep regex: default;kubernetes;https
- 11. Copyright 2016 ITRI 工業技術研究院 prometheus-ConfigMap.yaml - job_name: 'kubernetes-nodes' scheme: https tls_config: ca_file: /var/run/secrets/kubernetes.io/serviceaccount/ca.crt bearer_token_file: /var/run/secrets/kubernetes.io/serviceaccount/token kubernetes_sd_configs: - role: node relabel_configs: - action: labelmap regex: __meta_kubernetes_node_label_(.+) - target_label: __address__ replacement: kubernetes.default.svc:443 - source_labels: [__meta_kubernetes_node_name] regex: (.+) target_label: __metrics_path__ replacement: /api/v1/nodes/${1}/proxy/metrics
- 12. Copyright 2016 ITRI 工業技術研究院 - job_name: 'kubernetes-pods' kubernetes_sd_configs: - role: pod relabel_configs: - source_labels: [__meta_kubernetes_pod_annotation_prometheus_io_scrape] action: keep regex: true - source_labels: [__meta_kubernetes_pod_annotation_prometheus_io_path] action: replace target_label: __metrics_path__ regex: (.+) - source_labels: [__address__, __meta_kubernetes_pod_annotation_prometheus_io_port] action: replace regex: ([^:]+)(?::d+)?;(d+) replacement: $1:$2 target_label: __address__ - action: labelmap regex: __meta_kubernetes_pod_label_(.+) - source_labels: [__meta_kubernetes_namespace] action: replace target_label: kubernetes_namespace - source_labels: [__meta_kubernetes_pod_name] action: replace target_label: kubernetes_pod_name prometheus-ConfigMap.yaml
- 13. Copyright 2016 ITRI 工業技術研究院 prometheus-ConfigMap.yaml - job_name: 'kubernetes-service-endpoints' kubernetes_sd_configs: - role: endpoints relabel_configs: - source_labels: [__meta_kubernetes_service_annotation_prometheus_io_scrape] action: keep regex: true - source_labels: [__meta_kubernetes_service_annotation_prometheus_io_scheme] action: replace target_label: __scheme__ regex: (https?) - source_labels: [__meta_kubernetes_service_annotation_prometheus_io_path] action: replace target_label: __metrics_path__ regex: (.+) - source_labels: [__address__, __meta_kubernetes_service_annotation_prometheus_io_port] action: replace target_label: __address__ regex: ([^:]+)(?::d+)?;(d+) replacement: $1:$2 - action: labelmap regex: __meta_kubernetes_service_label_(.+) - source_labels: [__meta_kubernetes_namespace] action: replace target_label: kubernetes_namespace - source_labels: [__meta_kubernetes_service_name] action: replace target_label: kubernetes_name
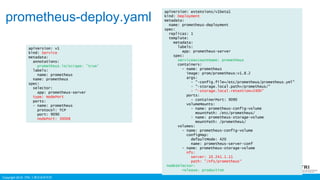
- 14. Copyright 2016 ITRI 工業技術研究院 prometheus-deploy.yaml apiVersion: extensions/v1beta1 kind: Deployment metadata: name: prometheus-deployment spec: replicas: 1 template: metadata: labels: app: prometheus-server spec: serviceAccountName: prometheus containers: - name: prometheus image: prom/prometheus:v1.8.2 args: - "-config.file=/etc/prometheus/prometheus.yml" - "-storage.local.path=/prometheus/" - "-storage.local.retention=240h" ports: - containerPort: 9090 volumeMounts: - name: prometheus-config-volume mountPath: /etc/prometheus/ - name: prometheus-storage-volume mountPath: /prometheus/ volumes: - name: prometheus-config-volume configMap: defaultMode: 420 name: prometheus-server-conf - name: prometheus-storage-volume nfs: server: 10.241.1.11 path: "/nfs/prometheus“ nodeSelector: release: production apiVersion: v1 kind: Service metadata: annotations: prometheus.io/scrape: 'true' labels: name: prometheus name: prometheus spec: selector: app: prometheus-server type: NodePort ports: - name: prometheus protocol: TCP port: 9090 nodePort: 30008
- 15. Copyright 2016 ITRI 工業技術研究院 nvidia_smi_exporter 到每台GPU-node做以下步驟 1.下載並執行nvidia_smi_exporter git clone https://github.com/kevin7674/nvidia_smi_exporter.git cd nvidia_smi_exporter ./nvidia_smi_exporter 9101 & 2.修改 vi /etc/rc.local ./nvidia_smi_exporter 9101 & 修改Prometheus-configmap.yaml - job_name: "nvidia_smi_exporter" static_configs: - targets: [‘Node_IP:9101'] - targets: [‘Node_IP:9101']
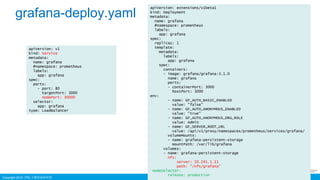
- 16. Copyright 2016 ITRI 工業技術研究院 grafana-deploy.yaml apiVersion: extensions/v1beta1 kind: Deployment metadata: name: grafana #namespace: prometheus labels: app: grafana spec: replicas: 1 template: metadata: labels: app: grafana spec: containers: - image: grafana/grafana:3.1.0 name: grafana ports: - containerPort: 3000 hostPort: 3000 env: - name: GF_AUTH_BASIC_ENABLED value: "false" - name: GF_AUTH_ANONYMOUS_ENABLED value: "true" - name: GF_AUTH_ANONYMOUS_ORG_ROLE value: Admin - name: GF_SERVER_ROOT_URL value: /api/v1/proxy/namespaces/prometheus/services/grafana/ volumeMounts: - name: grafana-persistent-storage mountPath: /var/lib/grafana volumes: - name: grafana-persistent-storage nfs: server: 10.241.1.11 path: "/nfs/grafana“ nodeSelector: release: production apiVersion: v1 kind: Service metadata: name: grafana #namespace: prometheus labels: app: grafana spec: ports: - port: 80 targetPort: 3000 nodePort: 30000 selector: app: grafana type: LoadBalancer
- 17. Copyright 2016 ITRI 工業技術研究院
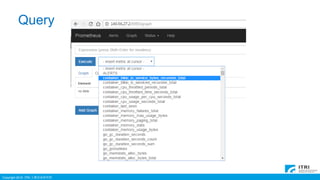
- 18. Copyright 2016 ITRI 工業技術研究院 Query
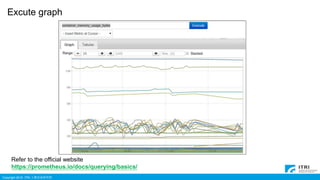
- 19. Copyright 2016 ITRI 工業技術研究院 Excute graph Refer to the official website https://prometheus.io/docs/querying/basics/
- 20. Copyright 2016 ITRI 工業技術研究院 Slice & Dice container_memory_usage_bytes{name="consul-server"}
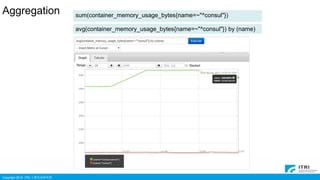
- 21. Copyright 2016 ITRI 工業技術研究院 Aggregation sum(container_memory_usage_bytes{name=~"^consul"}) avg(container_memory_usage_bytes{name=~"^consul"}) by (name)
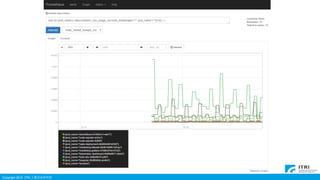
- 22. Copyright 2016 ITRI 工業技術研究院 sum by (pod_name)( rate(container_cpu_usage_seconds_total{image!="", pod_name!=""}[1m] ) )
- 23. Copyright 2016 ITRI 工業技術研究院
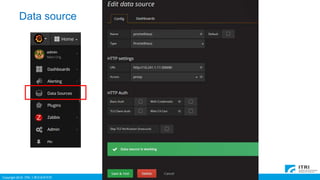
- 24. Copyright 2016 ITRI 工業技術研究院 Data source
- 25. Copyright 2016 ITRI 工業技術研究院 Dashboard Creating a new dashboard and add a graph panel.
- 26. Copyright 2016 ITRI 工業技術研究院 Edit
- 27. Copyright 2016 ITRI 工業技術研究院 Creating a Prometheus graph by querying metrics.
- 28. Copyright 2016 ITRI 工業技術研究院 平台基礎資源監控 監控項目包含: • Prometheus 透過node-exporter做為agent,收集node上的資源使用狀況: (服務節點數量、CPU使用率、Memory使用量、Filesystem Space、Host Temperature、Network I/O) • Kubernetes和基礎服務是否存活: (kubelet、Registry、API Server、NFS Server)
- 29. Copyright 2016 ITRI 工業技術研究院
- 30. Copyright 2016 ITRI 工業技術研究院 Container監控 • Prometheus透過kubernetes API得到container資源使用狀態。 • Container監控項目 : (Pod名稱、數量、使否存活、CPU使用率、 Memory使用量、Filesystem、I/O)
- 31. Copyright 2016 ITRI 工業技術研究院
- 32. Copyright 2016 ITRI 工業技術研究院 GPU監控 • 每一台GPU Node利用nvidia-smi exporter做為agent回報資訊, 再由prometheu統一收集、達到監控。 • GPU監控項目: (GPU使用率、GPU溫度)
- 33. Copyright 2016 ITRI 工業技術研究院
- 34. Copyright 2016 ITRI 工業技術研究院
- 35. Copyright 2016 ITRI 工業技術研究院
- 36. Copyright 2016 ITRI 工業技術研究院 apiVersion: extensions/v1beta1 kind: Deployment metadata: name: alertmanager-deployment spec: replicas: 1 template: metadata: labels: app: prometheus-server spec: containers: - name: alertmanager image: quay.io/prometheus/alertmanager:v0.10.0 args: - "-config.file=/etc/prometheus/config.yml" - "-storage.path=/alertmanager" ports: - containerPort: 9093 protocol: TCP name: http volumeMounts: - name: alertmanager-config-volume mountPath: /etc/prometheus volumes: - name: alertmanager-config-volume configMap: name: alertmanager nodeSelector: release: production Alertmanager-deploy.yaml
- 37. Copyright 2016 ITRI 工業技術研究院 apiVersion: v1 kind: ConfigMap metadata: name: prometheus-server-conf labels: name: prometheus-server-conf namespace: default data: prometheus.yml: |- global: scrape_interval: 15s rule_files: - '/etc/prometheus-rules/alert.rules' alerting: alertmanagers: - static_configs: - targets: ["10.241.1.11:30009"] 修改prometheus-ConfigMap.yaml
- 38. Copyright 2016 ITRI 工業技術研究院 apiVersion: v1 kind: ConfigMap metadata: name: prometheus-alert-rules data: alert.rules: |- ALERT GPUHighTemperature IF nvidia_temperature_gpu{instance="10.241.1.22:9101",gpu="Tesla V100-SXM2-16GB[0]"} > 25 FOR 1m ANNOTATIONS { summary = "{{$labels.instance}}: GPU Temperature High", description = "{{$labels.instance}}: This GPU Temperature has really high for over 1m", } Alert-rules-configmap.yaml
- 39. Copyright 2016 ITRI 工業技術研究院
- 40. Copyright 2016 ITRI 工業技術研究院 Grafana Alert
- 41. Copyright 2016 ITRI 工業技術研究院 Grafana Alert
- 42. Copyright 2016 ITRI 工業技術研究院
- 43. Copyright 2016 ITRI 工業技術研究院 Alert Mail設置 修改 grafana image 設定發信功能 docker run -d -p 3000:3000 monitoringartist/grafana-xxl docker ps docker exec -ti <container_ID> sh apt-get update apt-get install vim vim /usr/share/grafana/conf/defaults.ini SMTP / Emailing [smtp] enabled = true host = smtp.gmail.com:587 user = [email protected] password =“XXXX" cert_file = key_file = skip_verify = false from_address = [email protected] from_name = DNN_Monitor [emails] welcome_email_on_sign_up = false templates_pattern = emails/*.html
- 44. Copyright 2016 ITRI 工業技術研究院
- 45. Copyright 2016 ITRI 工業技術研究院
Editor's Notes
- #3: 工研院DNN Farm 利用Kubernetes來管理Container ,提供客戶使用具有GPU效能和NN相關工具的Container環境來做DNN training。
- #4: Prometheus派出 daemon 負責定時去目標上抓取 metrics(指標) 數據, 根據得到的數據去建立一個 time series database 2. node-exporters會自動從 Linux內核中收集所有有用的指標 (Host上的CPU 、Memory 、Filesystem) 3. nvidia-smi 是nvidia driver內建的指令工具,只要有裝nvidia driver可以直接查詢驅動程式與顯示卡的各種資訊。 https://blog.gtwang.org/linux/how-to-get-the-nvidia-driver-version-from-the-command-line/ 4. Grafana是一套dashboard 工具,利用 監控軟體 收集來的time sries database 繪製出數據圖形 他擁有豐富 精美 且靈活的 dashboard,多種模式的圖形和儀表板支持
- #5: Prometheus是一套結合了 Alert 功能 & time sireis database的 開源監控系統,起始是由SoundCloud公司開發的。 自2012年成立以來,許多公司和組織都採用了Prometheus,該項目擁有 (非常活躍的developers社群)。 它現在是一個獨立的開源項目,並獨立於任何公司維護。為了強調這一點並澄清項目治理結構, Prometheus於2016年加入了Cloud Native Computing Foundation,作為Kubernetes之後的第二個託管項目。 Kubernetes容器管理系統中,早期使用influx db+heapster的方案,但是因為Prometheus突出的性能, 後來k8s使用者幾乎都改成使用Prometheus進行監控。 Prometheus的實現參考了谷歌內部的監控實現,與源自谷歌的Kubernetes結合起來非常合適。 相比influxdb的方案,性能更加突出,而且還內置了報警功能。
- #6: 1.(目標通過服務發現或靜態配置發現),有別於傳統的監控軟體。 一開始就要知道要監控什麼項目,再去尋找對應的資訊的觀念相反。 是先將所有的指標先收集回來,再來慢慢觀察有什麼可以監控,進而篩選需要的資訊。 拉取式的數據採集方式,你只需要在應用裡面實現一個metrics接口, 把然後這個接口告訴Prometheus就可以完成數據採集了,大大降低了運維的負擔。 這種動態發現的架構,非常適合像docker Kubernetes這種大規模的集群環境, 服務器和程序都不固定的(容器化的動態基礎設施)中使用, 可以一次監測 整個服務群集(cluster) 而不是單一服務(instance)。 2.多維度數據模型 (由各種metrics name和值 組成的time series) 3. 靈活的查詢語言(利用多維度指標 查詢和繪製數據) 可以簡單的查到想要的數據同時繪出圖形
- #7: Grafana是一个開源指標分析和視覺化套件。 Prometheus在早期的版本,使用自己的prom dash,不過後來刪除這個功能,將dashboard的工作全部委托给Grafana。 Grafana具有可插拔 面板和data source,可以實現 輕鬆的擴展和各種面板,有 豐富視覺化選向 和 功能完整的圖形面板。 從UI界面中輕鬆創建警報規則,並讓他們由Grafana后端持续评估。 支援其他產品 (目前市面上絕大多數的監控軟體都自主性的研發plugin 來跟grafana做整合)
- #8: 佈署 Git clone kubectl
- #9: Kubernetes在1.7.0之後啟用了RBAC特性,因此我們需要先通過RBAC授權, 然後Prometheus通過RBAC連接Kubernetes集群,否則被拒絕後,將無法連接到K8s的API-SERVER prometheus.rbac.yml定義了Prometheus容器訪問k8s apiserver所需的 ServiceAccount和ClusterRole及ClusterRoleBinding,確保Prometheus可以訪問到kubernetes API 官方github: https://github.com/prometheus/prometheus/tree/master/documentation/examples Role-based access control
- #10: Service用來暴露服務 在Service中定義標註prometheus.io/scrape: 'true',表明該Service需要被prometheus發現並採集數據 用於監控底層的服務器指標,官方解釋: Prometheus exporter for hardware and OS metrics exposed by *NIX kernels, written in Go with pluggable metric collectors. 如果在Pod中使用hostNetwork:true配置的話。在主機的所有網絡接口上都可以訪問到該應用程序。
- #11: Configmap 用來定義Prometheus 如何去發現資料 kubernetes在部署完成後會在每個主機節點上內置cAdvisor, 因此可以直接用過cAdvisor提供的metrics接口獲取到所有容器相關的性能指標數據。 Prometheus透過kubernetes的API動態發現採集的目標Target信息, 包括kubernetes下的node,service,pod,endpoints等信息。 通过DNS地址 https://kubernetes.default.svc 访问kubernetes的Rest API. relabel_config。 就如字面意思而言,它的作用是Prometheus 抓取metrics 之前,就將對象相關的labels 重寫。幾個重要的label: __address__:默認為host:port,也是之後抓取之後instance 的值; __scheme__:http or https ?; __metrics_path__:就是metrics path,默認為/metrics; __param_${name}:用來作為URL parameter,比如http://…/metrics?name=value; __meta_:這個開頭的配置都是SD 相關的配置; Kubernetes SD 其次,上次提到,我們可以用到Service Discovery這個功能,其中就包含Kubernetes SD。 它包含四種角色: node service pod endpoints
- #12: Kubernetes SD 其次,上次提到,我們可以用到Service Discovery這個功能,其中就包含Kubernetes SD。 它包含四種角色: endpoints node service pod
- #15: 在Service中定義標註prometheus.io/scrape: 'true',表明該Service需要被prometheus發現並採集數據 Kubernetes中的service默認情況下都是使用的ClusterIP這種類型,這個IP只能在集群內部訪問,要想讓外部能夠直接訪問service,需要將service type修改為nodePort。 這裡我們明確使用了上一步定義的 Service Acoount
- #16: 目前kubernetes的版本無法在不同的container中共享GPU資源, 如果透過k8s去部屬nvidia_smi_exporter,會造成監控和被監控的container互搶。 -------------------------------------------------------- nvidia_smi_exporter原理是透過nvidia_smi去要GPU資料, 然後重新依時間做parse讓prometheus去採集。 Exact command nvidia-smi --query-gpu=name,index,temperature.gpu,utilization.gpu,utilization.memory,memory.total,memory.free,memory.used --format=csv,noheader,nounits ------------------------------------------------------------------------------------------ docker run -d --net="host" nvidia_smi_exporter:0 --restart=always
- #18: 頁面的網址就是 IP + Service_nodeport
- #21: 1.切片& 切塊(Slice & Dice) Querying 可以在指標後括號 來篩選我們要的資料 參考說明文件 2.聚合(Aggregation)
- #24: Prometheus的graph頁面 只是提供我們做查詢的動作 當我們已經確認我們需要監控的query 就可以將他用在grafana
- #26: Importing pre-built dashboards from Grafana
- #29: 我們ITRI DNN Farm 平日的監控使用了3個電視牆畫面
- #35: 透過GPU監控圖幫助我了解 我的客戶們在平上做DNN training 到底使用了多少資源
- #40: Alertmanager 優點是,這種設置方式保有很大的彈性,完全可以依據自己的需求去定義規則。 缺點是,需要多寫一份設定檔,並且如果需要調整規則時,我必需要重新喂設定檔給prometheus,如果裡面有些內容不合格式,可能會造成prometheus卡住需要重啟。
- #41: Prometheus也提供了一套alert manager方案 若以擴充性和彈性 Prometheus勝,缺點是配置相當複雜。(寫程式) 若以簡易、便利、和視覺性來說 grafana較適合OP和IT人員使用。(設規則)
- #44: Grafana的mail設置需要更動設定檔兼重啟OS(缺點),但由於我們是部屬在kubernetes上, 重啟container會使得container回到一開始yaml檔部屬的狀態。 一個解決辦法就是,所以只好先用docker起一份grafana修改設置後重包image, 然後再用這個修改過的image來部屬在k8s下。 修改完image後,(我們重新將新的image上傳到registry上), 將grafana.yaml檔中image這行修改成新的image, 然後重下一次部屬指令kubectl create –f grafana-deploy.yaml *** 請先確認網路環境是否阻擋SMTP***
- #45: 除了E-mail也支援 slack webhood 等常用的方式 也有提供line的api Sendtest 確認是否能成功寄出 或給出錯誤訊息
- #46: 優點是有圖,缺點是信件的描述方式,可能就不像prometheus 的alert 可以全部自己去定義。 這套監控方案兩個不足的地方 prometheus在早期版本有megacli exporter,硬碟error count我必需要使用其他監控軟體來整合。 GPU使用量無法和container做mapping。