Query Store and live Query Statistics
Download as PPTX, PDF1 like901 views

This document discusses Live Query Statistics and the Query Store in Microsoft SQL Server 2016 for troubleshooting query performance issues. Live Query Statistics allows viewing execution plans and metrics of in-flight queries. The Query Store provides a dedicated store for query performance data, capturing plan histories and metrics to help identify regressed queries and other issues. Enabling these tools helps DBAs monitor performance and address issues like slow queries and plans impacted by upgrades or data changes.


Query Store and live Query Statistics
- 1. Eladio Rincón Mission-critical performance with Microsoft SQL Server 2016
- 2. Query performance tools Live Query Statistics overview Live Query Statistics limitations and permissions Query Store overview Query Store architecture Enabling and troubleshooting Query Store Key scenarios and regressed queries
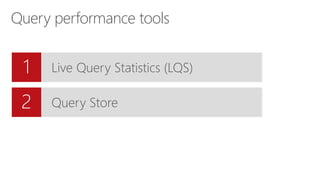
- 3. Query performance tools Live Query Statistics (LQS) Query Store
- 5. Performance challenges Impossible to predict / root cause Database is not working Regression caused by new bits Website is down Temporary performance issues Database upgraded Problem Difficult to troubleshoot “runaway” queries Inability to get estimated plan without runtime information (for example, actual row counts, memory grant usage, execution time warnings) Information on actual plan and time required for query to finish Solution: Live Query Statistics/live query plan Helps debug query performance issues Shows what’s going on with long-running queries Collects and displays actual metrics of in-flight queries in real time Provides operator-level runtime execution statistics
- 6. Live Query Statistics Collect actual metrics about query while running To view live query execution plan, from Tools menu, click Live Query Statistics Using LQS, you can view CPU/memory usage, execution time, query progress, and so on Enables rapid identification of potential bottlenecks for troubleshooting query performance issues Allows drill-down to live operator level statistics: Number of generated rows Elapsed time Operator progress Live warnings
- 7. How does it work? Real-time showplan dynamic management views sys.dm_exec_requests sys.dm_exec_sql_text sys.dm_exec_query_memory_grants sys.dm_exec_query_plan sys.dm_exec_query_profiles Enable live query plan In Management Studio, click Live Query Statistics or Query Store menu SET STATISTICS XML ON or SET STATISTICS PROFILE ON in the session before the query is started Enabling Extended Event query_post_execution_showplan The event itself does not have to fire—it just needs to be enabled
- 8. Other ways to view Live Query Statistics In Activity Monitor, right-click queries in Active Expensive Queries table In Management Studio, right-click selected query, and then click Include Live Query Statistics
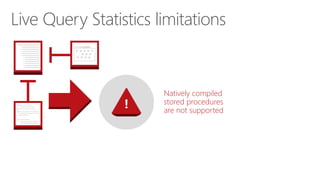
- 10. Natively compiled stored procedures are not supported Live Query Statistics limitations
- 11. Live Query Statistics permissions Requires: Database-level SHOWPLAN permission to populate Live Query Statistics results page Server-level VIEW SERVER STATE permission to see live statistics Any permissions necessary to execute query
- 13. Impossible to predict root cause Database is not working Regression caused by new bits When performance is not good… Website is down Temporary performance issues Database upgraded
- 14. SQL Server Query Optimizer considers many plans As data and query parameters change, it might select a different plan as optimal Usually when it crosses a boundary, performance is about the same Actual performance can be visibly different Query plan regression explained LINEITEM.L_EXTENDEDPRICE SUPPLIER.S_ACCTBAL 0 20 40 60 80 100 0 20 40 60 80 100
- 15. Plan choice regression challenges Plan cache is not well suited to performance troubleshooting Long time to detect issue (TTD) Which query is slow? Why is it slow? What was previous plan? Long time to mitigate (TTM) Can I modify query? How to use plan guide?
- 16. Provides dedicated store for query workload performance data Captures plan history for each query Captures plan performance over time Persists data to disk (works across restarts, upgrades, and recompiles) Significantly reduces TTD/TTM Offers power to find regressions and other issues in seconds Allows you to force previous plans from history Gives control to database administrator (DBA) The solution: Query Store
- 17. How Query Store works Collects query texts (plus all relevant properties) Stores all plan choices and performance metrics Works across restarts/upgrades/recompiles Lowers bar for performance troubleshooting Allows new views Offers intuitive and easy plan forcing Durability latency controlled by DB option DATA_FLUSH_INTERNAL_SECONDS Query Store Async write-back Compile Execute SQL Plan store Runtime stats Query Store schema Compile MSG Execute MSG
- 19. Query Store: write architecture Query Store captures data in-memory to minimize I/O overhead Data is persisted to disk asynchronously in background Query execution Query Store async Compile Execute Query Store plan store Runtime stats store Internal tables Query text and plan Query execute stats
- 20. Query Store: read architecture Views merge in-memory and on-disk content Users always see “latest” data Query execution Query Store async Compile Execute Query Store plan store Runtime stats store Internal tables Query text and plan Query execute stats Query Store views
- 21. Query Store schema explained Internal tables Query text Query Plan Runtime stats 1 -n1 -n Context settings sys. Compile stats query_store_query_text query_context_settings query_store_query query_store_plan Runtime stats query_store_runtime_stats_interval query_store_runtime_stats Exposed views One row per query text, per plan affecting option (example: ANSI NULLS on/off) One row per plan (for each query) Runtime stats interval One row per plan, per time interval (example: 5 min)
- 22. Install bits Keep existing compat level Run Query Store (create a baseline) Move to vNext CompatLevel Fix regressions with plan forcing SQL Server 2016 Query optimization enhancements tied to database compatibility level Stability during upgrade to SQL Server 2016
- 24. Monitoring query performance Query Store feature provides DBAs with insight on query plan choice and performance Regressed Queries pane shows queries and plans in Query Store Drop-down boxes at top allow you to select queries based on various criteria
- 25. Troubleshooting query performance Enable Query Store (ALTER DB) Let Query Store collect the data Search for “problematic” queries Set FORCE PLAN policies
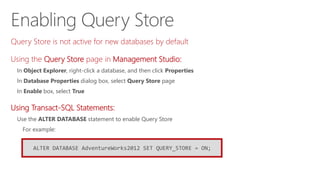
- 26. Enabling Query Store ALTER DATABASE AdventureWorks2012 SET QUERY_STORE = ON; Query Store is not active for new databases by default Using the Query Store page in Management Studio: In Object Explorer, right-click a database, and then click Properties In Database Properties dialog box, select Query Store page In Enable box, select True Using Transact-SQL Statements: Use the ALTER DATABASE statement to enable Query Store For example:
- 28. Key usage scenarios Find and fix query plan regressions Identify top resource consumers Conduct deep analysis of workload patterns/ performance Reduce risks with server upgrade Long-term/strategicShort-term/tactical
- 29. Using Regressed Queries feature After enabling Query Store, refresh database portion of Object Explorer pane to add Query Store section
- 30. © 2015 Microsoft Corporation. All rights reserved. Microsoft, Windows, Microsoft Azure, and other product names are or may be registered trademarks and/or trademarks in the U.S. and/or other countries. The information herein is for informational purposes only and represents the current view of Microsoft Corporation as of the date of this presentation. Because Microsoft must respond to changing market conditions, it should not be interpreted to be a commitment on the part of Microsoft, and Microsoft cannot guarantee the accuracy of any information provided after the date of this presentation. MICROSOFT MAKES NO WARRANTIES, EXPRESS, IMPLIED OR STATUTORY, AS TO THE INFORMATION IN THIS PRESENTATION
Editor's Notes
- #6: Objective: This slide highlights troubleshooting performance issues or problems that DBAs often face. Talking points: This diagram shows three major use cases in which DBAs need to get involved and troubleshoot performance problems. Example situations might include: Application is completely down because of performance problem or database is not working. Users are facing performance problem recurrently and it’s impossible to predict root cause. Users are experiencing slow performance after a recent database upgrade, which may be regression caused by new bits. These are common complications, which may take a lot of time to troubleshoot. The major reason could be change in query plan choice, which means the plan has either been flushed out of cache or has changed due to various reasons (data change, memory pressure, etc.). Challenges in these situations could include: Difficult to troubleshoot live or “runaway” queries, how to get real-time insight into query execution process. How to get estimated plan for query to complete. How to get the no runtime information on the query operator’s actual row counts, memory grant usage, execution time warnings, etc. Solution: SQL Server 2016 has a solution for this. It has a great new feature called Live Query Statistics that allows you to view a live execution plan of an active query, which gives us the opportunity for troubleshooting and debugging. It collects actual metrics about the query that occurred during its execution, so you can visually see what’s going on with the long-running queries. The live query plan displays the overall query progress and operator-level runtime execution statistics, such as the number of rows produced, elapsed time, operator progress, etc.
- #7: Objective: This slide presents the overview of Live Query Statistics (LQS), a new feature introduced in SQL Server 2016, and how to view the live execution plan of an active query using LQS. Talking points: SQL Server 2016 has a new feature called Live Query Statistics (LQS) that allows you to view what is happening during query execution. To view the live query execution plan of any running query, simply click the Live Query Statistics icon under the tools menu. LQS lets you view a list of active queries and associated statistics such as current CPU/memory usage, execution time, query progress, and so on. LQS enables rapid identification of potential bottlenecks for troubleshooting query performance issues. LQS also allows you to drill down into a query plan of an active query, and view live operator-level statistics such as the number of generated rows, elapsed time, operator progress, and live warnings. This facilitates in-depth troubleshooting of query performance issues, without having to wait for query completion. You can watch statistics change in real time during query execution.
- #8: Objective: This slide shows how LQS works and how you can enable this feature. Talking points: LQS obtains a list of active queries and associated statistics from the following Dynamic Management Views (DMVs) and graphically renders this information in the SSMS activity monitor: sys.dm_exec_requests – Returns information about each request that is executing within SQL Server. sys.dm_exec_sql_text – Returns text of SQL batch that is identified by specified sql_handle. sys.dm_exec_query_memory_grants – Returns information about queries that have acquired a memory grant or still require a memory grant to execute. sys.dm_exec_query_plan – Returns showplan in XML format for batch specified by plan handle, which can either be cached or currently executing. sys.dm_exec_query_profiles – Monitors real-time query progress while query executes. There are various ways to enable a LQS: In SQL Server Management Studio (SSMS), there is a new option when right-clicking the query window: Include Live Query Statistics. This function can also be activated from the top menu in SSMS. The live execution plan can also be accessed from the Activity Monitor. Two other methods let you enable the statistics infrastructure that can be used to view Live Query Statistics from other sessions (such as from Activity Monitor): Execute SET STATISTICS XML ON or SET STATISTICS PROFILE ON in the target session. Enable query_post_execution_showplan extended event. This is a server-wide setting that enable Live Query Statistics on all sessions. The statistics profile infrastructure must be enabled before Live Query Statistics can capture information about the progress of queries.
- #9: Objective: This slide highlights how easily you can enable LQS with the help of screenshots. Talking points: In SQL Server Management Studio (SSMS), there is a new option when right-clicking the query window: Include Live Query Statistics. This function can also be activated from the top menu in SSMS. The live execution plan can also be accessed from the Activity Monitor by right-clicking the queries in the Active Expensive Queries table.
- #11: Talking points: A limitation of LQS is that natively compiled stored procedures are not supported.
- #12: Talking points: The database-level SHOWPLAN permission is required to populate the Live Query Statistics results page. The server-level VIEW SERVER STATE permission is needed to see the live statistics, and requires any permissions necessary to execute the query.
- #14: Objective: This slide highlights troubleshooting performance issues or problems that DBAs often face. Talking points: This is the same slide discussed in LQS. Again to reiterate, the diagram depicted shows three major use cases in which DBAs need to get involved and troubleshoot performance problems. Example situations might include: Application is completely down because of performance problem or database is not working. Users are facing performance problem recurrently, and it’s impossible to predict root cause. Users are experiencing slow performance after a recent database upgrade, which may be regression caused by new bits. These are common complications, which may take a lot of time to troubleshoot. The major reason could be a change in query plan choice, which means the plan has either been flushed out of cache or has changed due to various reasons (data change, memory pressure, etc.).
- #15: Objective: This slide highlights the query plan regression problems in SQL Server Query Optimizer improvements. Talking points: This slide shows why the plans in the same query changed, and explains the fact that different plans could be selected for the same query based on the selectivity of their predicates. Each color in the diagram is a different plan, and each plan is selected based on the selectivity of the predicates. An important fact is when a boundary is crossed in the graph and a different plan is selected, most of the time the cost and performance of both plans should be similar as the selectivity or estimated number of rows only changed slightly. As an example, this could happen when a new row is added to a table that qualifies for the used predicate. However, in some cases, mostly due to limitations in the SQL Server Query Optimizer cost model in which it is not able to model something correctly, the new plan can have a large performance difference compared to the previous one and create a problem for your application. (The plans shown on this diagram are the finals selected by the SQL Server Query Optimizer, not to be confused with the many alternatives the optimizer has to consider to select only one.) An important fact was the change of plans due to regressions after changes on cumulative updates (CUs), service packs, or version upgrades. A major concern with changes inside the SQL Server Query Optimizer is plan regressions, which has been considered the biggest obstacle to improvements. Source: http://sqlperformance.com/2015/02/sql-plan/the-sql-server-query-store
- #16: Objective: This slide discusses why fixing plan choice regression is difficult. Talking points: During query troubleshooting, we spend most of the time finding answers to the following questions, leading to a long time-to-detection (TTD). Which are the slow queries? Why are they slow (plan change or blocking)? What were the old stats of query? What was the old plan? Without the ability to see all changes in query plans, it’s difficult to figure out why regressions happened and what you can do to prevent them in the future, leading to a long time-to-mitigate (TTM). You may want to understand the following questions: Can I modify the query? How do I use the plan guide? Sometimes, even if we know what the query plan is supposed to be, it’s still not easy to modify the query using query hint or figure out how to make a plan guide. Ideally, this data is collected on a regular basis and stored in databases for further performance troubleshooting. Source: http://sqlperformance.com/2015/02/sql-plan/the-sql-server-query-store
- #17: Objective: This slide introduces Query Store, and explains how it can be helpful in troubleshooting performance issues faster. Talking points: SQL Server 2016 Query Store can help with the issues discussed previously. The Query Store feature automatically captures a history of queries, plans, and runtime statistics, and retains these for your review. It separates data by time windows, allowing you to see database usage patterns and understand when query plan changes happen on the server, thus capturing the performance of each plan over time. You can think of it as a flight recorder, or black box, for your database. It is a database-scoped persistent store of query workload history. This feature significantly reduces time-to-detect (TTD) the issue and time-to-mitigate (TTM), as this feature not only stores plans and related query performance information, but can also help you easily force an old query plan, which in many cases can solve a performance problem. Query Store is primarily targeting DBAs, in order to give full control on performance troubleshooting and identify regressed workloads.
- #18: Objective: This slide discusses how Query Store works and explains the architecture of this feature. Talking points: How it works Query Store collects query texts and all relevant properties, as well as query plan choices and performance metrics. This collection process works across restarts or upgrades of the server and across recompilation of indexes. It provides many configurable options for customization. Query Store integrates with existing query execution statistics, plan forcing, and manageability tools. It is a dedicated store for query workload performance data and captures plan history for each query. Query Store can be viewed and managed through Management Studio or by using views and procedures. Seven Query Store catalog views can present information on Query Store. Query Store also has a rich user-interface component that uses several of the DMVs. Architecture diagram of Query Store Every time SQL Server compiles or executes a query, a message is sent to the Query Store. This compile and execution information is kept in memory first and then saved to disk, depending on the Query Store configuration (data is aggregated according to the INTERVAL_LENGTH_MINUTES parameter, which defaults to one hour, and flushed to disk according to the DATA_FLUSH_INTERVAL_SECONDS parameter). The data can also be flushed to disk if there is memory pressure on the system. In any case, you can access all data, both in memory and disk, when you run the sys.query_store_runtime_stats catalog.
- #20: Objective: This slide explains the Query Store write architecture. Talking points: When a query gets submitted against a database that has the Query Store enabled, the compiled query execution plan is written to the Query Store plan store, and the runtime information of the query is recorded in the runtime stats store. As mentioned previously, this information is stored initially in-memory. After a specific interval, the information inside the in-memory store is asynchronously written to disk to harden the information. Query Store writes the execution plans and runtime statistics into the primary filegroup of the database that you queried against.
- #21: Objective: This slide explains the Query Store read architecture. Talking points: So how does the Query Store access data from disk and in-memory simultaneously when we query either Query Store reports or access DMVs? To make this possible with the least amount of performance impact, a new Query Store view, or Table-Defined Function (TDF), was developed to grab data still in-memory while simultaneously grabbing and merging data that was already persisted on disk. In this arrangement, users always see the “latest” data.
- #22: Objective: This slide explains the Query Store schema. Talking points: The Query Store uses an iterative pattern. The 1-n denotes a loop. In this pattern, you could have a series of rows containing actual queries that the Query Store initiates according to the plan (query might rerun on a set interval). This type of query plan can launch for data collection on something like elevator “Internet of Things” data, in which you have a network of elevators with status that launches queries every five minutes based on multiple unique properties (such as determining if they are functioning properly or need maintenance, etc.). Animation <<first click>> One row per query text, per plan affecting option Animation <<second click>> One row per plan (for each query) Animation <<third click>> One row per plan, per time interval Animation <<fourth click>> Internal tables Animation <<fifth click>> Exposed tables
- #23: Objective: This slide explains how to maintain stability while upgrading to SQL Server 2016 using Query Store. Talking points: Stabilizing query performance while upgrading Query optimization enhancements are tied to the database compatibility level. If you install 2016 bits, you can keep the existing compatibility level and freeze all plans in a pre-upgrade state. We changed QP to keep CE changes under compatibility level. Run Query Store and create a baseline. With Query Store, you can easily detect when the query performance regressed and determine the optimal plan within a period of interest. Then you can force that optimal plan for future query execution. You can also identify inconsistent query performance for a query with parameters (either auto-parameterized or manually parameterized). Among different plans, you can identify which plan is fast and optimal enough for all or most of the parameter values and force that plan, keeping predictable performance for the wider set of user scenarios. Move to vNext CompatLevel Fix regressions with plan forcing — force or plan for a query (apply forcing policy). When a plan is forced for a certain query, every time a query comes to execution it will be executed with the plan that is forced. EXEC sp_query_store_force_plan @query_id = 48, @plan_id = 49; When using sp_query_store_force_plan, you can only force plans that were recorded by Query Store as a plan for that query. In other words, the only plans available for a query are those that were already used to execute Q1 while Query Store was active. Remove plan forcing for a query. To rely again on the SQL Server Query Optimizer to calculate the optimal query plan, use sp_query_store_unforce_plan to unforce the plan that was selected for the query. EXEC sp_query_store_unforce_plan @query_id = 48, @plan_id = 49; Plan freezing will keep your current forcing decisions and apply the LAST plan for other queries. Is that what you would expect? Animation <<first click>> Flow chart of upgrade process
- #25: Objective: This slide emphasizes that Query Store comes with an extraordinary UI that will help a broad set of users immediately benefit from collected performance data. Talking points: Query Store also has a rich user-interface component that uses several DMVs (see screenshot). Familiarizing yourself with the UI can be an excellent introduction to the kind of information you can obtain by querying DMVs. SSMS is focused around a handful of the most important scenarios, making this feature instantly useful in the typical DBA’s everyday activities. Microsoft encourages people to try out new UI and learn from it: SSMS is a great knowledge source because people can easily learn the first steps of using Query Store DMVs by analyzing queries generated by SSMS. Example: After enabling Query Store, refresh the database portion of the Object Explorer pane to add the Query Store section. Selecting Regressed Queries opens the Regressed Queries pane in Management Studio. This pane shows you queries and plans in Query Store. Drop-down boxes at the top allow you to select queries based on various criteria. Select a plan to see the graphical query plan. Buttons are available to view the source query, force and unforce a query plan, and refresh the display. To force a plan, select a query and plan, and then click Force Plan. You can only force plans that were saved by the query plan feature and are still retained in the query plan cache.
- #26: Objective: This slide shows how to start with query performance troubleshooting and the typical Query Store workflow. Talking points: Troubleshooting your workflow with Query Store is simple, as the diagram shows: Enable Query Store by using Management Studio as described in previous slides or executing the following Transact-SQL statement: ALTER DATABASE [DatabaseOne] SET QUERY_STORE = ON; It will take some time until Query Store collects the data set that accurately represents your workload (one day is usually enough, even for very complex workloads). You can then start exploring data and identifying queries that need your attention immediately after enabling the feature. Navigate to the Query Store subfolder under the database node in Object Explorer of Management Studio to open troubleshooting views for specific scenarios. When you identify a query with suboptimal performance, your action depends on the nature of the problem: If the query was executed with multiple plans, and the last plan is significantly worse than the previous plan, you can use the plan-forcing mechanism to require SQL Server to always use the optimal plan for future executions. Similarly, you may conclude that your query is missing an index for optimal execution. This information is surfaced within the query execution plan. Create the missing index and check the query performance using Query Store. In some cases, you may enforce statistic recompilation if you see that the difference between the estimated and actual number of rows in the execution plan is significant. Rewrite problematic queries. For example, take advantage of query parameterization or implement more optimal logic.
- #27: Objective: This slide shows how to enable Query Store. Talking points: Query Store is not active for new databases by default. You need to first enable it, in one of two ways: By using the Query Store page in Management Studio In Object Explorer, right-click a database, and then click Properties. In the Database Properties dialog box, select the Query Store page. In the Enable box, select True. By using Transact-SQL statements Use the ALTER DATABASE statement to enable Query Store. For example: ALTER DATABASE AdventureWorks2012 SET QUERY_STORE = ON; You cannot enable Query Store for the master or tempdb database.
- #29: Objective: This slide demonstrates key usage scenarios for Query Store. Talking points: Short-term/tactical Quickly find and fix a plan performance regression by forcing the previous query plan. Fix queries that have recently regressed in performance due to execution plan changes. Determine the number of times a query was executed in a given time window, assisting a DBA in troubleshooting performance resource problems. Identify top n queries (by execution time, memory consumption, etc.) in the past x hours. Audit history of query plans for a given query. Analyze resource (CPU, I/O, and memory) usage patterns for a particular database. Long term/strategic Reduce risk associated with server upgrades by maintaining query performance stability while upgrading. Perform deep analysis of workload patterns to increase performance.
- #30: Objective: This slide shows how you can use the Regressed Queries feature of Query Store. Talking points: After enabling Query Store, refresh the database portion of the Object Explorer pane to add the Query Store section. Select Regressed Queries, which opens the Regressed Queries pane in Management Studio. The Regressed Queries pane shows you the queries and plans in the Query Store. Drop-down boxes let you select queries based on various criteria. Select a plan to see the graphical query plan. Buttons are available to view the source query, force and unforce a query plan, and refresh the display. To force a plan, select a query and plan, and then click Force Plan. You can only force plans that were saved by the query plan feature and are still retained in the query plan cache.