SlideShare a Scribd company logo
2
Most read
3
Most read
8
Most read
1
University of Technology
Computer Science Department
Regression Analysis
UPrepared by
SAMER A.QADER
2017
2
Contents:
1.What is Regression Analysis?
2.Types of Regression Analysis?
3.Simple Linear Regression Analysis
4.Regression Equations model data
5.Example of Linear regression Analysis
6.References
3
1. UWhat is Regression AnalysisU?
The origin of the term "regression" to describe the process of fitting lines to data is
rooted in a study of genetics by Sir Francis Galton in the late 19th century. He
discovered that fathers who were extremely short or extremely tall tended to have
sons whose heights were closer to the average height. He called this phenomenon
"regression to the mean".
 Regression analysis is a form of predictive modeling technique which
investigates the relationship between a dependent (target) and independent
variable(s) (predictor).
 This technique is used for forecasting, time series modeling and finding the
causal effect relationship between the variables.
 For example, relationship between rash driving and number of road accidents
by a driver is best studied through regression.
UBenefits
1. It indicates the strength of impact of multiple independent variables on a dependent
variable.
2. It indicates the significant relationships between dependent variable and independent
variable.
3. These help market researchers / data analysts / data scientists to eliminate and
evaluate the best set of variables to be used for building predictive models
4
2. UTypes of Regression Analysis
Types of Regression analysis is generally classified into two Kinds:
1. Simple
2. Multiple.
It involves only two variables: dependent variable, explanatory (independent) variable.
A regression analysis may involve a linear model or a nonlinear model.
5
3. Simple Linear regression model :-
• Linear regression model is a model with a single regressor x that has a linear
relationship with a Response y.
• Linear regression can be defined as the line of the best fit
You might recall from basic algebra that lines can be defined in a slope-intercept form
similar to y = a + bx. In this form, the letter y indicates the dependent variable and x
indicates the independent variable. The slope term b specifies how much the line rises
for each increase in x. Positive values define lines that slope upward while negative
values define lines that slope downward.
The term a is known as the intercept because it specifies the point where the line
crosses, or intercepts, the vertical y axis. It indicates the value of y when x = 0.
6
4.Regression Equations model data :-
.
Intercept Slope
Best fit
Regression line
Slope
DependentVariables
Independent Variables
Intercept
7
5. Example of Linear regression
Suppose we have the following 5 data points of population (in hundred thousand) of a
medium size city over 20 years (based on every 5 – year’s census) as shown in table 1
you want to predict the population in the year 2005.
How you predict that population?
Sol
Step 1:
First we calculate the slope: -
So we need to find:
• ∑ 𝒙𝒙 and ∑ 𝒚𝒚 .
• (XY) and ∑ 𝒙𝒙𝒙𝒙 .
• (X2
) and ∑ 𝟐𝟐𝒙𝒙 .
Year 1980 1985 1990 1995 2000 2005
population 2.1 2.9 3.2 4.1 9.4 ?
8
x y
Year Population XY X2
1980 2.1 4158 3920400
1985 2.9 5756.5 3940225
1990 3.2 6368 3960100
1995 4.1 8179.5 3980025
2000 9.4 9800 4000000
� 𝒙𝒙 � 𝒚𝒚 � 𝒙𝒙𝒙𝒙 � 𝟐𝟐
𝒙𝒙
9950 17.2 34262 19800750
N = 5 Data points
Slope =
𝒏𝒏 ∑ 𝒙𝒙𝒙𝒙−∑ 𝒙𝒙 ∑ 𝒚𝒚
𝒏𝒏 ∑ 𝒙𝒙𝟐𝟐−(∑ 𝒙𝒙)𝟐𝟐 =
𝟓𝟓.(𝟑𝟑𝟑𝟑𝟑𝟑𝟑𝟑𝟑𝟑)−(𝟗𝟗𝟗𝟗𝟗𝟗𝟗𝟗).(𝟏𝟏𝟏𝟏.𝟐𝟐)
𝟓𝟓.(𝟏𝟏𝟏𝟏𝟏𝟏𝟏𝟏𝟏𝟏𝟏𝟏𝟏𝟏𝟏𝟏)−(𝟗𝟗𝟗𝟗𝟗𝟗𝟗𝟗)𝟐𝟐 = 0.136
Step 2:
We calculate the intercept: -
So we need to find:
• 𝒀𝒀� the average of years
• 𝑿𝑿� the average of population
𝒀𝒀� =
∑ 𝒀𝒀
𝑵𝑵
=
𝟏𝟏𝟏𝟏.𝟐𝟐
𝟓𝟓
= 3.44
𝑿𝑿� =
∑ 𝑿𝑿
𝑵𝑵
=
𝟗𝟗𝟗𝟗𝟗𝟗𝟗𝟗
𝟓𝟓
= 1990
intercept = 3.44 – (0.136). (1990) = 267.2
9
Step3:-
We find the linear Regression for x = 2005
y = 267.2 + (0.136).(2005) = 5.48
Year 1980 1985 1990 1995 2000 2005
population 2.1 2.9 3.2 4.1 9.4 5.48
10
References:
• Machine Learning with R , Second Edition , Brett Lantz
• Sykes, Alan O. "An introduction to regression analysis." (1993).
• Chatterjee, Samprit, and Ali S. Hadi. Regression analysis by example.
John Wiley & Sons,
• Internet:http://people.revoledu.com/kardi/tutorial/Regression/WhatIsRegre
ssion.html

More Related Content

What's hot (20)

PPTX
Statistical inference: Estimation
Parag Shah
 
PPTX
Statistical distributions
TanveerRehman4
 
PDF
t-TEst. :D
patatas
 
PPTX
Basics of Regression analysis
Mahak Vijayvargiya
 
PPTX
Polynomial regression
naveedaliabad
 
PDF
Logistic Ordinal Regression
Sri Ambati
 
PPT
Linear regression
Karishma Chaudhary
 
PPTX
ML - Simple Linear Regression
Andrew Ferlitsch
 
DOC
Covariance and correlation
Rashid Hussain
 
PPTX
ML - Multiple Linear Regression
Andrew Ferlitsch
 
PDF
Probability Distribution
ShahnawazAli81
 
PPTX
Binomial distribution
Sushmita R Gopinath
 
PPTX
Kolmogorov Smirnov
Rabin BK
 
PPTX
Presentation On Regression
alok tiwari
 
PPTX
Multiple Regression Analysis (MRA)
Naveen Kumar Medapalli
 
PDF
Ordinal Logistic Regression
Al-Ahmadgaid Asaad
 
ODP
Multiple linear regression
James Neill
 
PPTX
Correlation and Regression
Ram Kumar Shah "Struggler"
 
PPT
Multiple regression presentation
Carlo Magno
 
PPTX
Regression analysis
University of Jaffna
 
Statistical inference: Estimation
Parag Shah
 
Statistical distributions
TanveerRehman4
 
t-TEst. :D
patatas
 
Basics of Regression analysis
Mahak Vijayvargiya
 
Polynomial regression
naveedaliabad
 
Logistic Ordinal Regression
Sri Ambati
 
Linear regression
Karishma Chaudhary
 
ML - Simple Linear Regression
Andrew Ferlitsch
 
Covariance and correlation
Rashid Hussain
 
ML - Multiple Linear Regression
Andrew Ferlitsch
 
Probability Distribution
ShahnawazAli81
 
Binomial distribution
Sushmita R Gopinath
 
Kolmogorov Smirnov
Rabin BK
 
Presentation On Regression
alok tiwari
 
Multiple Regression Analysis (MRA)
Naveen Kumar Medapalli
 
Ordinal Logistic Regression
Al-Ahmadgaid Asaad
 
Multiple linear regression
James Neill
 
Correlation and Regression
Ram Kumar Shah "Struggler"
 
Multiple regression presentation
Carlo Magno
 
Regression analysis
University of Jaffna
 

Similar to Regression analysis algorithm (20)

PPTX
business Lesson-Linear-Regression-1.pptx
jazelace87
 
PPTX
Regression Analysis
Salim Azad
 
PPTX
Regression analysis by akanksha Bali
Akanksha Bali
 
PDF
Introduction to financial forecasting in investment analysis
Springer
 
PPTX
Regression (Linear Regression and Logistic Regression) by Akanksha Bali
Akanksha Bali
 
PPTX
STATISTICS-AND-PROBABILITY-WEEK-9-10.pptx
ThrisEbio
 
PPTX
Regression Analysis.pptx
ShivankAggatwal
 
PPTX
regression analysis presentation slides.
nsnatraj23
 
PPT
Regression analysis ppt
Elkana Rorio
 
PPTX
Linear regression aims to find the "best-fit" linear line
rnycsepp
 
PDF
Regression
AbidShahriar8
 
PPTX
Abs regression
Karthikeya Omshanti
 
PPTX
Unit2_2Regression analysitfutdyrstees.pptx
neetu29945
 
PPT
Simple Linear Regression.pptSimple Linear Regression.ppt
NersyPrincessBongoya
 
PPTX
Regression Analysis.pptx
Ajka3
 
PPTX
Introduction to Regression . pptx
Harsha Patil
 
PPTX
REGRESSION METasdfghjklmjhgftrHODS1.pptx
cajativ595
 
PPTX
Regression
Sauravurp
 
PPTX
Artificial Intelligence.pptx
Mubashir Hashmi
 
PDF
Regression analysis
Awais Salman
 
business Lesson-Linear-Regression-1.pptx
jazelace87
 
Regression Analysis
Salim Azad
 
Regression analysis by akanksha Bali
Akanksha Bali
 
Introduction to financial forecasting in investment analysis
Springer
 
Regression (Linear Regression and Logistic Regression) by Akanksha Bali
Akanksha Bali
 
STATISTICS-AND-PROBABILITY-WEEK-9-10.pptx
ThrisEbio
 
Regression Analysis.pptx
ShivankAggatwal
 
regression analysis presentation slides.
nsnatraj23
 
Regression analysis ppt
Elkana Rorio
 
Linear regression aims to find the "best-fit" linear line
rnycsepp
 
Regression
AbidShahriar8
 
Abs regression
Karthikeya Omshanti
 
Unit2_2Regression analysitfutdyrstees.pptx
neetu29945
 
Simple Linear Regression.pptSimple Linear Regression.ppt
NersyPrincessBongoya
 
Regression Analysis.pptx
Ajka3
 
Introduction to Regression . pptx
Harsha Patil
 
REGRESSION METasdfghjklmjhgftrHODS1.pptx
cajativ595
 
Regression
Sauravurp
 
Artificial Intelligence.pptx
Mubashir Hashmi
 
Regression analysis
Awais Salman
 
Ad

More from Sammer Qader (10)

PDF
Tam & toe
Sammer Qader
 
PPTX
Project integration management ch 4
Sammer Qader
 
PDF
Introduction to the management of information security
Sammer Qader
 
PPTX
Text compression
Sammer Qader
 
PDF
Transport laye
Sammer Qader
 
PDF
Information & Data Architecture
Sammer Qader
 
PPTX
Chapter 4 Ethical and Social Issues in Information Systems
Sammer Qader
 
PPTX
Project integration management ch 4
Sammer Qader
 
PDF
Data classification sammer
Sammer Qader
 
PPTX
Cloud computing
Sammer Qader
 
Tam & toe
Sammer Qader
 
Project integration management ch 4
Sammer Qader
 
Introduction to the management of information security
Sammer Qader
 
Text compression
Sammer Qader
 
Transport laye
Sammer Qader
 
Information & Data Architecture
Sammer Qader
 
Chapter 4 Ethical and Social Issues in Information Systems
Sammer Qader
 
Project integration management ch 4
Sammer Qader
 
Data classification sammer
Sammer Qader
 
Cloud computing
Sammer Qader
 
Ad

Recently uploaded (20)

PPTX
Mrs Mhondiwa Introduction to Algebra class
sabinaschimanga
 
PPTX
nutriquiz grade 4.pptx...............................................
ferdinandsanbuenaven
 
PPTX
How to Consolidate Subscription Billing in Odoo 18 Sales
Celine George
 
PPTX
SCHOOL-BASED SEXUAL HARASSMENT PREVENTION AND RESPONSE WORKSHOP
komlalokoe
 
PPTX
Views on Education of Indian Thinkers Mahatma Gandhi.pptx
ShrutiMahanta1
 
PPTX
Gall bladder, Small intestine and Large intestine.pptx
rekhapositivity
 
PDF
Right to Information.pdf by Sapna Maurya XI D
Directorate of Education Delhi
 
PPTX
How to Configure Storno Accounting in Odoo 18 Accounting
Celine George
 
PPTX
national medicinal plants board mpharm.pptx
SHAHEEN SHABBIR
 
PPTX
Modern analytical techniques used to characterize organic compounds. Birbhum ...
AyanHossain
 
PDF
IMP NAAC-Reforms-Stakeholder-Consultation-Presentation-on-Draft-Metrics-Unive...
BHARTIWADEKAR
 
PPTX
Latest Features in Odoo 18 - Odoo slides
Celine George
 
PPTX
THE HUMAN INTEGUMENTARY SYSTEM#MLT#BCRAPC.pptx
Subham Panja
 
PPTX
Various Psychological tests: challenges and contemporary trends in psychologi...
santoshmohalik1
 
PPTX
LEGAL ASPECTS OF PSYCHIATRUC NURSING.pptx
PoojaSen20
 
PPTX
Maternal and Child Tracking system & RCH portal
Ms Usha Vadhel
 
PPTX
Accounting Skills Paper-I, Preparation of Vouchers
Dr. Sushil Bansode
 
PPTX
IDEAS AND EARLY STATES Social science pptx
NIRANJANASSURESH
 
PPTX
HIRSCHSPRUNG'S DISEASE(MEGACOLON): NURSING MANAGMENT.pptx
PRADEEP ABOTHU
 
PPTX
classroom based quiz bee.pptx...................
ferdinandsanbuenaven
 
Mrs Mhondiwa Introduction to Algebra class
sabinaschimanga
 
nutriquiz grade 4.pptx...............................................
ferdinandsanbuenaven
 
How to Consolidate Subscription Billing in Odoo 18 Sales
Celine George
 
SCHOOL-BASED SEXUAL HARASSMENT PREVENTION AND RESPONSE WORKSHOP
komlalokoe
 
Views on Education of Indian Thinkers Mahatma Gandhi.pptx
ShrutiMahanta1
 
Gall bladder, Small intestine and Large intestine.pptx
rekhapositivity
 
Right to Information.pdf by Sapna Maurya XI D
Directorate of Education Delhi
 
How to Configure Storno Accounting in Odoo 18 Accounting
Celine George
 
national medicinal plants board mpharm.pptx
SHAHEEN SHABBIR
 
Modern analytical techniques used to characterize organic compounds. Birbhum ...
AyanHossain
 
IMP NAAC-Reforms-Stakeholder-Consultation-Presentation-on-Draft-Metrics-Unive...
BHARTIWADEKAR
 
Latest Features in Odoo 18 - Odoo slides
Celine George
 
THE HUMAN INTEGUMENTARY SYSTEM#MLT#BCRAPC.pptx
Subham Panja
 
Various Psychological tests: challenges and contemporary trends in psychologi...
santoshmohalik1
 
LEGAL ASPECTS OF PSYCHIATRUC NURSING.pptx
PoojaSen20
 
Maternal and Child Tracking system & RCH portal
Ms Usha Vadhel
 
Accounting Skills Paper-I, Preparation of Vouchers
Dr. Sushil Bansode
 
IDEAS AND EARLY STATES Social science pptx
NIRANJANASSURESH
 
HIRSCHSPRUNG'S DISEASE(MEGACOLON): NURSING MANAGMENT.pptx
PRADEEP ABOTHU
 
classroom based quiz bee.pptx...................
ferdinandsanbuenaven
 

Regression analysis algorithm

  • 1. 1 University of Technology Computer Science Department Regression Analysis UPrepared by SAMER A.QADER 2017
  • 2. 2 Contents: 1.What is Regression Analysis? 2.Types of Regression Analysis? 3.Simple Linear Regression Analysis 4.Regression Equations model data 5.Example of Linear regression Analysis 6.References
  • 3. 3 1. UWhat is Regression AnalysisU? The origin of the term "regression" to describe the process of fitting lines to data is rooted in a study of genetics by Sir Francis Galton in the late 19th century. He discovered that fathers who were extremely short or extremely tall tended to have sons whose heights were closer to the average height. He called this phenomenon "regression to the mean".  Regression analysis is a form of predictive modeling technique which investigates the relationship between a dependent (target) and independent variable(s) (predictor).  This technique is used for forecasting, time series modeling and finding the causal effect relationship between the variables.  For example, relationship between rash driving and number of road accidents by a driver is best studied through regression. UBenefits 1. It indicates the strength of impact of multiple independent variables on a dependent variable. 2. It indicates the significant relationships between dependent variable and independent variable. 3. These help market researchers / data analysts / data scientists to eliminate and evaluate the best set of variables to be used for building predictive models
  • 4. 4 2. UTypes of Regression Analysis Types of Regression analysis is generally classified into two Kinds: 1. Simple 2. Multiple. It involves only two variables: dependent variable, explanatory (independent) variable. A regression analysis may involve a linear model or a nonlinear model.
  • 5. 5 3. Simple Linear regression model :- • Linear regression model is a model with a single regressor x that has a linear relationship with a Response y. • Linear regression can be defined as the line of the best fit You might recall from basic algebra that lines can be defined in a slope-intercept form similar to y = a + bx. In this form, the letter y indicates the dependent variable and x indicates the independent variable. The slope term b specifies how much the line rises for each increase in x. Positive values define lines that slope upward while negative values define lines that slope downward. The term a is known as the intercept because it specifies the point where the line crosses, or intercepts, the vertical y axis. It indicates the value of y when x = 0.
  • 6. 6 4.Regression Equations model data :- . Intercept Slope Best fit Regression line Slope DependentVariables Independent Variables Intercept
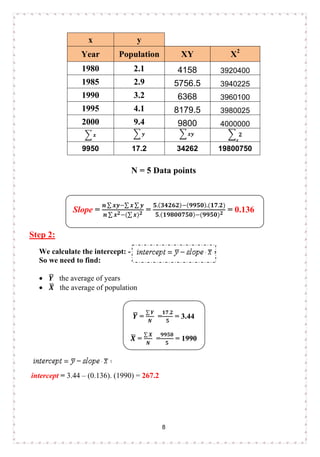
  • 7. 7 5. Example of Linear regression Suppose we have the following 5 data points of population (in hundred thousand) of a medium size city over 20 years (based on every 5 – year’s census) as shown in table 1 you want to predict the population in the year 2005. How you predict that population? Sol Step 1: First we calculate the slope: - So we need to find: • ∑ 𝒙𝒙 and ∑ 𝒚𝒚 . • (XY) and ∑ 𝒙𝒙𝒙𝒙 . • (X2 ) and ∑ 𝟐𝟐𝒙𝒙 . Year 1980 1985 1990 1995 2000 2005 population 2.1 2.9 3.2 4.1 9.4 ?
  • 8. 8 x y Year Population XY X2 1980 2.1 4158 3920400 1985 2.9 5756.5 3940225 1990 3.2 6368 3960100 1995 4.1 8179.5 3980025 2000 9.4 9800 4000000 � 𝒙𝒙 � 𝒚𝒚 � 𝒙𝒙𝒙𝒙 � 𝟐𝟐 𝒙𝒙 9950 17.2 34262 19800750 N = 5 Data points Slope = 𝒏𝒏 ∑ 𝒙𝒙𝒙𝒙−∑ 𝒙𝒙 ∑ 𝒚𝒚 𝒏𝒏 ∑ 𝒙𝒙𝟐𝟐−(∑ 𝒙𝒙)𝟐𝟐 = 𝟓𝟓.(𝟑𝟑𝟑𝟑𝟑𝟑𝟑𝟑𝟑𝟑)−(𝟗𝟗𝟗𝟗𝟗𝟗𝟗𝟗).(𝟏𝟏𝟏𝟏.𝟐𝟐) 𝟓𝟓.(𝟏𝟏𝟏𝟏𝟏𝟏𝟏𝟏𝟏𝟏𝟏𝟏𝟏𝟏𝟏𝟏)−(𝟗𝟗𝟗𝟗𝟗𝟗𝟗𝟗)𝟐𝟐 = 0.136 Step 2: We calculate the intercept: - So we need to find: • 𝒀𝒀� the average of years • 𝑿𝑿� the average of population 𝒀𝒀� = ∑ 𝒀𝒀 𝑵𝑵 = 𝟏𝟏𝟏𝟏.𝟐𝟐 𝟓𝟓 = 3.44 𝑿𝑿� = ∑ 𝑿𝑿 𝑵𝑵 = 𝟗𝟗𝟗𝟗𝟗𝟗𝟗𝟗 𝟓𝟓 = 1990 intercept = 3.44 – (0.136). (1990) = 267.2
  • 9. 9 Step3:- We find the linear Regression for x = 2005 y = 267.2 + (0.136).(2005) = 5.48 Year 1980 1985 1990 1995 2000 2005 population 2.1 2.9 3.2 4.1 9.4 5.48
  • 10. 10 References: • Machine Learning with R , Second Edition , Brett Lantz • Sykes, Alan O. "An introduction to regression analysis." (1993). • Chatterjee, Samprit, and Ali S. Hadi. Regression analysis by example. John Wiley & Sons, • Internet:http://people.revoledu.com/kardi/tutorial/Regression/WhatIsRegre ssion.html