


- Peter Lynch purchased 100 shares of Iomega Corp. 3 months ago at $50 per share. He received $0.25 dividends per share last month. The shares are now worth $56 each. - The document discusses concepts related to risk and return such as random variables, probability, moments, variance, standard deviation, and covariance. It provides an example of computing these statistics for two companies. - Portfolio theory holds that combining securities reduces risk through diversification. The correlation between securities also impacts the risk of a portfolio. The portfolio with the highest expected return for a given level of risk makes up the efficient frontier.
Introduction to the concepts of risk and return in investment.
Example of calculating Peter Lynch's holding period return for Iomega Corp shares.
Introduction to random variables and probabilities essential for financial analysis.
Presenting a probability distribution for returns on CGI and DSC stocks.
Mean or expected return calculation for CGI and DSC stock.
Calculating variance and standard deviation for CGI’s returns.
Covariance of the returns between CGI and DSC.
Calculating and interpreting the correlation coefficient of CGI and DSC.
Summary of statistical results for CGI and DSC stocks including mean, variance, covariance, and correlation.
Definition of portfolio and the concept of reducing risk through diversification.
Expected return and risk calculations, involving securities and portfolio weights.
Determining expected return based on portfolio weights.
Further analysis on portfolio expected return and associated risks.
Discusses how combining CGI and DSC reduces overall portfolio risk through diversification.
Impact of correlation coefficients on portfolio risk and expected returns.
Analyzing risk and expected returns of two stocks under varying correlation coefficients.
Graphical representation of expected returns against various correlation coefficients.
Analysis of portfolios with multiple assets and the relationship between expected returns and risk.
Exploration of potential combinations of risky assets.
Definition of an efficient portfolio and the concept of the efficient frontier.
Graphing the relationship between risk and expected return on the efficient frontier.
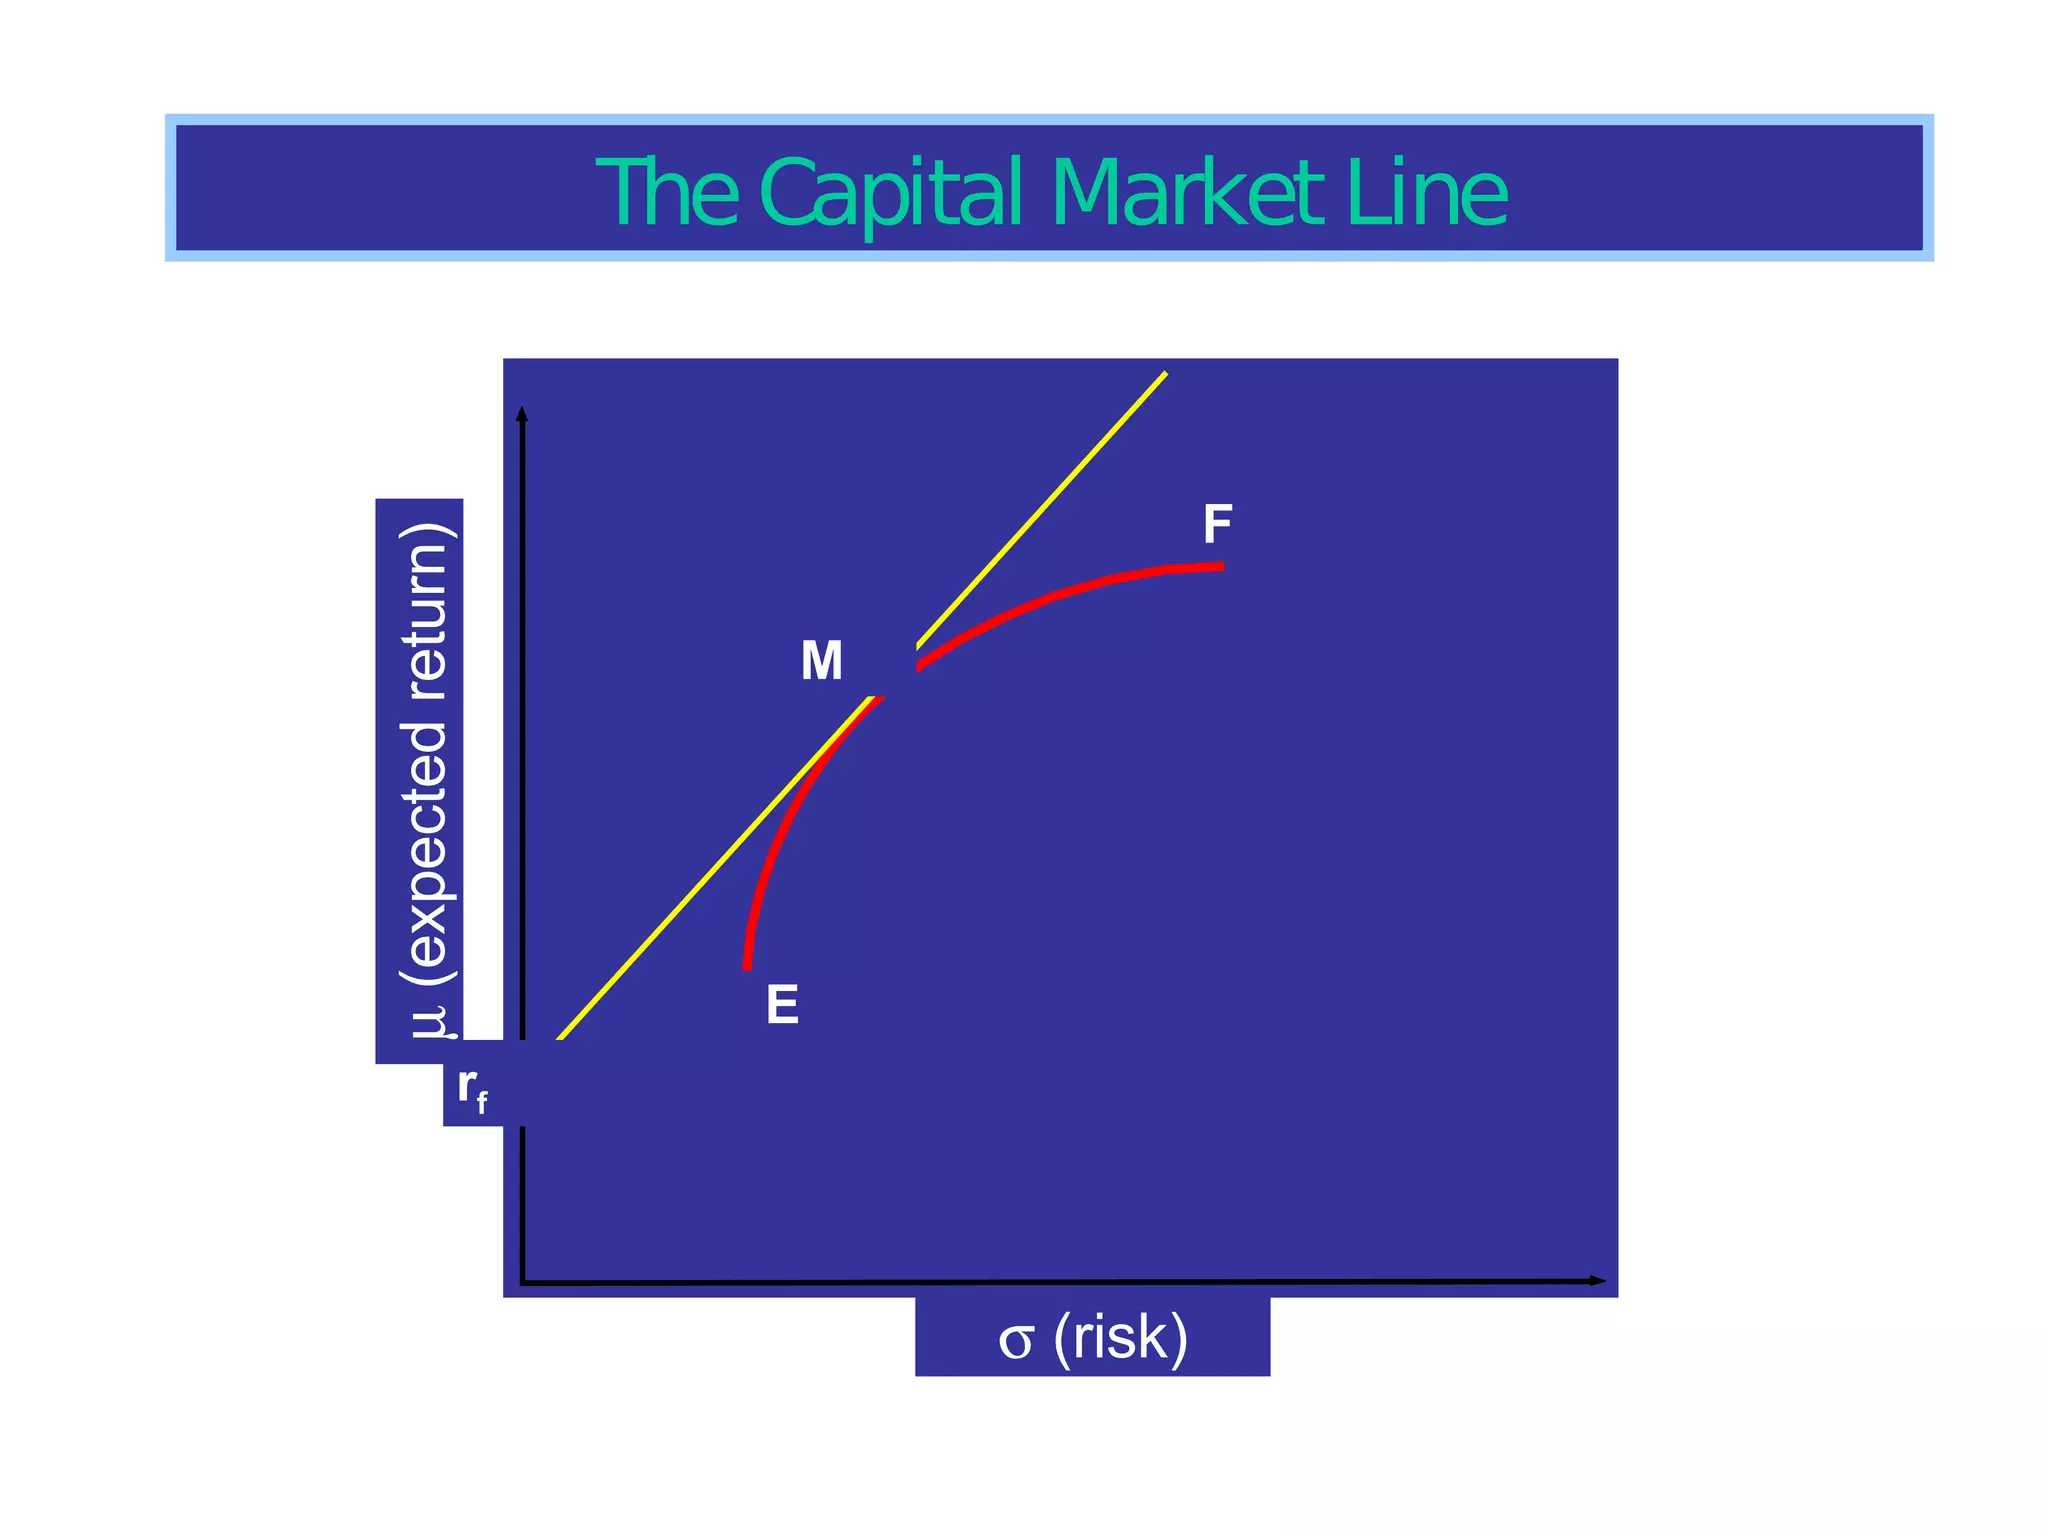
Using a riskless asset to determine the optimal efficient portfolio.
Graphical representation of risk and expected return combinations of risk-free and risky assets.
Analysis of the effective combinations of a risky asset and a risk-free asset.
Concept of the Capital Market Line and its significance in portfolio investment.
Introduction to the Sharpe Ratio and its relevance in measuring portfolio performance.
Introduction to the Capital Asset Pricing Model and its impact on investment choices.
Overview of asset pricing models and their relevance in determining expected returns.
Understanding personal investment choices along the Capital Market Line.
Use of CAPM to determine required rates of return for individual securities.
Definition and implications of the Security Market Line for securities and portfolios.
Factors influencing the required rate of return on a security.
Graphical representation of the SML and its relevance in finance.
Example calculation of the required rate of return for Gator Sprinkler Systems.
Detailed steps to compute the required return on GSS using its beta and market data.
Exploration of scenarios for GSS's required return based on varying correlation coefficients.
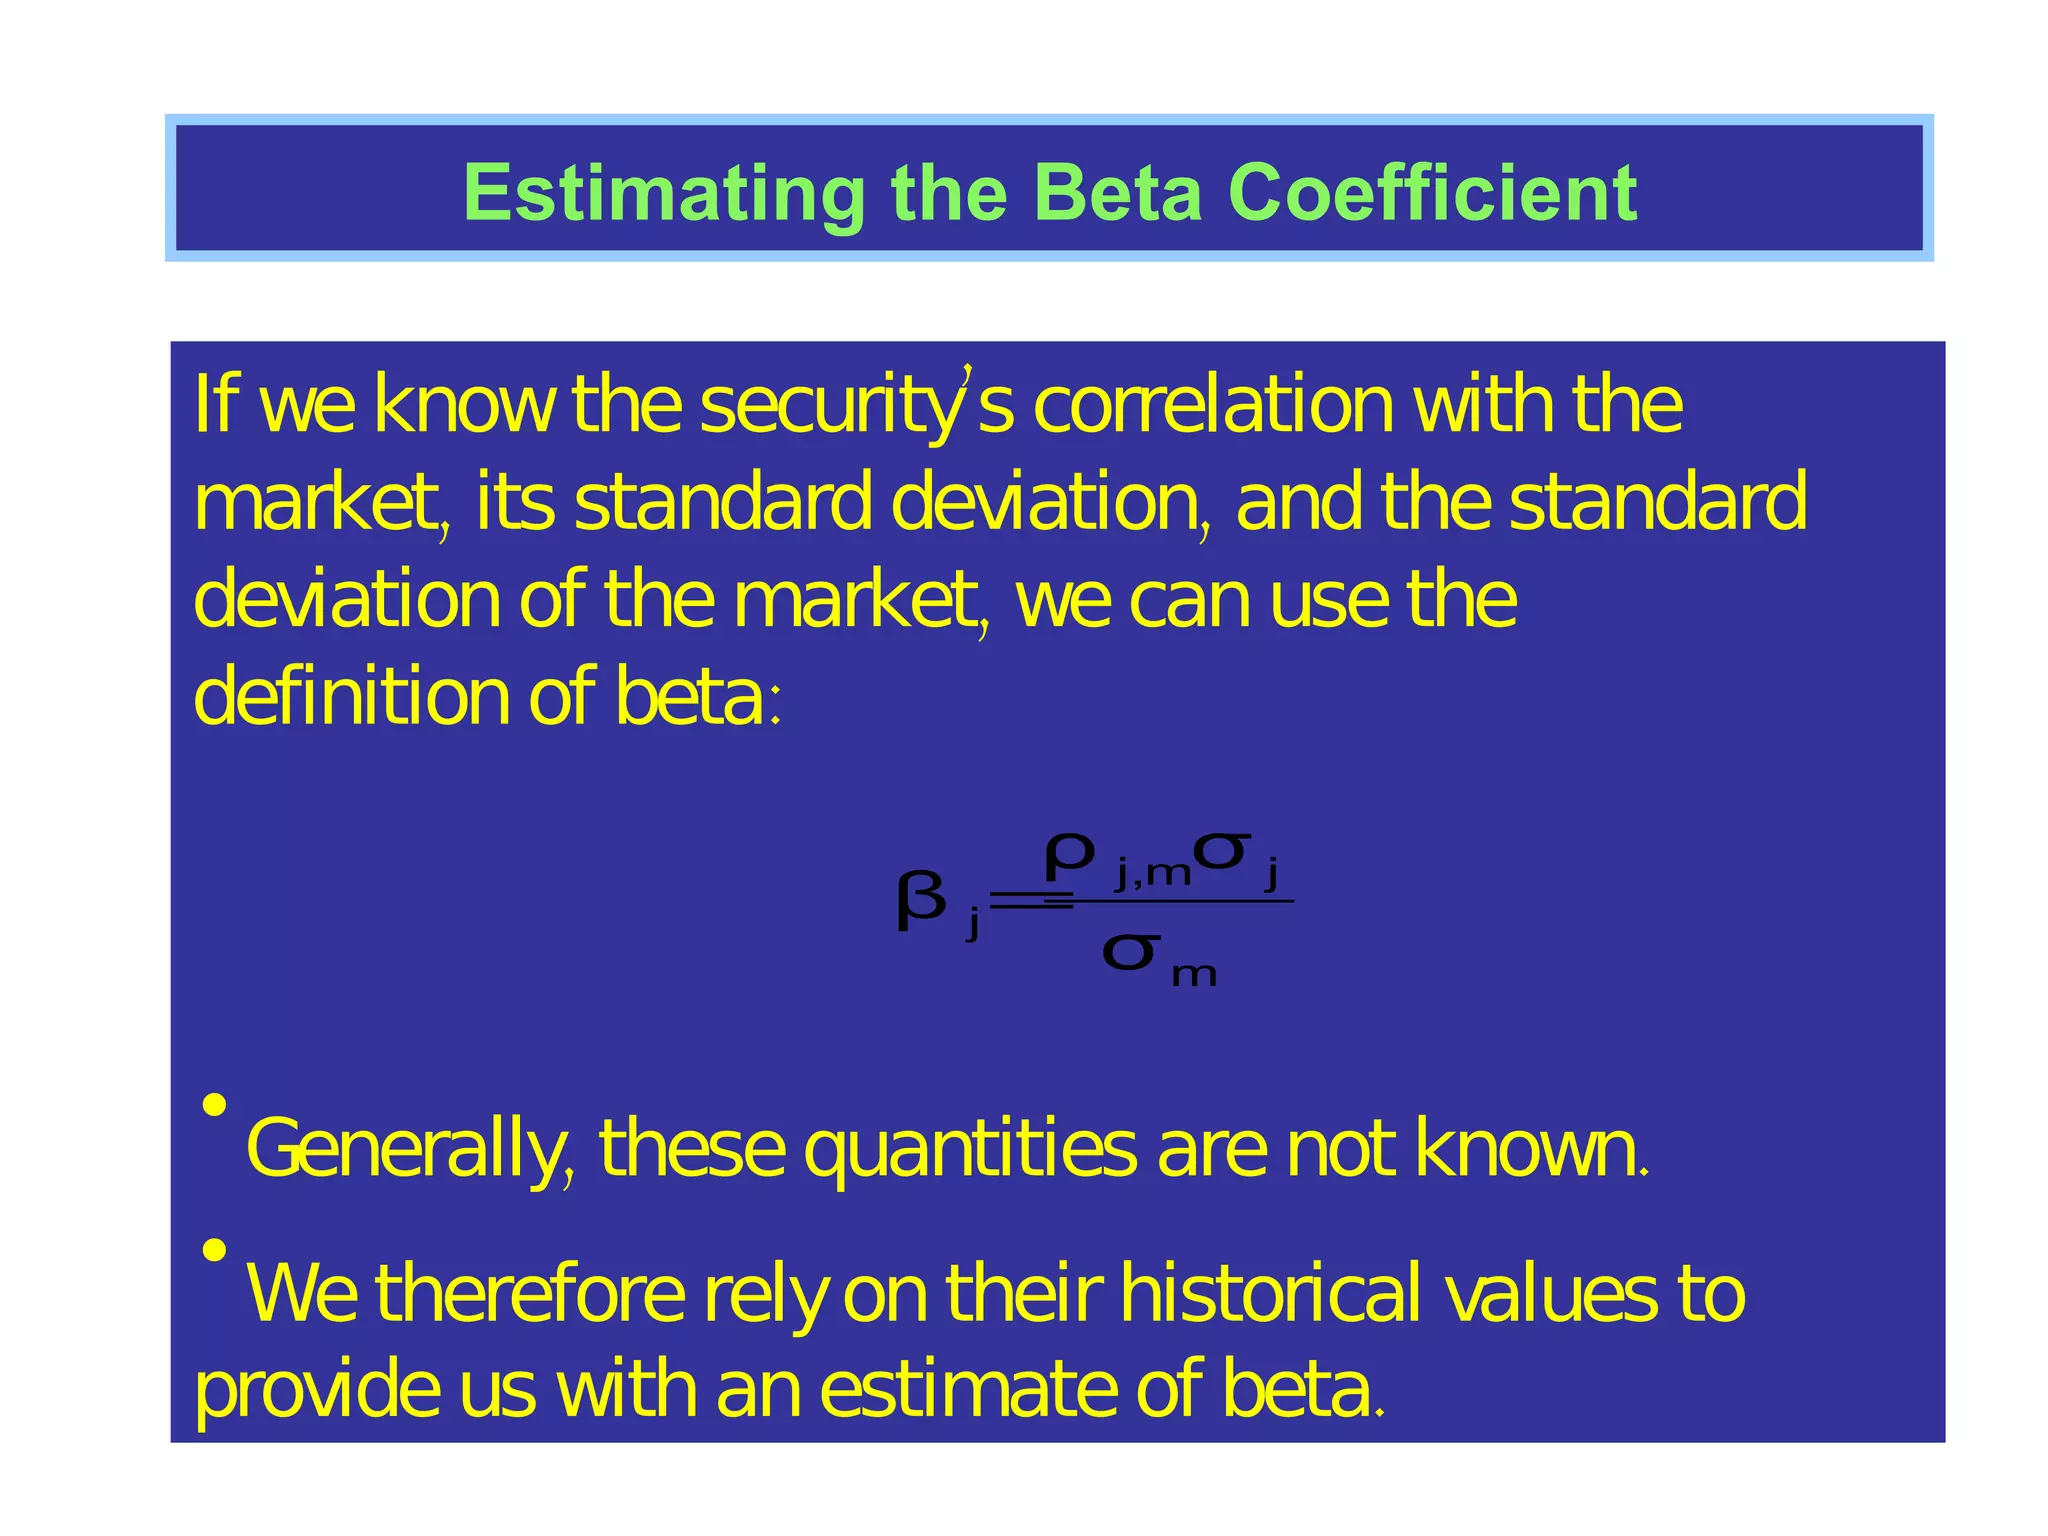
Framework for estimating the beta coefficient using market calculations.
Understanding beta's reflection of a security's risk with respect to the market.
Fundamentals about the beta coefficients of different types of portfolios.
Evaluation of the beta of a portfolio through weighted averages of individual securities.
Application of CAPM principles and diversification strategies in creating an investment portfolio.
Final thoughts on achieving diversification in investment portfolios.


