- Venture capital fundraising and the number of funded startups have significantly increased over the past 10 years, with yearly funded startups up 3x and yearly capital deployed up 6x.
- Private funding levels for startups closely follow public market performance, with funding announcements lagging public markets by 1-3 months. The report recommends raising funds now before public markets decline further.
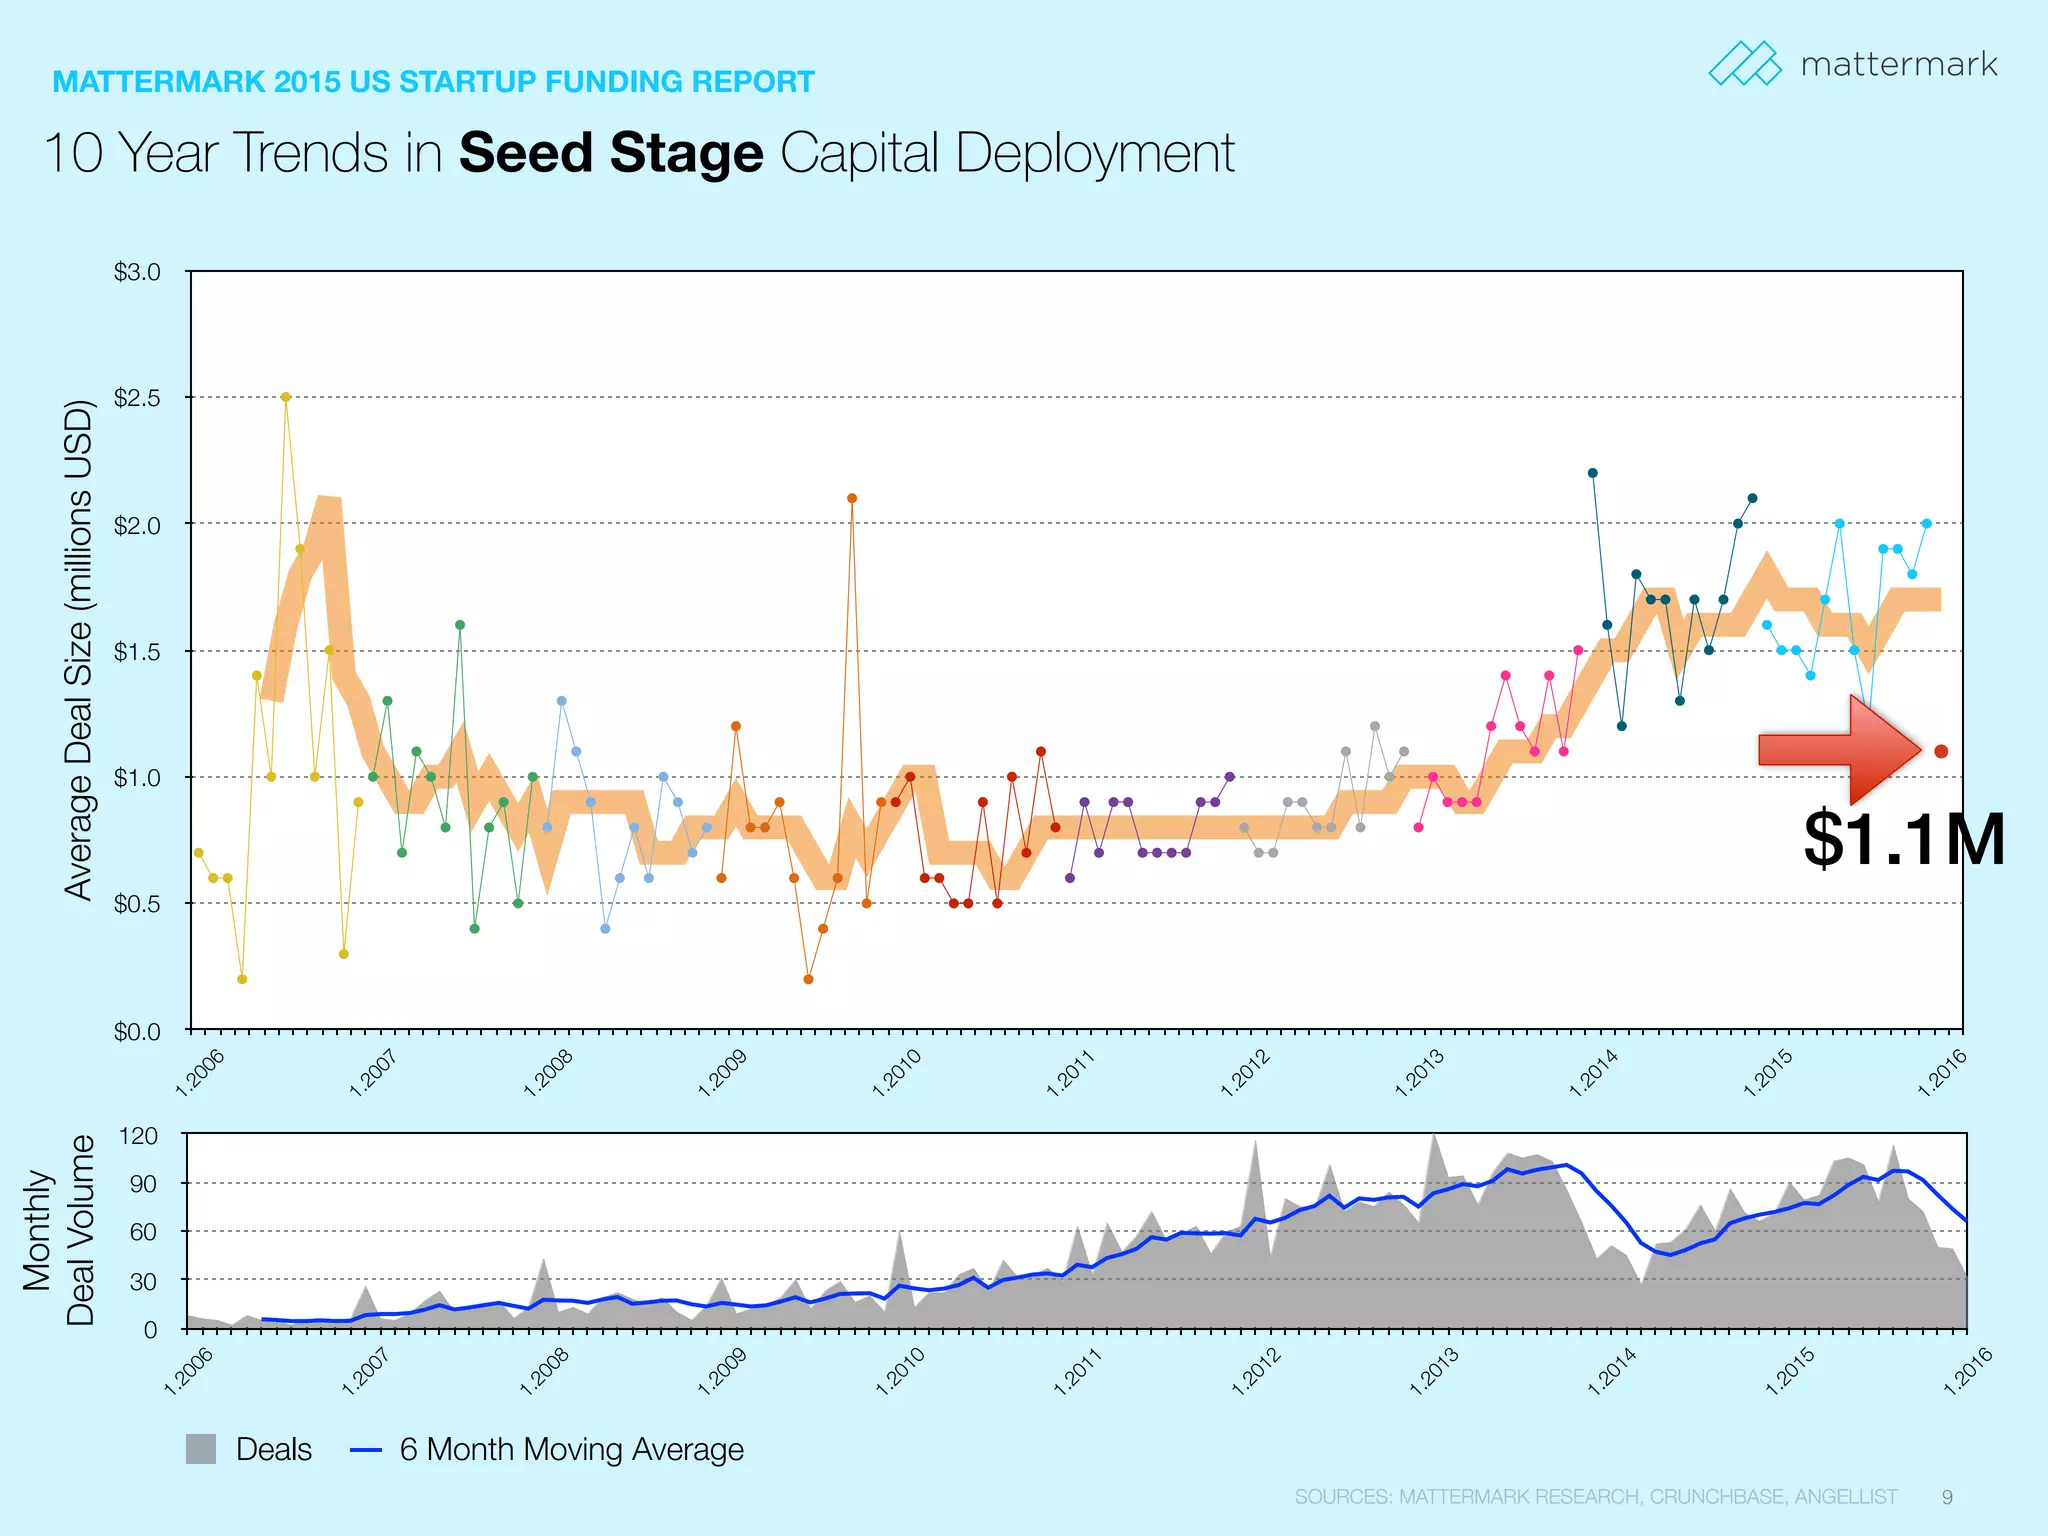
- Deal volumes have increased at all stages from seed to late stage financing over the past decade, though seed and Series A financing pace in 2016 is down compared to 2015 levels, with increased competition for deals.


![[PreMoney SF 2015] SoftTech VC >> Jeff Clavier, "Fund-Raising The Roof: How T...](https://cdn.slidesharecdn.com/ss_thumbnails/premoneytalk-jun15v2-150612061801-lva1-app6891-thumbnail.jpg?width=640&height=640&fit=bounds)


