Download as PDF, PPTX


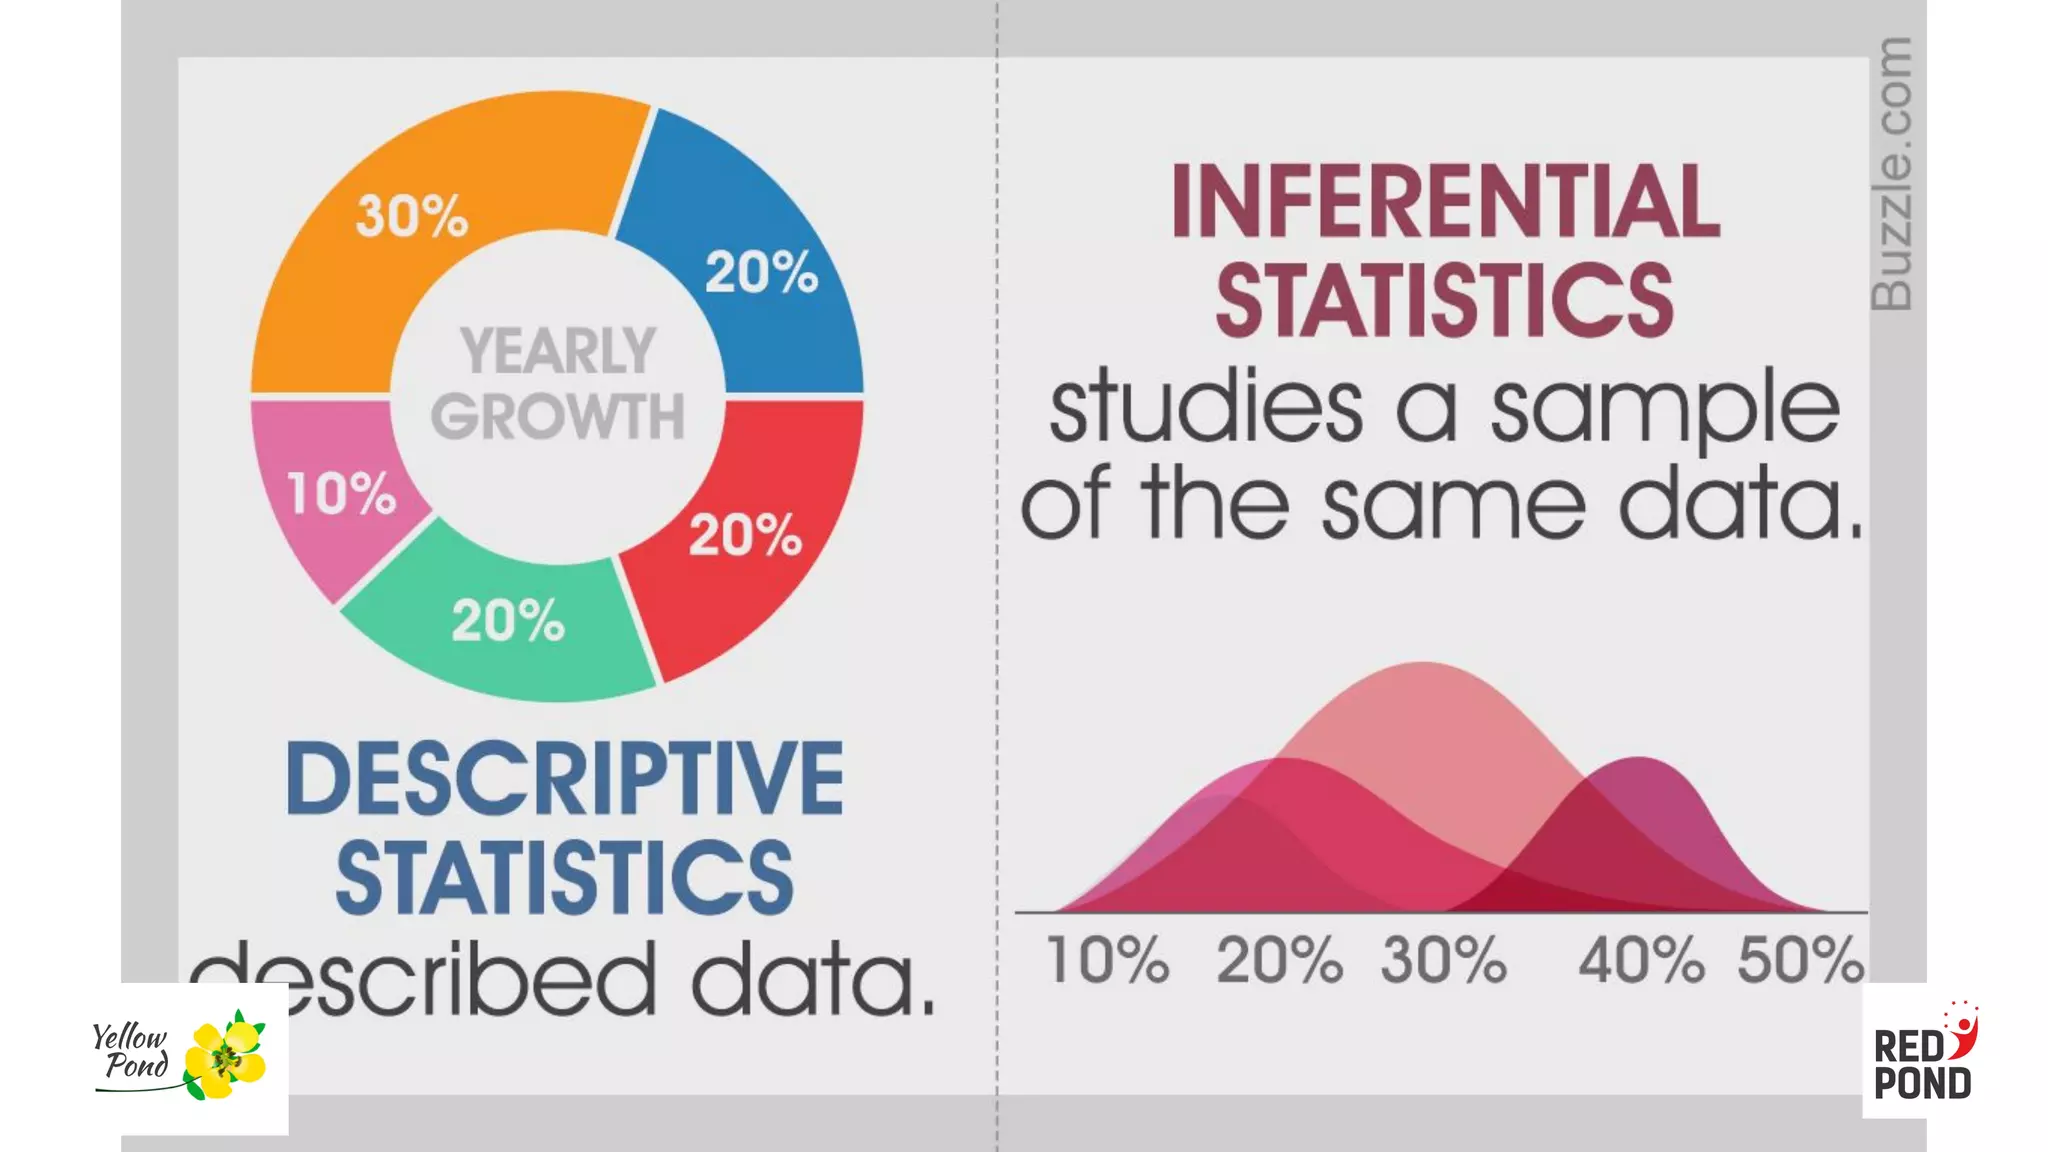


This document provides an overview of selecting appropriate statistics and tools for research. It discusses various types of statistical analysis including descriptive analysis, inferential analysis, differences analysis, association analysis, and predictive analysis. Descriptive analysis involves summarizing data through tables, graphs, and numerical measures of central tendency, variation, and distribution. Inferential analysis makes conclusions about a population based on a sample. Differences analysis examines whether two or more groups are the same or different. Association analysis looks at relationships between variables. Predictive analysis forecasts one variable based on others. The document also explains when to use parametric versus non-parametric statistics depending on factors like sample size, distribution, and scale of measurement.


