Signature recognition using clustering techniques dissertati
Download as PPT, PDF2 likes987 views

This document summarizes Vinayak Ashok Bharadi's dissertation on signature recognition using clustering techniques. It introduces the topic, outlines the problem definition and steps in signature recognition. It then discusses several preprocessing techniques, feature extraction methods like global features, grid and texture information, vector quantization, Walsh coefficients, and successive geometric centers. The document presents results and concludes by discussing the application of clustering techniques to signature recognition.


![Texture Feature
Texture feature gives information about the occurrence of
specific pixel pattern
We use a coarser segmentation method, divide the template
in 8 segments
To extract the texture feature group, the co-occurrence
matrices of the signature image are used
In a grey-level image, the co-occurrence matrix C [i, j] is
defined by first specifying a displacement vector d = (dx, dy)
and counting all pairs of pixels separated by d and having grey
level values i and j
In our case, the signature image is binary and therefore the
co-occurrence matrix is a 2 X 2 matrix describing the
transition of black and white pixels.](https://image.slidesharecdn.com/signaturerecognitionusingclusteringtechniquesdissertati-150106001522-conversion-gate02/85/Signature-recognition-using-clustering-techniques-dissertati-15-320.jpg)
![In a grey-level image, the co-occurrence matrix C [i, j] is defined by first specifying a
displacement vector d = (dx, dy) and counting all pairs of pixels separated by d and having
grey level values i and j
Therefore, the co-occurrence matrix C [i, j] is defined as
Where c00 is the number of times that two white pixels occurs, separated by d [d=(dx, dy)]
The image is divided into eight rectangular segments (4 X 2).
For each region the C (1, 0), C (1, 1), C (0, 1) and C (-1, 1) matrices are calculated and the c01
and c11 elements of these matrices are used as texture features of the signature.
Texture Feature
00 01
10 11
[ , ]C i j
c c
cc
=](https://image.slidesharecdn.com/signaturerecognitionusingclusteringtechniquesdissertati-150106001522-conversion-gate02/85/Signature-recognition-using-clustering-techniques-dissertati-16-320.jpg)


![Successive Geometric Centers – Depth1
Horizontal Splitting Vertical Splitting
maxmax
1 1
maxmax
1 1
[ , ]
[ , ]
x
yx
x b x y
x y
C yx
b x y
x y
= =
= =
=
∑ ∑
∑ ∑
maxmax
1 1
maxmax
1 1
[ , ]
[ , ]
y
yx
y b x y
x y
C yx
b x y
x y
= =
= =
=
∑ ∑
∑ ∑](https://image.slidesharecdn.com/signaturerecognitionusingclusteringtechniquesdissertati-150106001522-conversion-gate02/85/Signature-recognition-using-clustering-techniques-dissertati-31-320.jpg)


![Performance Comparison
Sr. Approach FAR FRR Accuracy
1 Signature Recognition using Clustering Technique 2.5/8.2 6.5/2.96 95.08
2 Contour Method [42] 11.60 13.20 86.90
3 Exterior Contours and Shape Features[42] 06.90 06.50 93.80
4 Local Granulometric Size Distributions [47] 07.00 05.00 -
5 Back-Propagation Neural Network Prototype [46] 10.00 06.00 -
6 Geometric Centers [36] 09.00 14.58 -
7 Two-stage neural network classifier [25] 03.00 09.81 80.81
8 Distance Statistics [40] 34.91 28.30 93.33
9 Modified Direction Feature [26] - - 91.12
10 Hidden Markov Model and Cross-Validation [11] 11.70 00.64 -
11 Discrete Random Transform and a HMM [48] 10.00 20.00 -
12 Kernel Principal Component Self-regression [23] 03.40 08.90 -
13 Parameterized Hough Transform [49] - - 95.24
14 Smoothness Index Based Approach [50] - - 79.00
15 Geometric based on Fixed-Point Arithmetic [51] 4.9-15.5 5.61-16.39 -
16 HMM and Graphometric Features [10] 23.00 01.00 -
17 Virtual Support Vector Machine [52] 13.00 16.00 -
18 Wavelet–based Verification [53] 10.98 05.60 -
19 Genetic Algorithm [44] 01.80 08.51 86.00](https://image.slidesharecdn.com/signaturerecognitionusingclusteringtechniquesdissertati-150106001522-conversion-gate02/85/Signature-recognition-using-clustering-techniques-dissertati-45-320.jpg)
![Performance Comparison
Sr. Approach FAR FRR EER Accuracy
1
Signature Recognition -Clustering
Technique 2.5/8.2 6.5/2.96 3.29/8.89 95.08
2 ER2 – Dynamic Time Wrapping [30] - - 7.20 -
3 On line SRS -Digitizer Tablet [24] 7.50-1.10 03.90 - -
4 Image Invariants and Dynamic Features [54] - - - 83.00
5 On Line SRS Model Guided Segmentation [6] 0.80 - 3.40
6 Conjugate Gradient Neural Networks [55] - - - 98.40
7 Consistency Functions [56] 01.00 07.00 - -
8 Variable Length Segmentation and HMM [58] 04.00 12.00 11.50 -
9 Implementing a DSP Kernel [3] < 0.01 - - >99.00
10 Dynamic Feature of Pressure [43] 6.80 10.80 - -
11 Low cost Dynamic SRS [45] 7.00 6.00 - -
Performance Comparison with On Line & Hardware Based Signature Recognition Systems](https://image.slidesharecdn.com/signaturerecognitionusingclusteringtechniquesdissertati-150106001522-conversion-gate02/85/Signature-recognition-using-clustering-techniques-dissertati-46-320.jpg)


Signature recognition using clustering techniques dissertati
- 1. Signature Recognition using Clustering Techniques By Vinayak Ashok Bharadi M E EXTC TSEC Guided By Dr. H B Kekre Prof. Computer Department TSEC Dissertation Seminar
- 2. Index Why Signature Recognition? Problem Definition Pre-processing of Signature Global Feature extraction Grid & Texture Information Feature Extraction Vector Quantization – a Clustering Technique Walsh coefficients Successive Geometric Centers as a Global Feature Results Conclusion
- 3. Why Signature Recognition? Main Application- Banking & E-commerce Document Authentication – Cheque, Wills, Official Documents Signature is an attribute used for decade for document authentication. Least user co-operation required. On-Line as well as off-line modes are possible. Signature Verification can be addressed as a problem in signal processing. Image processing techniques can be used.
- 4. Problem Definition Signature Recognition– Classified in two categories 1. On-line Signature Recognition 2. Off-Line Signature Recognition Steps in Signature Recognition 1. Data Acquisition 2. Pre-processing – Noise removal, Intensity Normalization, Resizing, Thinning. 3. Feature Extraction 4. Enrollment & Training 5. Performance Evaluation Performance Evaluation- Detection of different levels of forgeries. Performance Evaluation by FAR, FRR, CCR etc.
- 5. Signature Recognition using Clustering Techniques Clustering techniques – Signature Recognition is using Cluster features along with other feature set Cluster Based Features – 1. Codeword Histogram of a signature template & their Spatial Moments. 2. Grid & Texture Information feature Special Features- 1. Walsh Coefficients of Pixel Distributions 2. Successive Geometric Centers of Depth 2
- 6. Steps in Signature Recognition
- 8. Features of Signature template● Global Features● Standard Global Features● Special Features● Local Features● Pressure points, Velocity, Acceleration, Moments, Slope, Angle Feature Extraction
- 9. Standard Global FeaturesIn the program we consider a Normalized signature template of dimensions 200 X 160 pixels. We consider following global features. 1. Number of pixels – Total Number of black pixels in a signature template 2. Picture height - The height of the signature image after vertical blank spaces removed. 3. Picture width- The width of the image with horizontal blank spaces removed 4. Maximum horizontal projection- The horizontal projection histogram is calculated and the highest value of it is considered as the maximum horizontal projection . 5. Maximum vertical projection- The vertical projection of the skeletonized signature image is calculated. The highest value of the projection histogram is taken as the maximum vertical projection . 6. Dominant Angle -dominant angle of the signature, angle formed by the center of masses with the baseline of the signature. 7. Baseline shift- This is the difference between the y-coordinate of centre of mass of left and right part. We calculate this by calculating the center of mass of left and right part of the signature. The difference between y co-ordinates of the center of masses is the baseline shift. This is a parallel feature to the dominant angle but gives extra information about the signatures. Two signatures may have same dominant angle but at the same time they may have different baseline shift. This helps for achieving classification accuracy. 8. Signature surface area – here we consider the modified tri-area feature .
- 10. Area Generation Results Original Algorithm Modified Algorithm Area1 Area2 Area3 Area1 Area2 Area3 1 0.1108 0.1823 0.0542 0.1699 0.2565 0.1066 2 0.0593 0.1809 0.1457 0.0815 0.1951 0.1571 3 0.0489 0.0785 0.0570 0.1040 0.1400 0.1121 Modified AlgorithmOriginal Algorithm Area Generated for signatures
- 11. Global Feature Vector Sr. Feature Extracted Value 1 Number of pixels 547 2 Picture Width (in pixels) 166 3 Picture Height (in pixels) 137 4 Horizontal max Projections 12 5 Vertical max Projections 15 6 Dominant Angle-normalized 0.694 7 Baseline Shift (in pixels) 47 8 Area1 0.151325 9 Area2 0.253030 10 Area3 0.062878 Signature Template Feature Extracted from the signature
- 12. Special Features We are considering following special features of the signature 1. Grid & Texture Information Features 2. Walsh coefficients of horizontal and vertical pixel projections 3. Codeword Histogram & Spatial Moments of codewords 4. Successive Geometric Centers of Depth 2
- 13. Grid Information Features Representation of the grid feature vector of a signature (a) Original Signature (b) Normalized Signature (c) Representation of grid feature.
- 14. Grid Information Features (a) (b) The Grid Feature Matrix for the signature (a) Normalized Matrix (b) Original Pixel Values
- 15. Texture Feature Texture feature gives information about the occurrence of specific pixel pattern We use a coarser segmentation method, divide the template in 8 segments To extract the texture feature group, the co-occurrence matrices of the signature image are used In a grey-level image, the co-occurrence matrix C [i, j] is defined by first specifying a displacement vector d = (dx, dy) and counting all pairs of pixels separated by d and having grey level values i and j In our case, the signature image is binary and therefore the co-occurrence matrix is a 2 X 2 matrix describing the transition of black and white pixels.
- 16. In a grey-level image, the co-occurrence matrix C [i, j] is defined by first specifying a displacement vector d = (dx, dy) and counting all pairs of pixels separated by d and having grey level values i and j Therefore, the co-occurrence matrix C [i, j] is defined as Where c00 is the number of times that two white pixels occurs, separated by d [d=(dx, dy)] The image is divided into eight rectangular segments (4 X 2). For each region the C (1, 0), C (1, 1), C (0, 1) and C (-1, 1) matrices are calculated and the c01 and c11 elements of these matrices are used as texture features of the signature. Texture Feature 00 01 10 11 [ , ]C i j c c cc =
- 17. The Pixel positions while scanning for the displacement vector are as follows We get a matrix having total 64 elements as the feature vector. (2 Elements X 4 matrices X 8 segments) Texture Feature
- 18. Application of VQ for Signature Recognition
- 19. Application of VQ for Signature Recognition
- 20. Codebook Generation Codebook Plays important role in codeword histogram generation. We divide this process in three parts
- 21. Codebook Optimization - Sorting
- 22. We have total 11755 codewords, to form the codeword histogram we form codeword groups. various combinations are tried in software code. Here we present grouping of 12 codewords to form total 980 groups. The participants of group are codewords with minimum intra group hamming distance and hence they represent a set of similar blocks and hence similar signature template segments. We use this codeword groups to generate codeword Histogram. Codeword Grouping
- 23. Codeword Grouping Codeword Groups formed after grouping process
- 24. Adding Spatial Moments We also add the spatial information about the codewords. This is done by calculating moments for each codeword group. We find moments of gravity(G) and inertia (I). 1 1 M x i i G x M = = ∑ 1 1 N y i i G y N = = ∑ 2 1 1 n x i i I x M = = ∑ 2 1 1 n y i i I y M = = ∑ We have to total 1960 (980 for G + 980 for I) elements for the codeword histogram of the signature template. We use codeword histogram and associated moments as a feature set of the signature template.
- 25. Classification using VQ We have sequence of numbers as parameters. We have codeword histogram as an array of 980 elements. Two arrays of moment of gravity and inertia(G & I). To evaluate similarity between such sequences we use a Euclidian distance based formula. The feature vector for signature template I1 and the feature vector for test signature I2 are given below, I1= {W11, W21, … WN1} , I2= {W12 , W22 , … WN2 } In the histogram model, Wij = Fij , where Fij is the frequency of group Ci appearing in Ij The feature vectors I1 and I2 are the codeword histograms
- 26. Similarity Score The similarity measure S is defined as Where the distance function (dis(I2,I1)) is This formula is used to evaluate the similarity between two codeword Histograms, to evaluate the similarity between spatial information we use simple Euclidian distance. 1 | 1 2 | ( 2, 1) 1 1 2 N i Wi Wi dis I I Wi Wi= − = + + ∑ 1 ( 2, 1) 1 ( 2, 1) s I I dis I I = +
- 27. Walsh Coefficients of Pixel Distributions These are another set of global features proposed in this project. Rather than matching the distributions directly we match their interpret these distributions as signals and match their Walsh coefficients.
- 28. First we generate Hadamard coefficients by multiplying the pixel distribution values by Hadamard matrix. We have a signature template 0f 200 x 160 (transferred to 256 x 256 window) pixels and Hadamard matrix of 256 x 256. Then a Hadamard matrix of order 256X256 is used to transform the coefficient of horizontal and vertical pixel distributions HP (i), VP (i) HCH(i)=∑ n HD(n)*HP(n)… i=0,1,….255 (Hadamard Coeff. Horizontal) HCV(i)= ∑ n HD(n)*VP(n)… i=0,1,….255 (Hadamard Coeff. Vertical) These coefficients are not sequency ordered, we arrange these coefficients using kekre’s Algorithm. this yields the Walsh Hadamard transform (WHT) Walsh-Hadamard Transform
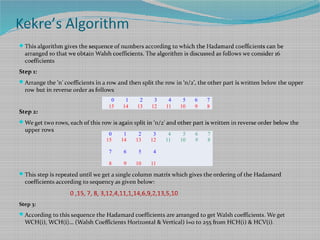
- 29. Kekre’s Algorithm This algorithm gives the sequence of numbers according to which the Hadamard coefficients can be arranged so that we obtain Walsh coefficients. The algorithm is discussed as follows we consider 16 coefficients Step 1: Arrange the ‘n’ coefficients in a row and then split the row in ‘n/2’, the other part is written below the upper row but in reverse order as follows Step 2: We get two rows, each of this row is again split in ‘n/2’ and other part is written in reverse order below the upper rows This step is repeated until we get a single column matrix which gives the ordering of the Hadamard coefficients according to sequency as given below: 0 ,15, 7, 8, 3,12,4,11,1,14,6,9,2,13,5,10 Step 3: According to this sequence the Hadamard coefficients are arranged to get Walsh coefficients. We get WCH(i), WCH(i)… (Walsh Coefficients Horizontal & Vertical) i=0 to 255 from HCH(i) & HCV(i). 0 1 2 3 4 5 6 7 15 14 13 12 11 10 9 8 0 1 2 3 4 5 6 7 15 14 13 12 11 10 9 8 7 6 5 4 8 9 10 11
- 30. Walsh Coefficients of Pixel Distributions
- 31. Successive Geometric Centers – Depth1 Horizontal Splitting Vertical Splitting maxmax 1 1 maxmax 1 1 [ , ] [ , ] x yx x b x y x y C yx b x y x y = = = = = ∑ ∑ ∑ ∑ maxmax 1 1 maxmax 1 1 [ , ] [ , ] y yx y b x y x y C yx b x y x y = = = = = ∑ ∑ ∑ ∑
- 32. Successive Geometric Centers – Depth2 Horizontal Splitting Vertical Splitting
- 34. Enrollment of User’s Signatures Sr. Feature 1 2 3 4 5 6 7 8 1 Number of pixels 547 545 563 588 527 534 588 548 2 Picture Width (in pixels) 166 168 173 174 155 168 169 162 3 Picture Height (in pixels) 137 136 134 137 135 137 131 138 4 Horizontal max Projection 12 14 13 15 12 15 13 15 5 Vertical max Projection 15 13 14 18 13 12 16 13 6 Dominant Angle-normalized 0.6947 0.6882 0.6801 0.6902 0.6988 0.6923 0.6810 0.6902 7 Baseline Shift (in pixels) 47 47 47 49 49 49 46 49 8 Area1 0.1513 0.1329 0.1362 0.1337 0.1062 0.1170 0.1508 0.1180 9 Area2 0.2530 0.2250 0.2369 0.2264 0.2275 0.1955 0.2218 0.1880 10 Area3 0.0629 0.0656 0.1237 0.0764 0.0938 0.0536 0.0501 0.1006 Global Feature vectors of training signatures of a person
- 35. Medians & Threshold Values Sr. Feature Median Threshold 1 Number of pixels 547 41.7533 2 Picture Width (in pixels) 168 9.6354 3 Picture Height (in pixels) 136 3.6218 4 Horizontal max Projection 13 2.1780 5 Vertical max Projection 14 3.4881 6 Dominant Angle-normalized 0.69021 0.0116 7 Baseline Shift (in pixels) 47.0000 2.1606 8 Area1 0.133712 0.0271 9 Area2 0.22642 0.0267 10 Area3 0.065625 0.0422 11 Walsh H Distance 434.433 119.1174 12 Walsh V Distance 600.1525 94.5732 13 Grid Distance 281.0818 62.1866 14 Texture Distance 62.14499 33.6398 15 Vector Quantization S-Score 3.484029 0.5065 16 Vector Quantization F-ED 16.91153 3.5894 17 VQ SP Moment Gravity GX 151.9263 13.2024 18 VQ SP Moment Gravity GY 132.6735 11.9961 19 VQ SP Moment Inertia IX 5325.065 491.8736 20 VQ SP Moment Inertia IY 3765.733 413.7919 21 Geometric center HX - 48.0114 22 Geometric center HY - 39.5296 23 Geometric center VX - 46.0604 24 Geometric center VY - 29.9552
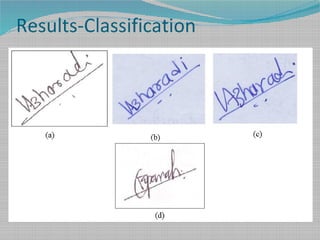
- 37. Result -Signature Verification (a) (b) (c) (d)
- 38. Result-Signature Recognition Signature Recognition Result - 6/9/2007 8:37:27 PM Maximum match = 73.31 found for UID 1 and the Signature is ACCEPTED, Authentic user.
- 39. Performance Analysis 400 1000 600 800 1200 1400 1600 1800 0 20 40 60 80 100 120 Walsh Coefficients FRR FAR FR R Threshold %Acceptance EER=40% 60 75 80 85 90 95 100 105 110 115 120 0 10 20 30 40 50 60 70 80 Geometric Centers FAR FRR FR R Threshold % Acceptance Ratio EER=16% Sr. Parameter Value 1 FAR 50.00% 2 FRR 31.67% 3 TAR 68.33 % 4 TRR 50.00% 5 CCR 59.17% 6 FCR 41.83% Performance Metrics for Walsh Coefficients Sr. Parameter Value 1 FAR 05.45% 2 FRR 34.55% 3 TAR 65.45 % 4 TRR 94.55% 5 CCR 80.00% 6 FCR 20.00% Performance Metrics for Geometric Centers
- 40. 100 150 200 250 300 350 400 450 500 0 20 40 60 80 100 120 Grid Feature FAR FRR FAR FRR Threshold % Acceptance EER=18% 20 70 120 170 220 270 320 370 420 0 20 40 60 80 100 120 Texture Feature FAR FRR FA R Threshold %Acceptance EER=19% Performance Analysis Sr. Parameter Value 1 FAR 24.00% 2 FRR 06.67% 3 TAR 93.33 % 4 TRR 76.00% 5 CCR 84.67% 6 FCR 15.33% Performance Metrics for Grid Features Sr. Parameter Value 1 FAR 24.00% 2 FRR 17.33% 3 TAR 82.67 % 4 TRR 76.00% 5 CCR 91.33% 6 FCR 8.67% Performance Metrics for Texture Features
- 41. Performance Analysis- VQ 2.5 2.7 2.9 3.1 3.3 3.5 3.7 3.9 4.0999999999999996 4.3 4.5 4.7 4.9000000000000004 0 20 40 60 80 100 120 S-Score FAR FRR FR R Threshold %Acceptance EER=22% 3400 4200 5000 5800 6600 7400 8200 9000 0 20 40 60 80 100 120 VQ-Moment of Inertia FAR FRR FAR FRR Threshold %Acceptance EER=36% 1800 2200 2600 3000 3400 3800 4200 4600 5000 0 20 40 60 80 100 120 VQ-Moment of Gravity FAR FRR FAR FRR Threshold % Acceptance EER=40% 10 12 14 16 18 20 22 24 26 28 30 32 34 0 20 40 60 80 100 120 Euclidian Distance FAR FRR FA R Threshold % Acceptance EER=21%
- 42. Performance Analysis Sr. Parameter VQS VQED SPMG SPMI 1 FAR 20 32.85 41 37.15 2 FRR 24.14 12.86 39 35.72 3 TAR 72.85 87.14 61 64.28 4 TRR 64.28 67.15 59 62.85 5 CCR 68.57 77.14 60 63.57 6 FCR 31.43 22.86 40 36.42 VQS VQED SPMG SPMI 0 10 20 30 40 50 60 70 80 90 CCR FCR for VQ CC R Feature parameter Value VQS VQED SPMG SPMI 0 5 10 15 20 25 30 35 40 45 FAR FRR for VQ FA R Feature Parameter Value Performance Metrics for VQ-features
- 43. Performance Analysis- SRS Test Mode Inputs Test Signatures Accepted/ Rejected Signatures Performance Metrics % Verification Cases That Should be Accepted 152 Cases Actually Accepted 142 TAR 93.42 Cases Falsely Rejected 10 FRR 06.58 Cases That Should be Rejected 201 Cases Actually Rejected 195 TRR 97.50 Cases Falsely Accepted 06 FAR 02.50 Recognition Cases That Should be Accepted 135 Cases Actually Accepted 131 TAR 97.04 Cases Falsely Rejected 04 FRR 02.96 Cases That Should be Rejected 122 Cases Actually Rejected 112 TRR 91.80 Cases Falsely Accepted 10 FAR 08.20 -20 -8 4 16 28 40 52 64 76 88 100 0 20 40 60 80 100 120 Recognition Mode -FAR-FRR Plot FA R Threshold % Acceptance EER=6% -54 -45 -36 -27 -18 -9 0 9 18 27 36 45 54 63 72 81 90 99 0 20 40 60 80 100 120 Signature Verification-FAR-FRR Plot FAR Threshold % Acceptance EER=3.29% The above mention entries indicate that out of total 610 tests conducted 580 tests gave correct classification and 30 test were failed hence the overall accuracy reported is 95.08%.
- 44. Performance Analysis- SRS Sr. Parameter Verification Mode Recognition Mode 1 FAR 02.50 08.20 2 FRR 06.58 02.96 3 TAR 93.42 97.04 4 TRR 97.50 91.80 5 CCR 95.46 94.55 6 FCR 04.54 05.45 Performance Metrics in percentage for Signature Recognition System Test Samples Ratio Results obtained on the given test bed All sample of a subject Genuine TAR 93.42 FRR 06.58 Forged Casual FAR 00.00 TRR 100.00 Skilled FAR 05.60 TRR 94.40 Performance Metrics for Final System Sr Feature FAR FRR 1 Walsh Coefficients 40% 42% 2 Vector Histogram 12% 22% 3 Grid Feature 8% 12% 4 Texture Feature 14% 20% 5 Final System 2.5% 6.5% Performance Metrics for features Extracted
- 45. Performance Comparison Sr. Approach FAR FRR Accuracy 1 Signature Recognition using Clustering Technique 2.5/8.2 6.5/2.96 95.08 2 Contour Method [42] 11.60 13.20 86.90 3 Exterior Contours and Shape Features[42] 06.90 06.50 93.80 4 Local Granulometric Size Distributions [47] 07.00 05.00 - 5 Back-Propagation Neural Network Prototype [46] 10.00 06.00 - 6 Geometric Centers [36] 09.00 14.58 - 7 Two-stage neural network classifier [25] 03.00 09.81 80.81 8 Distance Statistics [40] 34.91 28.30 93.33 9 Modified Direction Feature [26] - - 91.12 10 Hidden Markov Model and Cross-Validation [11] 11.70 00.64 - 11 Discrete Random Transform and a HMM [48] 10.00 20.00 - 12 Kernel Principal Component Self-regression [23] 03.40 08.90 - 13 Parameterized Hough Transform [49] - - 95.24 14 Smoothness Index Based Approach [50] - - 79.00 15 Geometric based on Fixed-Point Arithmetic [51] 4.9-15.5 5.61-16.39 - 16 HMM and Graphometric Features [10] 23.00 01.00 - 17 Virtual Support Vector Machine [52] 13.00 16.00 - 18 Wavelet–based Verification [53] 10.98 05.60 - 19 Genetic Algorithm [44] 01.80 08.51 86.00
- 46. Performance Comparison Sr. Approach FAR FRR EER Accuracy 1 Signature Recognition -Clustering Technique 2.5/8.2 6.5/2.96 3.29/8.89 95.08 2 ER2 – Dynamic Time Wrapping [30] - - 7.20 - 3 On line SRS -Digitizer Tablet [24] 7.50-1.10 03.90 - - 4 Image Invariants and Dynamic Features [54] - - - 83.00 5 On Line SRS Model Guided Segmentation [6] 0.80 - 3.40 6 Conjugate Gradient Neural Networks [55] - - - 98.40 7 Consistency Functions [56] 01.00 07.00 - - 8 Variable Length Segmentation and HMM [58] 04.00 12.00 11.50 - 9 Implementing a DSP Kernel [3] < 0.01 - - >99.00 10 Dynamic Feature of Pressure [43] 6.80 10.80 - - 11 Low cost Dynamic SRS [45] 7.00 6.00 - - Performance Comparison with On Line & Hardware Based Signature Recognition Systems
- 47. Conclusion The system uses conventional as well as non-conventional global features. These features include Vector Quantization based codeword histogram, Walsh Coefficients, Grid & Texture Information Features, and Geometric Centers. The Vector Quantization based codeword histogram has been proposed first time as a cluster feature for signature verification and it is effectively used for the purpose. This feature has Correct Classification Ratio (CCR) of 77.14%. The other contributions include Walsh coefficients of the pixel distribution of the signatures. This feature has individual CCR of 59.17%. Grid & Texture information features and successive geometric centers are the modified features that are used for signature recognition. Signature verification as well as signature recognition is possible with the program developed. Overall Accuracy of the system is 95.08%. The system has FAR of 2.5 % & FRR of 6.58 % in verification mode and FAR of 8.20 % and FRR of 2.96% in the recognition mode. For the FAR-FRR the equal rate EER is 3.29%
- 48. Paper Published National Level technical papers: 1. New Parameter for Signature Recognition: Walsh Coefficient of Vertical and Horizontal Histogram, National Conference on Communication and Signal Processing (NCCSP 2007), Mumbai,April-2007 2. Signature Recognition by Novel and Simple Contour Technique, National Conference on Communication and Signal Processing (NCCSP 2007), Mumbai, April-2007 3. Successive Geometric Centers of a signature template, National Conference on Signal Processing & Automation (NCSPA 2007), Pune, September 2007 4. Grid & Texture Features for signature recognition, National Conference on Emerging Trends in Control & Instrumentation-(NCETCI 2007), Mumbai, October 2007 International Level technical papers: 1. Walsh Coefficients of the Horizontal & Vertical Pixel Distributions of Signature Template, International Conference of Information Processing 2007 (ICIP 2007), Bangalore, August 2007 2. Vector Quantization applied for Signature Recognition, International Conference on Advances in Computer Vision and Information Technology 2007 (ACVIT 2007), Aurangabad, Maharashtra, Nov 2007 3. Performance Analysis of Geometric centers of Depth2, Paper Selected for International Conference on Emerging Technologies and Applications in Engineering Technology and Sciences (ICETAETS 2008), Rajkot, January 2008 4. Performance Analysis of Grid & Texture Features, Paper Selected for International Conference on Sensors, Signal Processing, Communication, Control and Instrumentation (SSPCCIN-2008), Pune, January 2008 5. Performance Analysis of Codeword Histogram & Spatial Moments for Signature Recognition, Paper Selected for SPIT-IEEE Colloquium 2008, Mumbai, February 2008 References
- 49. Questions ?
- 50. Thank You !!