Approaches to Consumer
Behaviour• Propounded by
Marshall
• Known as Marshalling
Approach
Cardinal
Utility
Approach
• Propounded by Hicks
& Allen
• Known as Indifference
Curve Analysis
Ordinal
Utility
Approach
1
2.
Utility
2
• Utility issynonymous with “Pleasure”,
“Satisfaction” & a Sense of Fulfillment
of Desire.
• Utility → “WANT SATISFYING POWER”
of a Commodity.
• Utility is a
Psychological
Phenomenon.
3.
-Mrs.
Utility
• Utility refersto Abstract Quality whereby an
Object Serves our Purpose.
-
Jevons
• Utility is the Quality of a Good to Satisfy a
Want.
-Hibdon
• Utility is the Quality in Commodities that
makes Individuals want to buy them.
4.
5
Features of Utility
•Utility is Subjective
It deals with the Mental Satisfaction of a Man.
For Example, Liquor has Utility for a Drunkard but for a
Teetotaler, it has no Utility.
• Utility is Relative
– Utility of a Commodity never remains same. It varies
with Time, Place & Person. For example, Cooler has
utility in Summer but not during Winter.
5.
6
• Utility isNot Essentially Useful
– A Commodity having Utility need not be Useful.
E.g., Liquor is not useful, but it Satisfies the Want
of an Addict thus have Utility for Him.
• Utility is Ethically Neutral
– Utility has nothing to do with Ethics. Use of
Liquor may not be good from the Moral Point of
View, but as these Intoxicants Satisfy wants of the
Drunkards, they have utility.
Features of Utility
6.
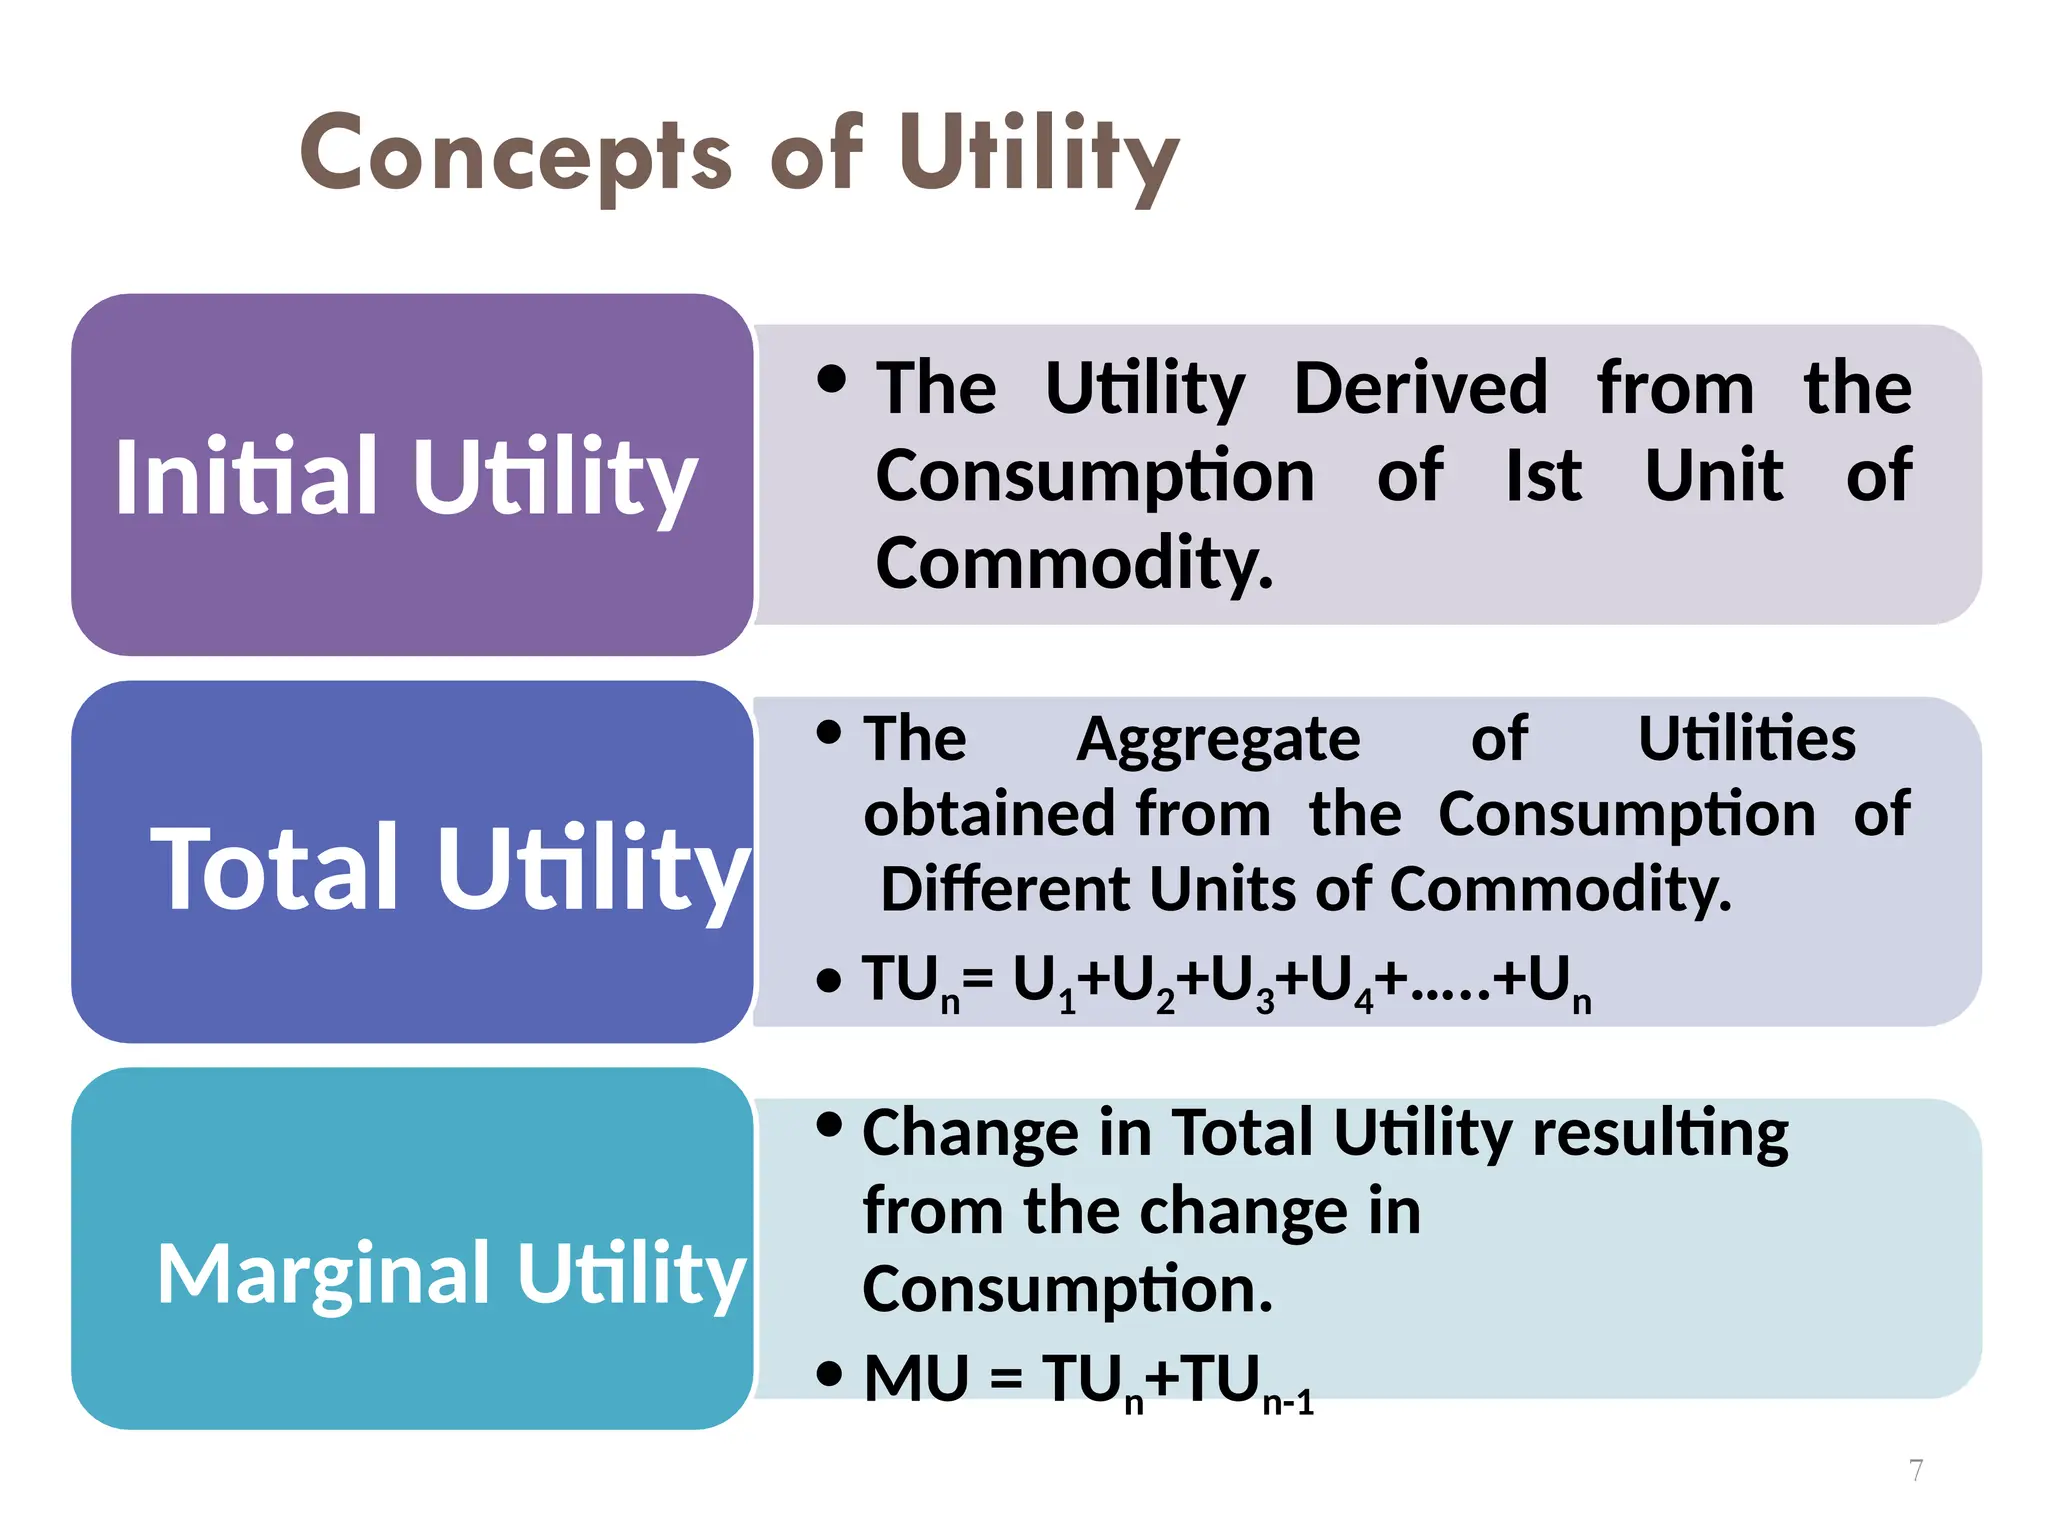
Concepts of Utility
•The Utility Derived from the
Consumption of Ist Unit of
Commodity.
Total Utility
• Change in Total Utility resulting
from the change in
Consumption.
• MU = TUn+TUn-1
Marginal Utility
Initial Utility
7
• The Aggregate of Utilities
obtained from the Consumption of
Different Units of Commodity.
• TUn= U1+U2+U3+U4+…..+Un
7.
mer
Types of MarginalUtility
• With Consumption of an
Additional Unit of a Commodity,
Total Utility Increases.
Positive
Marginal
Utility
• With Consumption of an
Additional Unit of a
Commodity, Total Utility
Remains Same.
Zero Marginal
Utility
•With Consumption of an
Additional Unit of a
Commodity, Total Utility
decrease
Negative
Marginal
Utility 8
8.
8
Marginal Utility Analysis
(MUA)
•Formulated by Alfred Marshall.
• Theory Explains How a Consumer
spends his Income on Different
Goods & Services so as to attain
Maximum Satisfaction.
• Based on Certain Assumptions.
9.
Assumptions to MUA
9
•Cardinal Measurability of Utility
–Utility is a Measureable & Quantifiable
Entity.
–Money is the Measuring Rod of Utility
i.e. The amount of Money which a
Person is prepared to Pay for a Unit of
Good rather than go without it is a
Measure of Utility Derived.
10.
Assumptions to MUA
10
•Constancy of the Marginal Utility
of Money
–MU of Money remains Constant.
–Not Realistic. But has been made in
order to Facilitate the Measurement of
Utility of Commodity in Terms of
Money.
11.
Assumptions to MUA
11
•Hypothesis of Independent Utility
–Theory Ignores
Complementarity
Between Goods.
–
Total
Utility derived from Whole
Collection of Goods Purchased is the
Sum Total of Separate Utilities of
the Good.
Indifference Curve
• ASingle Indifference Curve shows the different
Combinations of X and Y that yield Equal
Satisfaction to the Consumer.
-
Leftwitch
• An Indifference Curve is a Combination of Goods,
each of which yield the same level of total
utility to which the consumer is indifferent.
14.
26
Assumptions to Indifference
CurveAnalysis
• Rationality of Consumer
– The Consumer is Rational & aims at maximizing
his Total Satisfaction.
• Ordinal Utility
– Utility can be expressed Ordinally i.e.
Consumer is able to tell only Order of his
Preferences.
• Non-satiety
Consumer is not Oversupplied with goods in
Questions.
15.
27
Assumptions to Indifference
CurveAnalysis
• Transitivity of Choice
–Means that if a Consumer prefers A to B & B
to C, he must prefer A to C.
• Consistency of Choice
–Means that if a Consumer prefers A to B in
one period, he will not prefer B to A in
another period or Treat them as Equal.
• Diminishing Marginal Rate of Substitution
16.
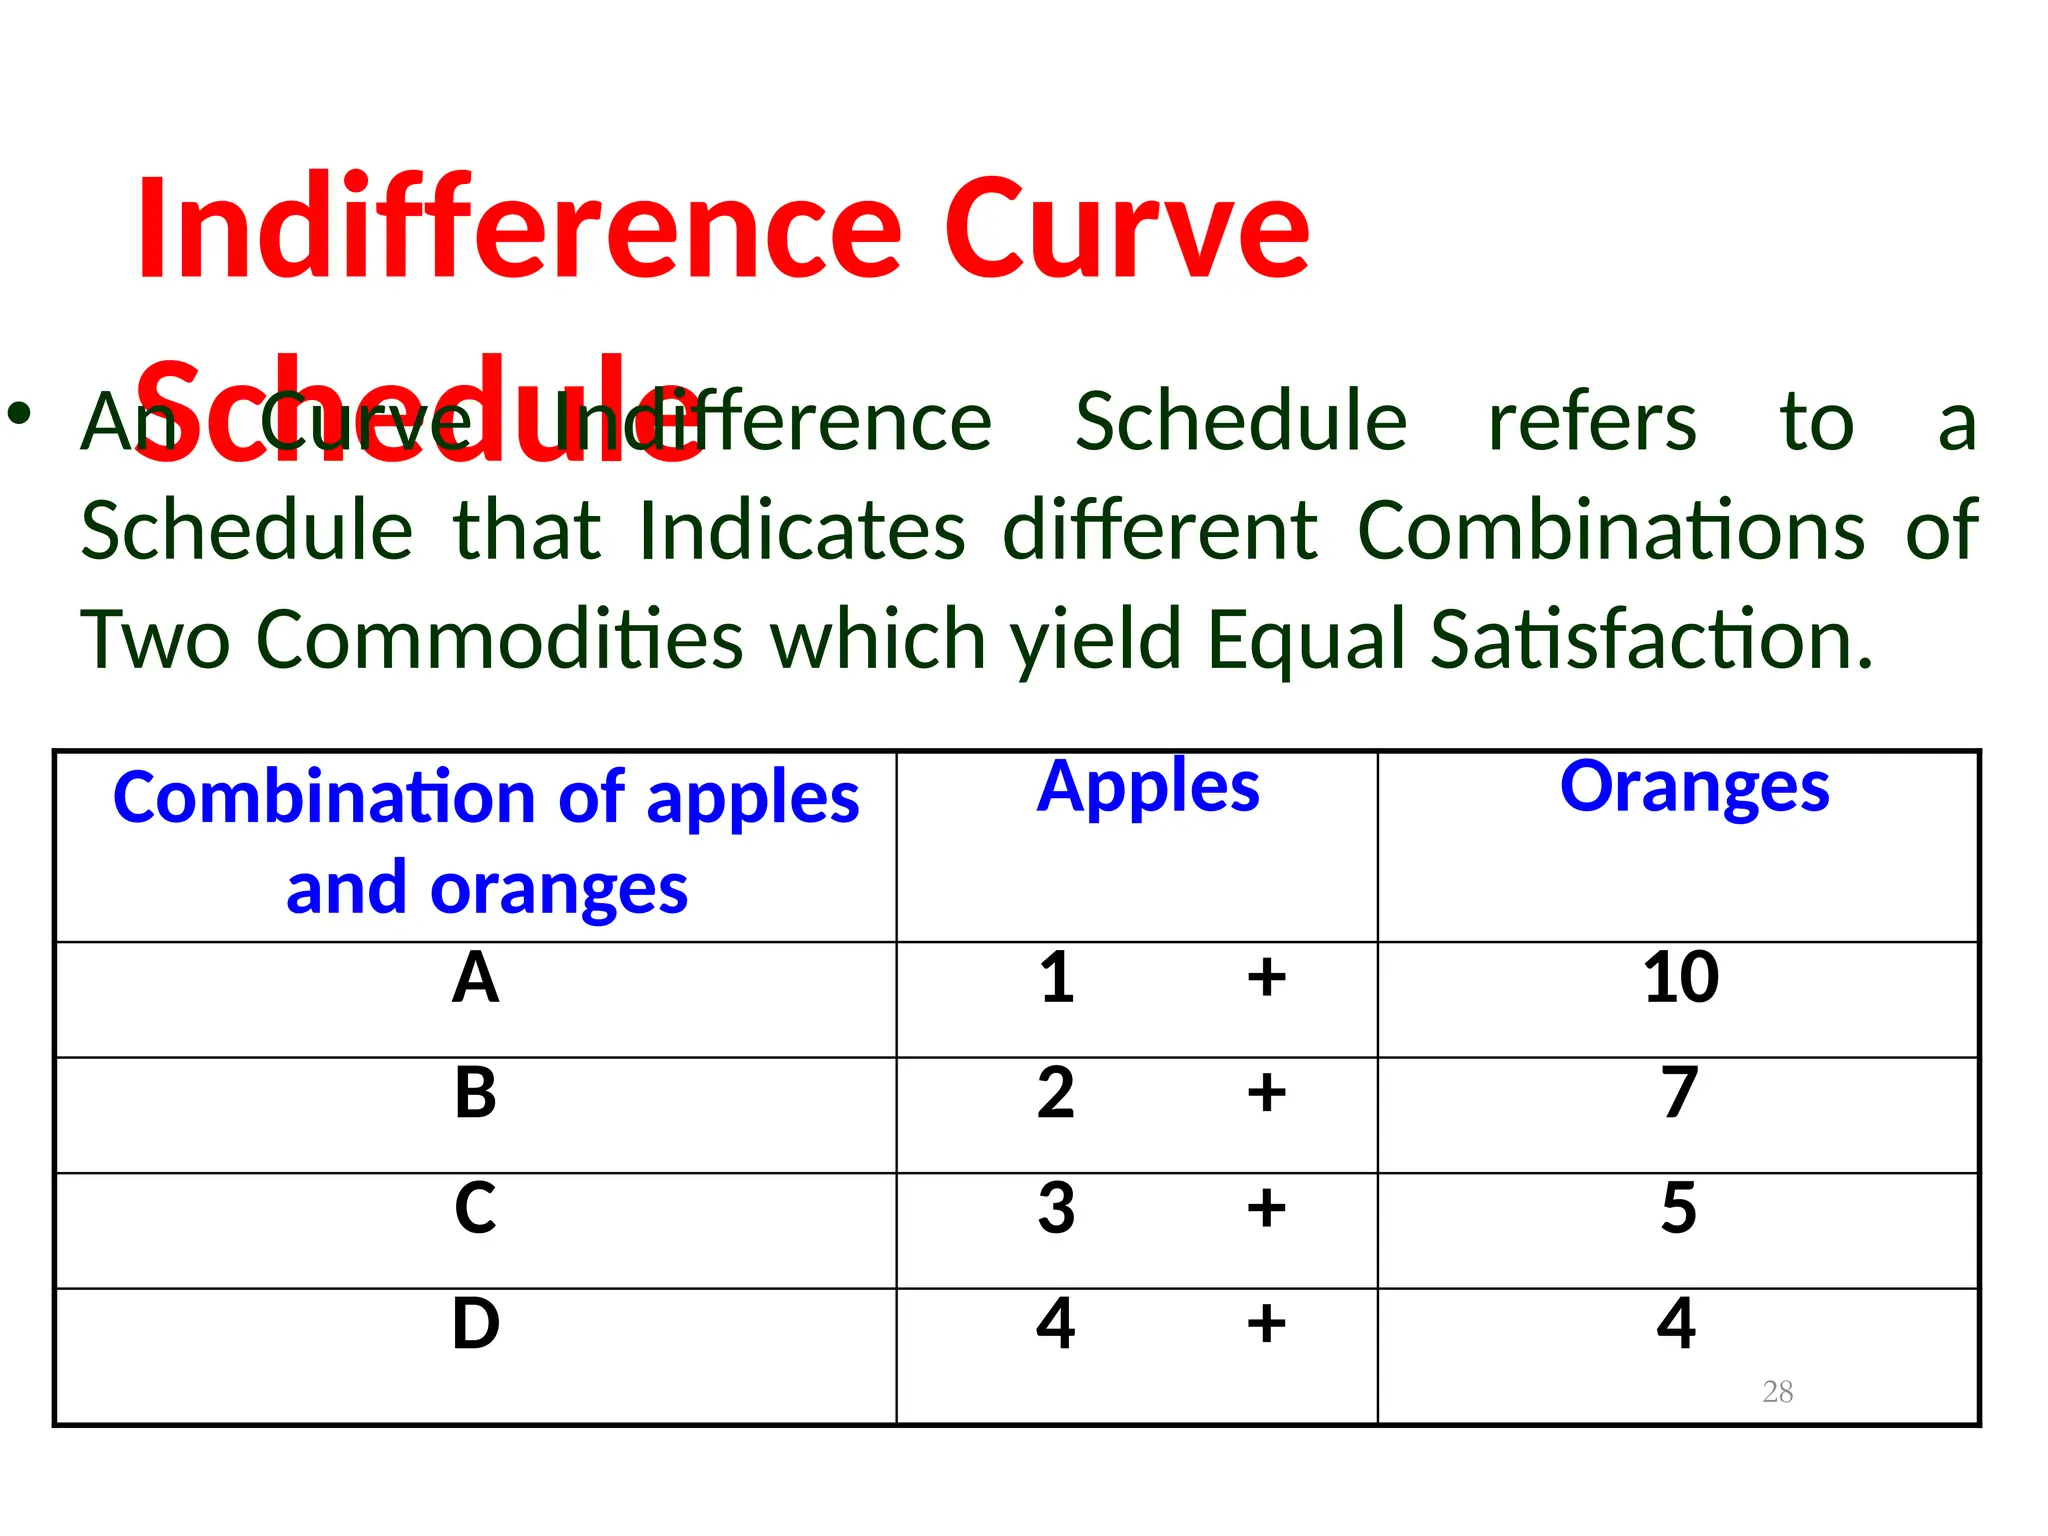
Indifference Curve
Schedule
• AnCurve Indifference Schedule refers to a
Schedule that Indicates different Combinations of
Two Commodities which yield Equal Satisfaction.
Combination of apples
and oranges
Apples Oranges
A 1 + 10
B 2 + 7
C 3 + 5
D 4 + 4
28
17.
29
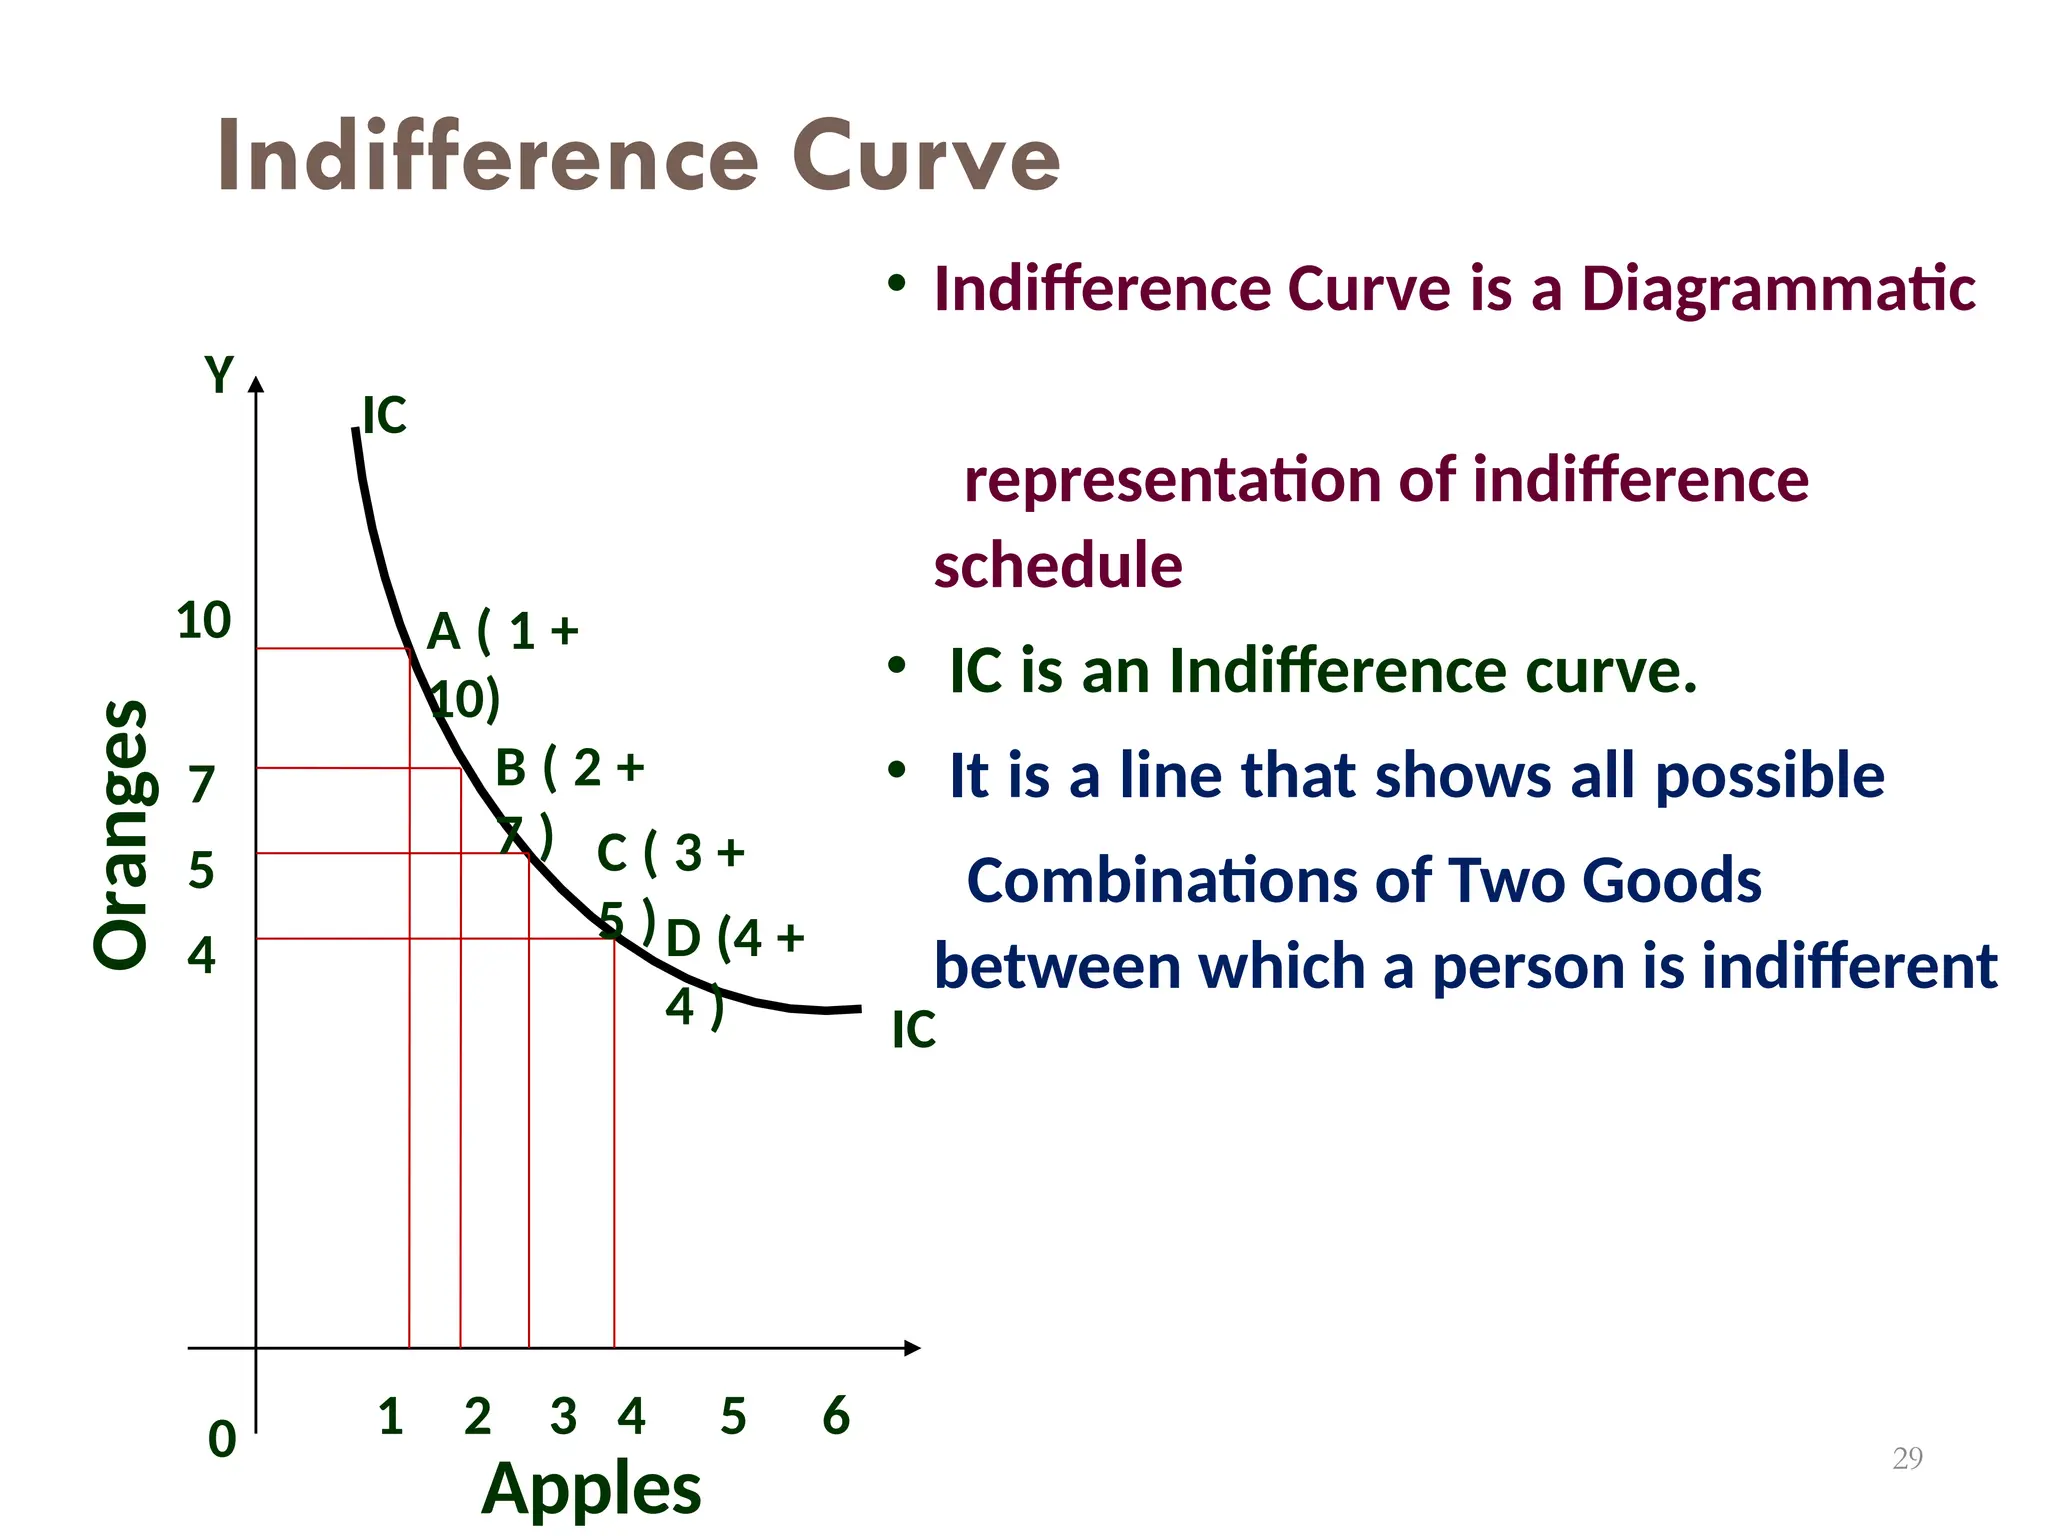
Indifference Curve
• IndifferenceCurve is a Diagrammatic
representation of indifference
schedule
• IC is an Indifference curve.
• It is a line that shows all possible
Combinations of Two Goods
between which a person is indifferent
Apples
1 2 3 4 5 6
IC
IC
A ( 1 +
10)
B ( 2 +
7 ) C ( 3 +
5 )D (4 +
4 )
Y
10
7
5
4
0
Oranges
18.
Satisfaction
30
Indifference Map
• AnIndifference
Map
represents a Group
of
Indifference Curves
which
each
of
expresses a given
level of Satisfaction.
• If an Indifference curve
Shifts
Level
to Right,
the of
Satisfaction
goes on Increasing.
• From the Point of View
of
IC >IC >IC
2 1
IC1
IC2
IC3
Good
Y
Good X
19.
31
Marginal Rate ofSubstitution
(MRS)
• The Rate at which an Individual must give up
“Good A” in order to obtain One More Unit of “Good
B”, while keeping their Overall Utility
(Satisfaction) Constant. The MRS is Calculated
between Two Goods placed on an Indifference
Curve, which displays a Frontier of Equal Utility for
Each Combination of “Good A” and “Good B”.
• MRS Keeps on Declining since Consumer has
more & more units of one Good, he gives up
Less Units of Other Good.
20.
Properties of IndifferenceCurve
20
• An Indifference Curve has a Negative Slope i.e.
it Slopes Downwards.
• Indifference Curves are always Convex to the
Origin.
• Two Indifference Curves never Intersect or
become Tangent to Each other.
• Higher Indifference Curve represents Higher
Satisfaction.
21.
Properties of IndifferenceCurve
21
• An Indifference Curve has a
Negative Slope i.e. it Slopes Downwards.
–
This
Property Implies that
when the Good in
Combination is
amount of one
Increased, the amount of the Other Good is
reduced. This is Essential if the Level of
Satisfaction is to remain the same on
an Indifference Curve.
22.
Properties of IndifferenceCurve
22
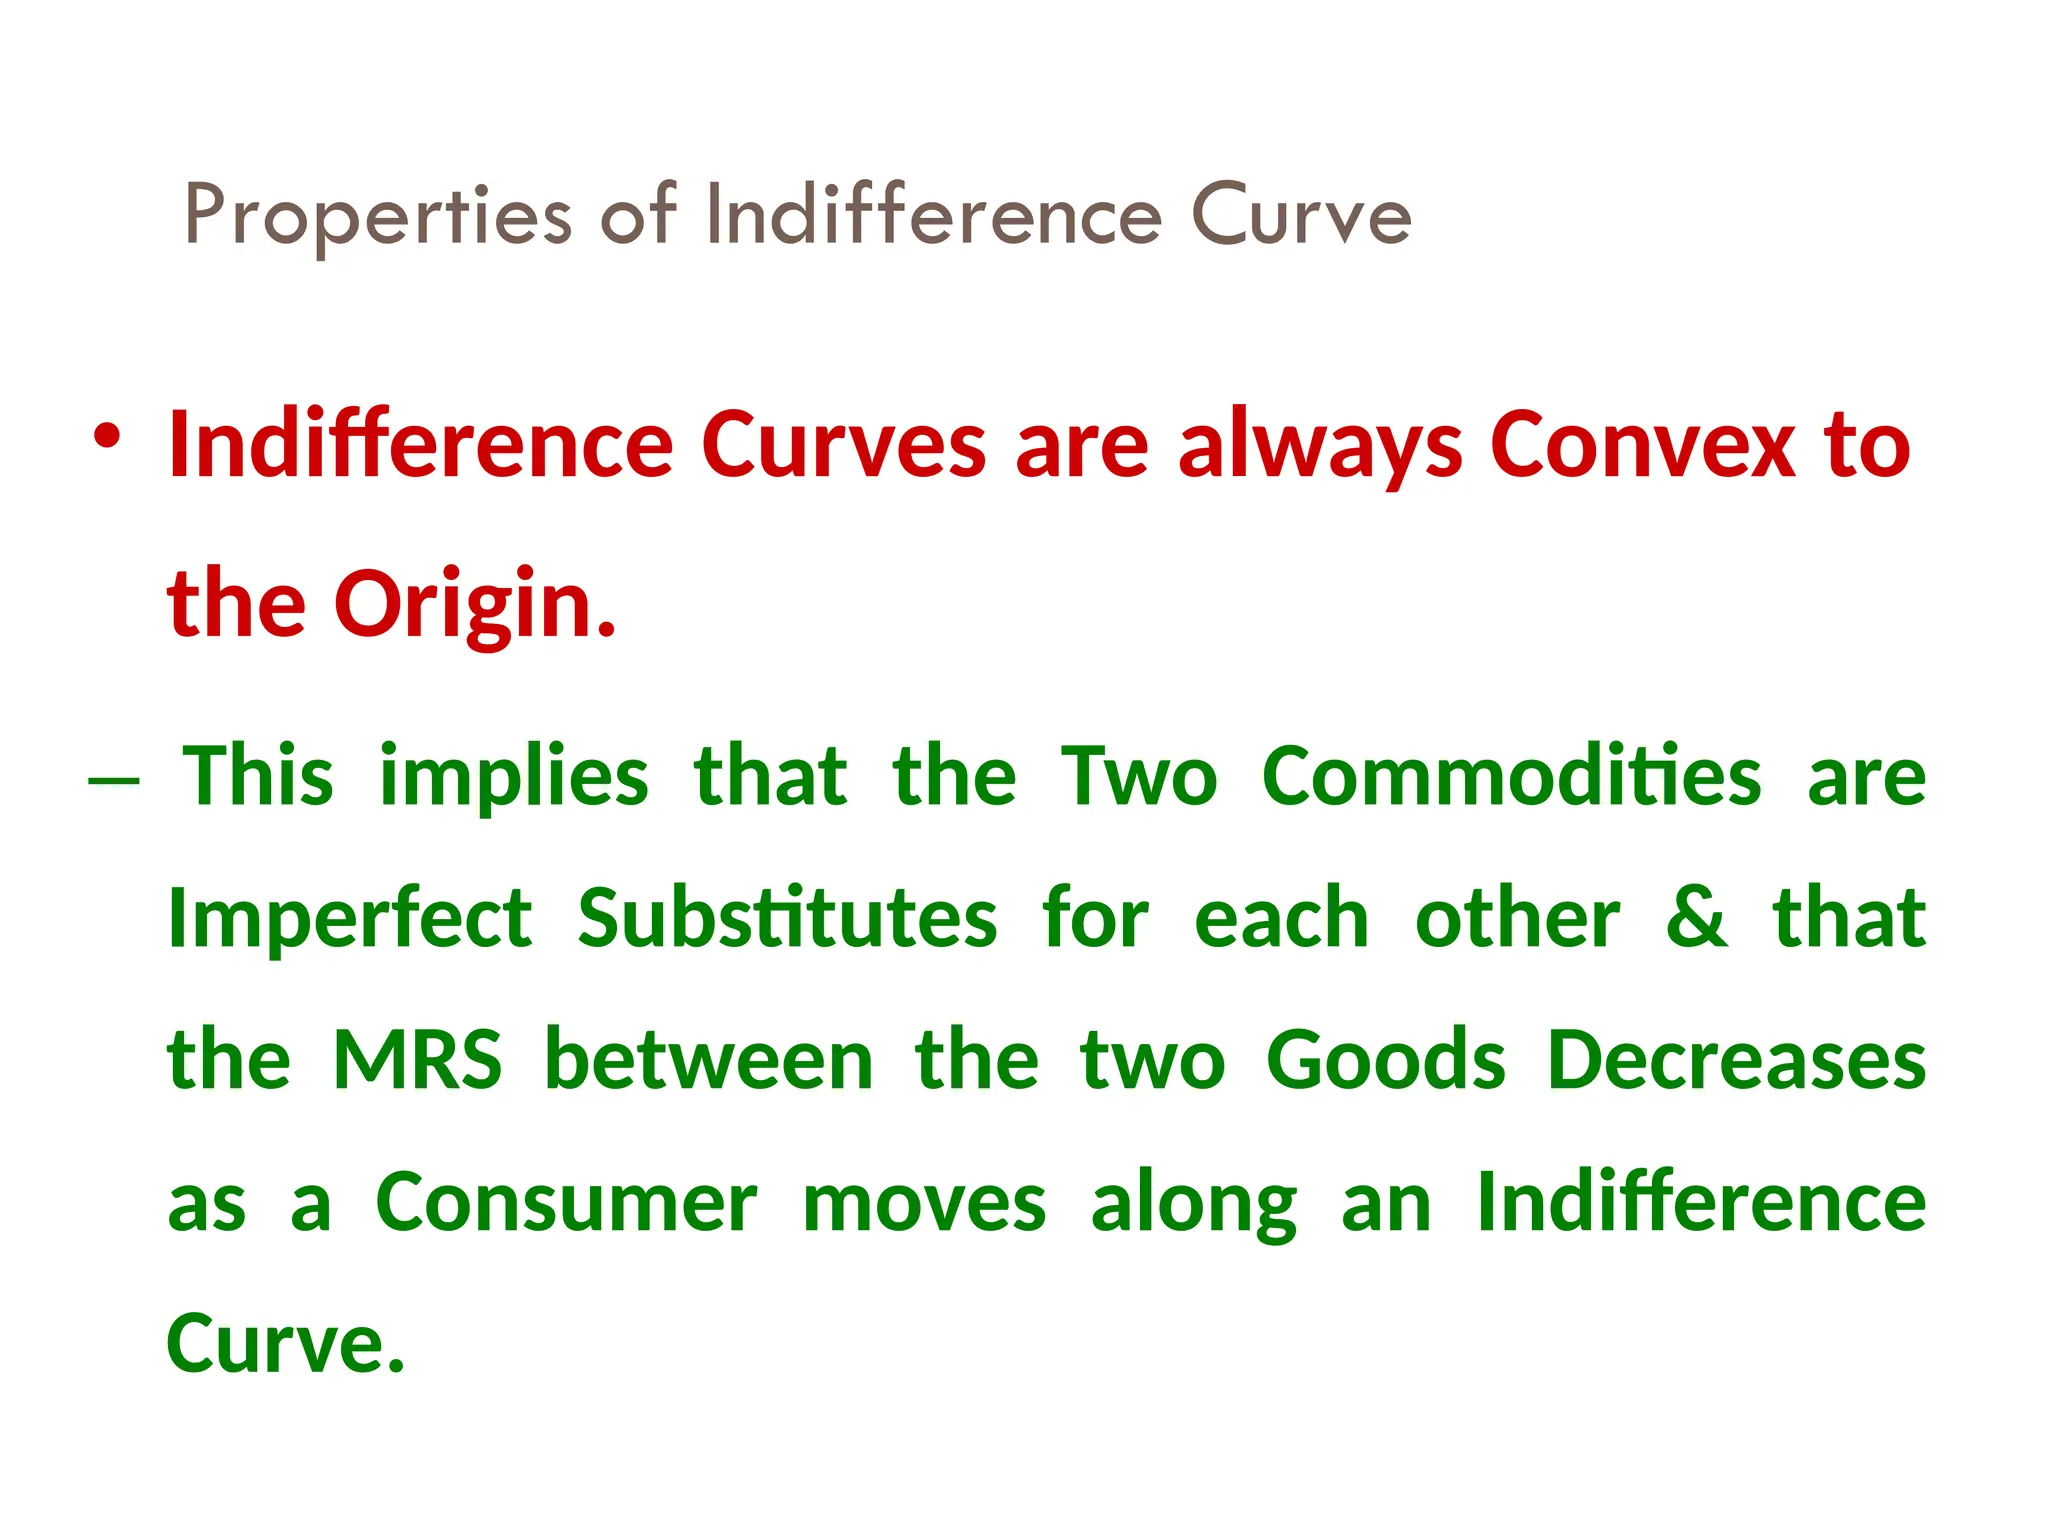
• Indifference Curves are always Convex to
the Origin.
– This implies that the Two Commodities are
Imperfect Substitutes for each other & that
the MRS between the two Goods Decreases
as a Consumer moves along an Indifference
Curve.
23.
35
Properties of IndifferenceCurve
• Indifference Curves are always Convex to
the Origin.
– Two Extreme conditions also exists.
• When 2 Goods are Perfect
Substitutes,
Indifference Curve will be a Straight Line on
which MRS is Constant.
• When 2 Goods are
Complementary,
Indifference Curve will consist of 2 Straight
Lines with a Right Angle bent which is convex
to the origin i.e. it will be L shaped.
24.
36
Properties of IndifferenceCurve
• Two Indifference Curves never
Intersect or become Tangent to Each
other.
– If Two Indifference Curves Intersect or are
Tangent, it would imply that an Indifference
Curve indicates Two different Levels of
Satisfaction (One Being Larger than the
Other) yield the Same Level of Satisfaction.
This will Violate the Rule of Transitivity.
25.
Properties of IndifferenceCurve
• Two Indifference Curves never
Intersect or become Tangent to Each
other. IC1
IC2
Good
Y
• A
Good 37
• C
• B
26.
Properties of IndifferenceCurve
26
• Higher Indifference Curve represents
Higher Satisfaction
–This is because the Combinations lying in
Higher Indifference Curve Contain
More of either one or Both Goods and
More Goods are preferred to Less of
them.
41
Consumer Equilibrium
• ConsumerEquilibrium will be reached
when he is deriving Maximum possible
Satisfaction from the Goods & is in no
Position to Rearrange his Purchase of Goods.
• The Indifference Map in Combination with the
Budget Line allows us to Determine the
One Combination of Goods and Services
that the Consumer most wants and is able to
Purchase. This is the Consumer Equilibrium.
29.
Consumer Equilibrium
• PL– Budget
Line
• Points R, S, Q, T,
H all lie on
Budget Line But Q
is Equilibrium
Point.
IC2
IC1
IC3
IC4
Good
Y
M
Good X
Y
P
N
O
R
Q
H
L
S
42
T
X


![[Solved] Top 7 Tips for Buying old Instagram Accounts ....pdf](https://cdn.slidesharecdn.com/ss_thumbnails/solvedtop7tipsforbuyingoldinstagramaccounts-251129184113-f00f62d1-thumbnail.jpg?width=640&height=640&fit=bounds)


