STACK OVERFLOW DATASET ANALYSIS
Download as PPTX, PDF12 likes6,586 views

The document describes a Big Data project analyzing the Stack Overflow dataset. Key points: - The dataset was obtained from Stack Exchange and consists of XML files totaling around 20GB that were parsed and loaded into HDFS. - The data was analyzed to identify trending questions, unanswered questions, closed questions, dead questions, top tags, and more. PageRank analysis was also performed to rank posts. - The results were visualized in a web application using technologies like Hive, HBase, Pig, and Mahout recommendation. Performance issues were encountered during the MapReduce parsing of the large XML files.


STACK OVERFLOW DATASET ANALYSIS
- 1. Big Data Project Presentation Team Members: Shrinivasaragav Balasubramanian, Shelley Bhatnagar STACK OVERFLOW DATASET ANALYSIS
- 2. The Dataset is obtained from Stack Exchange Data Dump at the Internet Archive. The link to the Dataset is as follows : https://archive.org/details/stackexchange Each site under Stack Exchange is formatted as a separate archive consisting of XML files zipped via 7-zip that includes various files. We chose the Stack Overflow Data Segment under the Stack Exchange Dump which originally is around ~ 20 GB and we brought it to 3 GB for performing analysis. Dataset Overview:
- 3. Stack Overflow Dataset consists of following files that are treated as tables in our Database Design: Posts PostLinks Tags Users Votes Batches Comments Dataset Overview:
- 5. Since our dataset is in xml format, we designed parsers for each file i.e table, to process the data easily and dump the data into HDFS. The parsers were designed into a Java Application, implementing Mapper and Reducer while configuring a job in Hadoop to parse the data. The Jar is run in Hadoop Distributed Mode and the parsed data is dumped into HDFS. Each file in dataset consists of 12 million + entries. Each table had 6-7 attributes in average while also consisting of missing attributes, empty fields and hence inconsistent data entries which the parser took care of. Mission:
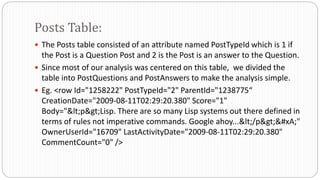
- 6. The Posts table consisted of an attribute named PostTypeId which is 1 if the Post is a Question Post and 2 is the Post is an answer to the Question. Since most of our analysis was centered on this table, we divided the table into PostQuestions and PostAnswers to make the analysis simple. Eg. <row Id="1258222" PostTypeId="2" ParentId="1238775“ CreationDate="2009-08-11T02:29:20.380" Score="1" Body="<p>Lisp. There are so many Lisp systems out there defined in terms of rules not imperative commands. Google ahoy...</p>
" OwnerUserId="16709" LastActivityDate="2009-08-11T02:29:20.380" CommentCount="0" /> Posts Table:
- 7. The trending Questions that are viewed and scored highly by users. The Questions that doesn’t have any answers. The Questions that have been marked closed for each category. The Questions that are dead and have no activity past 2 years. The most viewed questions in each category. The most scored questions in each category The count of posted questions of each category over a timeframe (say 2 years). The list of tags other than standard tags. The top posted Questions in each category. Analysis using Posts
- 8. The RANK of the Post in the dataset. Approximate time for a User Post in a category to expect a correct answer or a working solution. Analysis on Posts (cont)
- 9. The User profile with maximum views. The top users with maximum reputation points. Most valuable users in the dataset. The numbers of users that have been awarded batches. The count of users creating account in a given timeframe (say 6 months). Recommending users to contribute an answer for a similarly liked category. The inactive accounts over a range of time. Total Number of dead accounts. The Number of users bearing various batches Analysis on Users:
- 10. The comments that have a count greater than average count. The users posting maximum number of comments. The Question Post that have highest number of comments. Analysis on Comments
- 11. The number of spam comments in the dataset. The Users that contribute to the spam posts. The Posts that are scheduled to be deleted from the data dump over a period of say (6 months). The top users carrying votes titled as favorite. Analysis on Votes
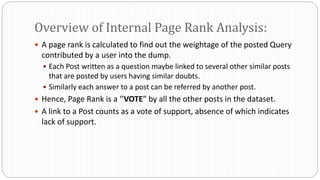
- 12. A page rank is calculated to find out the weightage of the posted Query contributed by a user into the dump. Each Post written as a question maybe linked to several other similar posts that are posted by users having similar doubts. Similarly each answer to a post can be referred by another post. Hence, Page Rank is a ‘’VOTE” by all the other posts in the dataset. A link to a Post counts as a vote of support, absence of which indicates lack of support. Overview of Internal Page Rank Analysis:
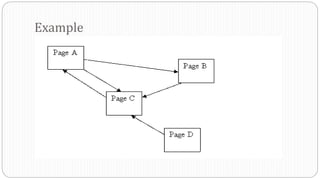
- 13. Thus if we have a Post with PostId = A, which have Posts T1…..Tn pointing to it, we take a dumping factor between 0 – 1 and we have define C(A) to be as the number of links associated with the Post, the Page Rank of a Post is given as follows: PR(A) = (1-d) + d (PR(T1)/C(T1) + ... + PR(Tn)/C(Tn)) Page Rank Formula:
- 14. The Page Rank of each Post depends on the post linked to it. It is calculates without knowing the final value of Page Rank. Thus we run the calculation repeatedly which takes us closer to the estimated final value. How is Page Rank Calculated?
- 15. The “damping factor” is quite subtle. If it’s too high then it takes ages for the numbers to settle, if it’s too low then you get repeated over-shoot We performed analysis for achieving the optimal damping factor. The Damping factor chosen for this Dataset is 0.25. No matter from where we start the guess, once settled, the average Page Rank of all pages will be 1.0 Choosing the Dumping Factor:
- 16. Example
- 17. Web Application: Internal Page Rank Analysis
- 18. The analysis predicts and provides an estimates time in which a user can expect an activity on the Post. Analysis involved categorizing the dataset according to the tags. For each posted question the fastest reply was taken into consideration and the time difference between posting a question and getting the first reply was calculated. This difference was averaged for all the posts belonging to a category, thereby predicting the activity on a post. Predicting First Activity Time On A Post
- 19. In the application, a user can provide the tags he/she would be using for their posts. Based on the tags provided, the application will calculate the average time taken for an activity on each tag and then average the two results. How This Works In The Application
- 20. Creating a graph structure based on Posts and Related Posts. Graph will comprise of Nodes and Edges. Each Node will have several Edges and each Edges will be a Node again will several Edges. Created a Pig UDF where all the Posts and Related Posts are sent as a Group. Based on the input a graph gets created. Rank is calculated based on how many incoming links each Node has. The more the number of incoming links, the higher the Page Rank. How We Did It
- 21. Integrated Hive with the existing Hbase table. We need to provide the hbase.columns.mapping whereas hbase.table.name is optional to provide. We use HbaseStorage Handler to allow Hive to interact with Hbase. Hive Hbase Integration
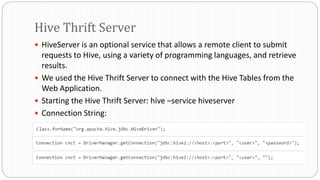
- 22. HiveServer is an optional service that allows a remote client to submit requests to Hive, using a variety of programming languages, and retrieve results. We used the Hive Thrift Server to connect with the Hive Tables from the Web Application. Starting the Hive Thrift Server: hive –service hiveserver Connection String: Hive Thrift Server
- 23. Providing Suggestions to users regarding the various questions they can answer from other categories. We have taken the User ID, Category ID and the Interaction level as the input to Mahout User Recommender. Mahout User Based Recommender
- 24. We used pig queries to join the various tables and get an output which contained User ID, Category ID and Interaction level. We used this output as an input to the Mahout User Based Recommender. We converted the Interaction Level values to be in the range of 0 to 5. We used the PearsonCorrelationSimilarity and the NearestNNeighbours as the neighborhood. We then used the UserBased Recommender to provide 3 suggestions of other Categories for which the user can provide his contribution by answering the questions. How Did We Implement It
- 25. Web Application: Mahout Recommender
- 26. We were able to incorporate our analysis in a Web Appplication. The Web Application retrieves the required data using Hbase and Hive technologies. Below attached are screenshots of the application and the analysis that has been performed. We have used Google Charts for displaying our analysis in a graph. Web Application
- 27. Questions Posted By User: Used HBase
- 28. Tag Count Analysis: Most Used Tags
- 31. Comments To Answers Analysis
- 35. Answered Vs Unanswered Questions
- 36. Finding Average Answer Time
- 37. Internal Page Rank Analysis
- 39. Performance depends upon input sizes and MR FS chunk size. While there were queries that required sorting of data, many temp files were created and written onto the disc. The performance of MR is evaluated by reviewing the counters for map task. In the Parser Implemented to read the xml file, there were significant problems faced. The number of spilled records were significantly more than the map task read that resulted in NullPointerException with the message: INFO mapreduce.Job: Job job_local1747290386_0001 failed with state FAILED due to: NA Problem Faced: