SlideShare a Scribd company logo
5
Most read
6
Most read
12
Most read
JC BOSE UNIVERSITY OF SCIENCE AND TECHNOLOGY,
YMCA, FARIDABAD
(MASTERS OF BUSINESS ADMINISTRATION)
2022-2024
RESEARCH LAB
PROJECT FILE
SUBMITTED BY: GOLDY SINGH
ROLL NUMBER: 22001701037
Course: MBA (2022-2024)
UNDER THE SUPERVISION OF
Miss Komal (Scholar)
Department of Management Studies
CERTIFICATE
This is to certify that the project entitled, “(RESEARCH LAB)” has
been carried out by GOLDY SINGH of MBA bearing Roll No.
22001701037 during the academic year 2022-2024. I have immense
pleasure in forwarding the project to the Department of management,
JC Bose University of Science and Technology. It is further certified
that the research work included in the project is carried out by the
candidate during her practical.
Miss Komal (SCHOLAR)
Department of MANAGEMENT
JC Bose university of science and technology,
Faridabad, Haryana
ACKNOWLEDGEMENT
The success and the final outcome of this Research Lab
Practical File require a lot of guidance and assistance from
many people and we extremely fortunate to have got this all
along the completionof our assistance work. Whether we have
done only to such guidance and assistance and we could not
forget to thank them. I respect and thanks our faculty guide
Ms. KOMAL for giving us an opportunity to do this project
work and providing us all support and guidance which made
me complete the projecton time, we are extremely grateful to
her for providing such a nice support and guidance.
INDEX
1 STEP WISE REGRESSION
Introduction
Assumption
Steps in process
Interpretation and results
2 Difference between multiple regression and
stepwise regression.
3 CLUSTER ANALYSIS
Introduction
Assumption
Steps in process
Interpretation and results
What Is Stepwise Regression?
Stepwise regression is the step-by-step iterative construction of
a regression model that involves the selection of independent variables to
be used in a final model. It involves adding or removing potential
explanatory variables in succession and testing for statistical significance
after each iteration.
The availability of statistical software packages makes stepwise regression
possible, even in models with hundreds of variables.
Assumptions
Let’s look at the important assumptions in regression analysis:
1. There should be a linear and additive relationship between
dependent (response) variable and independent (predictor)
variable(s). A linear relationship suggests that a change in response
Y due to one unit change in X¹ is constant, regardless of the value of
X¹. An additive relationship suggests that the effect of X¹ on Y is
independent of other variables.
2. There should be no correlation between the residual (error) terms.
Absence of this phenomenon is known as Autocorrelation.
3. The independent variables should not be correlated. Absence of
this phenomenon is known as multicollinearity.
4. The error terms must have constant variance. This phenomenon is
known as homoskedasticity. The presence of non-constant variance
is referred to heteroskedasticity.
5. The error terms must be normally distributed.
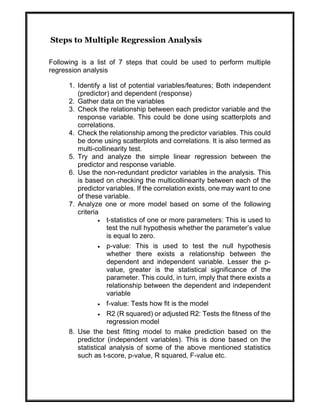
Steps to Multiple Regression Analysis
Following is a list of 7 steps that could be used to perform multiple
regression analysis
1. Identify a list of potential variables/features; Both independent
(predictor) and dependent (response)
2. Gather data on the variables
3. Check the relationship between each predictor variable and the
response variable. This could be done using scatterplots and
correlations.
4. Check the relationship among the predictor variables. This could
be done using scatterplots and correlations. It is also termed as
multi-collinearity test.
5. Try and analyze the simple linear regression between the
predictor and response variable.
6. Use the non-redundant predictor variables in the analysis. This
is based on checking the multicollinearity between each of the
predictor variables. If the correlation exists, one may want to one
of these variable.
7. Analyze one or more model based on some of the following
criteria
 t-statistics of one or more parameters: This is used to
test the null hypothesis whether the parameter’s value
is equal to zero.
 p-value: This is used to test the null hypothesis
whether there exists a relationship between the
dependent and independent variable. Lesser the p-
value, greater is the statistical significance of the
parameter. This could, in turn, imply that there exists a
relationship between the dependent and independent
variable
 f-value: Tests how fit is the model
 R2 (R squared) or adjusted R2: Tests the fitness of the
regression model
8. Use the best fitting model to make prediction based on the
predictor (independent variables). This is done based on the
statistical analysis of some of the above mentioned statistics
such as t-score, p-value, R squared, F-value etc.
Steps involved in multiple regression
1.Click Analyze > Regression > Linear... on the main menu, as
shown below
2.You will be presented with the Linear Regression dialogue box
below:
3. Transfer the dependent variable, VO2max , into the Dependent: box
and the independent
variables, age , weight , heart_rate and gender into the Independent(s): box,
using the buttons, as shown below (all other boxes can be
ignored):
4. Click on the button. You will be presented with the Linear
Regression: Statistics dialogue box, as shown below:
5. In addition to the options that are selected by default, select Confidence
intervals in the –Regression Coefficients– area leaving
the Level(%): option at "95". You will end up with the following screen:
6.Click on the button. You will be returned to the Linear
Regression dialogue box.
7.Click on the button. This will generate the output.
Stepwise, Multiple and Cluster regression.pdf
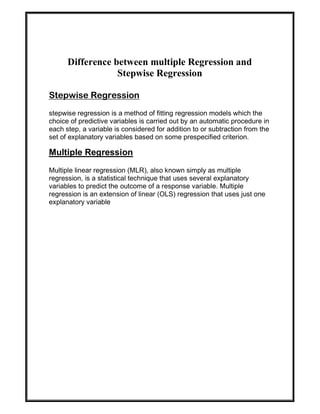
Difference between multiple Regression and
Stepwise Regression
Stepwise Regression
stepwise regression is a method of fitting regression models which the
choice of predictive variables is carried out by an automatic procedure in
each step, a variable is considered for addition to or subtraction from the
set of explanatory variables based on some prespecified criterion.
Multiple Regression
Multiple linear regression (MLR), also known simply as multiple
regression, is a statistical technique that uses several explanatory
variables to predict the outcome of a response variable. Multiple
regression is an extension of linear (OLS) regression that uses just one
explanatory variable
CLUSTER ANALYSIS
Cluster analysis or clustering is the task of grouping a set of
objects in such a way that objects in the same group (called a
cluster) are more similar (in some sense) to each other than to
those in other groups (clusters). It is a main task of exploratory
data analysis and a common technique for statistical data
analysis, used in many fields, including pattern recognition,
image analysis information retrieval, bioinformatics, data
compression, computer graphics and machine learning.
Stepwise, Multiple and Cluster regression.pdf

More Related Content

Similar to Stepwise, Multiple and Cluster regression.pdf (20)

PPTX
Recep maz msb 701 quantitative analysis for managers
recepmaz
 
PDF
Use of Linear Regression in Machine Learning for Ranking
ijsrd.com
 
PPTX
Linear regression aims to find the "best-fit" linear line
rnycsepp
 
PPTX
pembuastasn multiVARIASTE YASNG ASKASN DIPSAKASI UNTUK PENELITIAN COBA CEK
ssuser4187dc1
 
PDF
Moderation and Meditation conducting in SPSS
Osama Yousaf
 
PDF
Factors affecting customer satisfaction
Saleesh Satheeshchandran
 
PDF
Managing for Quality and Performance Excellence 10th Edition Evans Solutions ...
gedangdemecs
 
PDF
7. logistics regression using spss
Dr Nisha Arora
 
DOCX
A researcher in attempting to run a regression model noticed a neg.docx
evonnehoggarth79783
 
PPTX
Demand estimation and forecasting
shivraj negi
 
PPT
Market Research using SPSS _ Edu4Sure Sept 2023.ppt
Edu4Sure
 
PDF
Multivariate data analysis regression, cluster and factor analysis on spss
Aditya Banerjee
 
DOCX
NPTEL Machine Learning Week 2.docx
Madhur Jatiya
 
PPTX
Econometrics chapter 8
Sehrish Chaudary
 
PDF
Unit---5.pdf of ba in srcc du gst before exam
FireBolt6
 
PPTX
binary logistic assessment methods and strategies
mikaelgirum
 
PPTX
ai.pptx
Sameenafathima4
 
PPT
Chapter 4 - multiple regression
Tauseef khan
 
PPT
My regression lecture mk3 (uploaded to web ct)
chrisstiff
 
PPT
Recommender system
Bhumi Patel
 
Recep maz msb 701 quantitative analysis for managers
recepmaz
 
Use of Linear Regression in Machine Learning for Ranking
ijsrd.com
 
Linear regression aims to find the "best-fit" linear line
rnycsepp
 
pembuastasn multiVARIASTE YASNG ASKASN DIPSAKASI UNTUK PENELITIAN COBA CEK
ssuser4187dc1
 
Moderation and Meditation conducting in SPSS
Osama Yousaf
 
Factors affecting customer satisfaction
Saleesh Satheeshchandran
 
Managing for Quality and Performance Excellence 10th Edition Evans Solutions ...
gedangdemecs
 
7. logistics regression using spss
Dr Nisha Arora
 
A researcher in attempting to run a regression model noticed a neg.docx
evonnehoggarth79783
 
Demand estimation and forecasting
shivraj negi
 
Market Research using SPSS _ Edu4Sure Sept 2023.ppt
Edu4Sure
 
Multivariate data analysis regression, cluster and factor analysis on spss
Aditya Banerjee
 
NPTEL Machine Learning Week 2.docx
Madhur Jatiya
 
Econometrics chapter 8
Sehrish Chaudary
 
Unit---5.pdf of ba in srcc du gst before exam
FireBolt6
 
binary logistic assessment methods and strategies
mikaelgirum
 
Chapter 4 - multiple regression
Tauseef khan
 
My regression lecture mk3 (uploaded to web ct)
chrisstiff
 
Recommender system
Bhumi Patel
 

More from GOLDY SINGH (11)

DOCX
THE IMPACT OF FINANCIAL STRESS ON EMPLOYEE JOB SATISFACTION.docx
GOLDY SINGH
 
PPTX
Understanding the Foreign Exchange Market
GOLDY SINGH
 
DOCX
GST RETURN and Tally Internship report.docx
GOLDY SINGH
 
PPTX
Case_Study.pptx
GOLDY SINGH
 
PPTX
consumer Behaviour Towards Maggie
GOLDY SINGH
 
PPTX
4P'S OF MARKETING.pptx
GOLDY SINGH
 
PPTX
EV charging station with a cafe.pptx
GOLDY SINGH
 
PPTX
CAA AND NRC.pptx
GOLDY SINGH
 
PPTX
RTI ACT,2005.pptx
GOLDY SINGH
 
PPTX
DEMAND ESTIMATION AND FORCASTING.pptx
GOLDY SINGH
 
PPTX
RATIO ANALYSIS.pptx
GOLDY SINGH
 
THE IMPACT OF FINANCIAL STRESS ON EMPLOYEE JOB SATISFACTION.docx
GOLDY SINGH
 
Understanding the Foreign Exchange Market
GOLDY SINGH
 
GST RETURN and Tally Internship report.docx
GOLDY SINGH
 
Case_Study.pptx
GOLDY SINGH
 
consumer Behaviour Towards Maggie
GOLDY SINGH
 
4P'S OF MARKETING.pptx
GOLDY SINGH
 
EV charging station with a cafe.pptx
GOLDY SINGH
 
CAA AND NRC.pptx
GOLDY SINGH
 
RTI ACT,2005.pptx
GOLDY SINGH
 
DEMAND ESTIMATION AND FORCASTING.pptx
GOLDY SINGH
 
RATIO ANALYSIS.pptx
GOLDY SINGH
 
Ad

Recently uploaded (20)

PPTX
How to Manage Promotions in Odoo 18 Sales
Celine George
 
PPTX
Views on Education of Indian Thinkers Mahatma Gandhi.pptx
ShrutiMahanta1
 
PPTX
How to Create Rental Orders in Odoo 18 Rental
Celine George
 
PPTX
HYDROCEPHALUS: NURSING MANAGEMENT .pptx
PRADEEP ABOTHU
 
PPTX
LEGAL ASPECTS OF PSYCHIATRUC NURSING.pptx
PoojaSen20
 
PDF
Zoology (Animal Physiology) practical Manual
raviralanaresh2
 
PPT
digestive system for Pharm d I year HAP
rekhapositivity
 
PPTX
PPT on the Development of Education in the Victorian England
Beena E S
 
PPTX
How to Manage Access Rights & User Types in Odoo 18
Celine George
 
PDF
BÀI TẬP BỔ TRỢ THEO LESSON TIẾNG ANH - I-LEARN SMART WORLD 7 - CẢ NĂM - CÓ ĐÁ...
Nguyen Thanh Tu Collection
 
PPTX
Growth and development and milestones, factors
BHUVANESHWARI BADIGER
 
PPTX
Accounting Skills Paper-I, Preparation of Vouchers
Dr. Sushil Bansode
 
PPTX
Gall bladder, Small intestine and Large intestine.pptx
rekhapositivity
 
PDF
ARAL_Orientation_Day-2-Sessions_ARAL-Readung ARAL-Mathematics ARAL-Sciencev2.pdf
JoelVilloso1
 
PPTX
Views on Education of Indian Thinkers J.Krishnamurthy..pptx
ShrutiMahanta1
 
PPTX
Nutri-QUIZ-Bee-Elementary.pptx...................
ferdinandsanbuenaven
 
PPTX
2025 Winter SWAYAM NPTEL & A Student.pptx
Utsav Yagnik
 
PDF
CEREBRAL PALSY: NURSING MANAGEMENT .pdf
PRADEEP ABOTHU
 
PPTX
ASRB NET 2023 PREVIOUS YEAR QUESTION PAPER GENETICS AND PLANT BREEDING BY SAT...
Krashi Coaching
 
PPTX
How to Configure Storno Accounting in Odoo 18 Accounting
Celine George
 
How to Manage Promotions in Odoo 18 Sales
Celine George
 
Views on Education of Indian Thinkers Mahatma Gandhi.pptx
ShrutiMahanta1
 
How to Create Rental Orders in Odoo 18 Rental
Celine George
 
HYDROCEPHALUS: NURSING MANAGEMENT .pptx
PRADEEP ABOTHU
 
LEGAL ASPECTS OF PSYCHIATRUC NURSING.pptx
PoojaSen20
 
Zoology (Animal Physiology) practical Manual
raviralanaresh2
 
digestive system for Pharm d I year HAP
rekhapositivity
 
PPT on the Development of Education in the Victorian England
Beena E S
 
How to Manage Access Rights & User Types in Odoo 18
Celine George
 
BÀI TẬP BỔ TRỢ THEO LESSON TIẾNG ANH - I-LEARN SMART WORLD 7 - CẢ NĂM - CÓ ĐÁ...
Nguyen Thanh Tu Collection
 
Growth and development and milestones, factors
BHUVANESHWARI BADIGER
 
Accounting Skills Paper-I, Preparation of Vouchers
Dr. Sushil Bansode
 
Gall bladder, Small intestine and Large intestine.pptx
rekhapositivity
 
ARAL_Orientation_Day-2-Sessions_ARAL-Readung ARAL-Mathematics ARAL-Sciencev2.pdf
JoelVilloso1
 
Views on Education of Indian Thinkers J.Krishnamurthy..pptx
ShrutiMahanta1
 
Nutri-QUIZ-Bee-Elementary.pptx...................
ferdinandsanbuenaven
 
2025 Winter SWAYAM NPTEL & A Student.pptx
Utsav Yagnik
 
CEREBRAL PALSY: NURSING MANAGEMENT .pdf
PRADEEP ABOTHU
 
ASRB NET 2023 PREVIOUS YEAR QUESTION PAPER GENETICS AND PLANT BREEDING BY SAT...
Krashi Coaching
 
How to Configure Storno Accounting in Odoo 18 Accounting
Celine George
 
Ad

Stepwise, Multiple and Cluster regression.pdf

  • 1. JC BOSE UNIVERSITY OF SCIENCE AND TECHNOLOGY, YMCA, FARIDABAD (MASTERS OF BUSINESS ADMINISTRATION) 2022-2024 RESEARCH LAB PROJECT FILE SUBMITTED BY: GOLDY SINGH ROLL NUMBER: 22001701037 Course: MBA (2022-2024) UNDER THE SUPERVISION OF Miss Komal (Scholar) Department of Management Studies
  • 2. CERTIFICATE This is to certify that the project entitled, “(RESEARCH LAB)” has been carried out by GOLDY SINGH of MBA bearing Roll No. 22001701037 during the academic year 2022-2024. I have immense pleasure in forwarding the project to the Department of management, JC Bose University of Science and Technology. It is further certified that the research work included in the project is carried out by the candidate during her practical. Miss Komal (SCHOLAR) Department of MANAGEMENT JC Bose university of science and technology, Faridabad, Haryana
  • 3. ACKNOWLEDGEMENT The success and the final outcome of this Research Lab Practical File require a lot of guidance and assistance from many people and we extremely fortunate to have got this all along the completionof our assistance work. Whether we have done only to such guidance and assistance and we could not forget to thank them. I respect and thanks our faculty guide Ms. KOMAL for giving us an opportunity to do this project work and providing us all support and guidance which made me complete the projecton time, we are extremely grateful to her for providing such a nice support and guidance.
  • 4. INDEX 1 STEP WISE REGRESSION Introduction Assumption Steps in process Interpretation and results 2 Difference between multiple regression and stepwise regression. 3 CLUSTER ANALYSIS Introduction Assumption Steps in process Interpretation and results
  • 5. What Is Stepwise Regression? Stepwise regression is the step-by-step iterative construction of a regression model that involves the selection of independent variables to be used in a final model. It involves adding or removing potential explanatory variables in succession and testing for statistical significance after each iteration. The availability of statistical software packages makes stepwise regression possible, even in models with hundreds of variables. Assumptions Let’s look at the important assumptions in regression analysis: 1. There should be a linear and additive relationship between dependent (response) variable and independent (predictor) variable(s). A linear relationship suggests that a change in response Y due to one unit change in X¹ is constant, regardless of the value of X¹. An additive relationship suggests that the effect of X¹ on Y is independent of other variables. 2. There should be no correlation between the residual (error) terms. Absence of this phenomenon is known as Autocorrelation. 3. The independent variables should not be correlated. Absence of this phenomenon is known as multicollinearity. 4. The error terms must have constant variance. This phenomenon is known as homoskedasticity. The presence of non-constant variance is referred to heteroskedasticity. 5. The error terms must be normally distributed.
  • 6. Steps to Multiple Regression Analysis Following is a list of 7 steps that could be used to perform multiple regression analysis 1. Identify a list of potential variables/features; Both independent (predictor) and dependent (response) 2. Gather data on the variables 3. Check the relationship between each predictor variable and the response variable. This could be done using scatterplots and correlations. 4. Check the relationship among the predictor variables. This could be done using scatterplots and correlations. It is also termed as multi-collinearity test. 5. Try and analyze the simple linear regression between the predictor and response variable. 6. Use the non-redundant predictor variables in the analysis. This is based on checking the multicollinearity between each of the predictor variables. If the correlation exists, one may want to one of these variable. 7. Analyze one or more model based on some of the following criteria  t-statistics of one or more parameters: This is used to test the null hypothesis whether the parameter’s value is equal to zero.  p-value: This is used to test the null hypothesis whether there exists a relationship between the dependent and independent variable. Lesser the p- value, greater is the statistical significance of the parameter. This could, in turn, imply that there exists a relationship between the dependent and independent variable  f-value: Tests how fit is the model  R2 (R squared) or adjusted R2: Tests the fitness of the regression model 8. Use the best fitting model to make prediction based on the predictor (independent variables). This is done based on the statistical analysis of some of the above mentioned statistics such as t-score, p-value, R squared, F-value etc.
  • 7. Steps involved in multiple regression 1.Click Analyze > Regression > Linear... on the main menu, as shown below 2.You will be presented with the Linear Regression dialogue box below:
  • 8. 3. Transfer the dependent variable, VO2max , into the Dependent: box and the independent variables, age , weight , heart_rate and gender into the Independent(s): box, using the buttons, as shown below (all other boxes can be ignored): 4. Click on the button. You will be presented with the Linear Regression: Statistics dialogue box, as shown below:
  • 9. 5. In addition to the options that are selected by default, select Confidence intervals in the –Regression Coefficients– area leaving the Level(%): option at "95". You will end up with the following screen: 6.Click on the button. You will be returned to the Linear Regression dialogue box. 7.Click on the button. This will generate the output.
  • 12. Difference between multiple Regression and Stepwise Regression Stepwise Regression stepwise regression is a method of fitting regression models which the choice of predictive variables is carried out by an automatic procedure in each step, a variable is considered for addition to or subtraction from the set of explanatory variables based on some prespecified criterion. Multiple Regression Multiple linear regression (MLR), also known simply as multiple regression, is a statistical technique that uses several explanatory variables to predict the outcome of a response variable. Multiple regression is an extension of linear (OLS) regression that uses just one explanatory variable
  • 13. CLUSTER ANALYSIS Cluster analysis or clustering is the task of grouping a set of objects in such a way that objects in the same group (called a cluster) are more similar (in some sense) to each other than to those in other groups (clusters). It is a main task of exploratory data analysis and a common technique for statistical data analysis, used in many fields, including pattern recognition, image analysis information retrieval, bioinformatics, data compression, computer graphics and machine learning.