Download to read offline

![The views and opinions expressed in this report are not necessarily shared by the
European Commission or CASE Network, nor does the report anticipate decisions taken
by the European Commission.
Keywords:
consumption taxation, VAT, tax fraud, tax evasion, tax avoidance, tax gap,
tax non-compliance, policy gap
JEL Codes:
H24, H26
© CASE – Center for Social and Economic Research, Warsaw, 2020
Graphic Design:
Katarzyna Godyń-Skoczylas | grafo-mania
ISBN: 978-83-7178-703-4
Publisher:
CASE – Center for Social and Economic Research
Al. Jana Pawla II 61, office 212, 01-031 Warsaw, Poland
tel.: (48 22) 206 29 00, fax: (48 22) 206 29 01
e-mail: case@case-research.eu
www.case-research.eu
This report was commissioned by the Directorate General for Taxation and Customs Union
(TAXUD) of the European Commission under project No. TAXUD/2019/AO-14, and written
by a team of experts from CASE – Center for Social and Economic Research (Warsaw)
directed by Grzegorz Poniatowski, and composed of Mikhail Bonch-Osmolovskiy and Adam
Śmietanka. The Project was coordinated by Roberto Zavatta (Economisti Associati, Bologna).
It remains the property of TAXUD.
We acknowledge valuable comments from reviewers, Hana Zídková and Michael Udell. We
also acknowledge discussions with several officials of tax and statistical offices of the Member
States, who offered valuable information, comments, and suggestions. All responsibility for
the estimates and the interpretation in this Report remains with the authors.
Adam Śmietanka
No. 503 (2020)
[editorial page]
Acknowledgments
This report was commissioned by the Directorate General for TaxaRon and Customs Union (TAXUD) of
the European Commission under project No. TAXUD/2019/AO-14, and wri[en by a team of experts
from CASE (Center for Social and Economic Research, Warsaw) directed by Grzegorz Poniatowski, and
composed of Mikhail Bonch-Osmolovskiy and Adam Śmietanka. The Project was coordinated by
Roberto Zava[a (EconomisR AssociaR, Bologna). It remains the property of TAXUD.
We acknowledge valuable comments from reviewers, Hana Zídková and Michael Udell. We also
acknowledge discussions with several officials of tax and staRsRcal offices of the Member States, who
offered valuable informaRon, comments, and suggesRons. All responsibility for the esRmates and the
interpretaRon in this Report remains with the authors.
The views and opinions expressed in this report are not necessarily shared by the European
Commission or CASE Network, nor does the report anRcipate decisions taken by the European
Commission.
Keywords: consumpRon taxaRon, VAT, tax fraud, tax evasion, tax avoidance, tax gap, tax non-
compliance, policy gap
JEL codes: H24, H26
© CASE – Center for Social and Economic Research, Warsaw, 2020
Graphic Design: ….](https://image.slidesharecdn.com/reportno503-201207153322/75/Study-and-Reports-on-the-VAT-Gap-in-the-EU-28-Member-States-2020-Final-Report-2-2048.jpg)


![CASE Working Paper | No 1 (2015)
5
List of Tables
Table 1.1. Real and Nominal Growth in the EU-28 in 2018
(in national currencies [NAC]). . . . . . . . . . . . . . . . . . . . . . . . . . . . . . . . . . . . . . . . . . . . . . . . 17
Table 1.2. VAT Rate Structure as of 31 December 2017
and Changes during 2018 (%). . . . . . . . . . . . . . . . . . . . . . . . . . . . . . . . . . . . . . . . . . . . . . . . . 19
Table 1.3. Change in VAT Revenue Components (2018 over 2017). . . . . . . . . . 21
Table 2.1. VAT Gap as a percent of the VTTL
in EU-28 Member States, 2018 and 2017. . . . . . . . . . . . . . . . . . . . . . . . . . . . . . . . . . . . . 28
Table 3.1. Belgium: VAT Revenue, VTTL, Composition of VTTL,
and VAT Gap, 2014–2018 (EUR million). . . . . . . . . . . . . . . . . . . . . . . . . . . . . . . . . . . . . . 30
Table 3.2. Bulgaria: VAT Revenue, VTTL, Composition of VTTL,
and VAT Gap, 2014–2018 (BGN million). . . . . . . . . . . . . . . . . . . . . . . . . . . . . . . . . . . . . . 31
Table 3.3. Czechia: VAT Revenue, VTTL, Composition of VTTL,
and VAT Gap, 2014–2018 (CZK million). . . . . . . . . . . . . . . . . . . . . . . . . . . . . . . . . . . . . . 32
Table 3.4. Denmark: VAT Revenue, VTTL, Composition of VTTL,
and VAT Gap, 2014–2018 (DKK million). . . . . . . . . . . . . . . . . . . . . . . . . . . . . . . . . . . . . . 33
Table 3.5. Germany: VAT Revenue, VTTL, Composition of VTTL,
and VAT Gap, 2014–2018 (EUR million). . . . . . . . . . . . . . . . . . . . . . . . . . . . . . . . . . . . . . 34
Table 3.6. Estonia: VAT Revenue, VTTL, Composition of VTTL,
and VAT Gap, 2014–2018 (EUR million). . . . . . . . . . . . . . . . . . . . . . . . . . . . . . . . . . . . . . 35
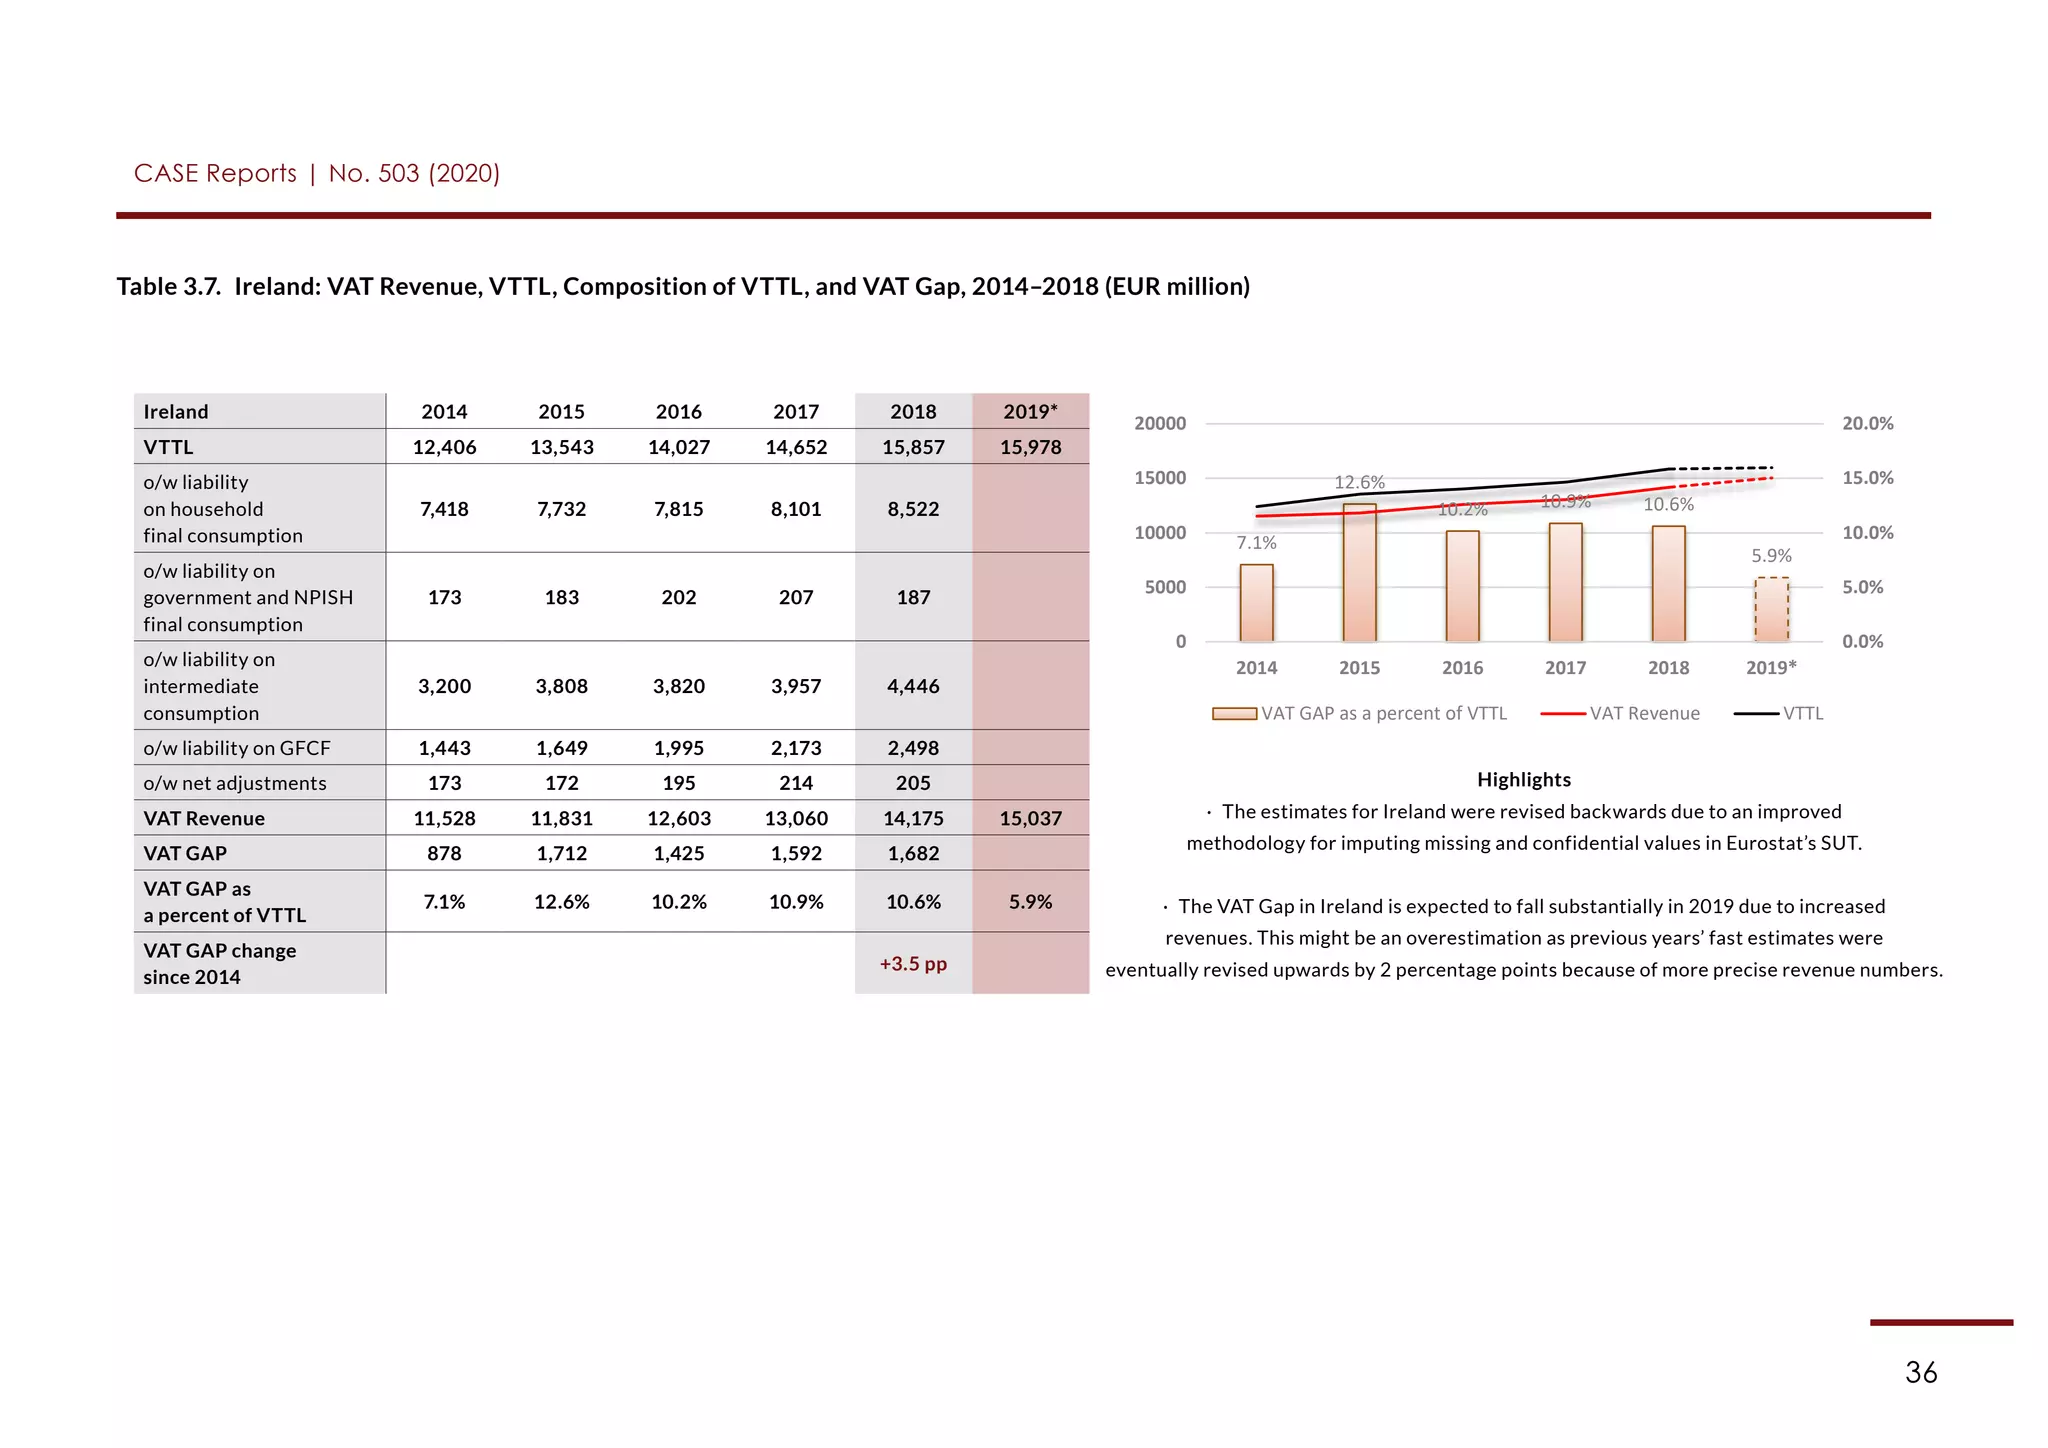
Table 3.7. Ireland: VAT Revenue, VTTL, Composition of VTTL,
and VAT Gap, 2014–2018 (EUR million). . . . . . . . . . . . . . . . . . . . . . . . . . . . . . . . . . . . . . 36
Table 3.8. Greece: VAT Revenue, VTTL, Composition of VTTL,
and VAT Gap, 2014–2018 (EUR million). . . . . . . . . . . . . . . . . . . . . . . . . . . . . . . . . . . . . . 37](https://image.slidesharecdn.com/reportno503-201207153322/75/Study-and-Reports-on-the-VAT-Gap-in-the-EU-28-Member-States-2020-Final-Report-5-2048.jpg)


![17
CASE Reports | No. 503 (2020)
Table 1.1. Real and Nominal Growth in the EU-28 in 2018 (in national currencies [NAC])
Source: Eurostat.
Member State
Real GDP
Growth (%)
General
Government
Balance (%)
Change in
Unemployment
Rate (pp)
Nominal Growth (%)
GDP
Final
Consumption
GFCF
Belgium 1.5 −0.8 −1.1 3.0 3.3 6.2
Bulgaria 3.1 2.0 −1.0 7.2 7.7 9.7
Czechia 2.8 0.9 −0.7 5.5 6.6 9.1
Denmark 2.4 0.7 −0.7 3.3 3.0 7.3
Germany 1.5 1.9 −0.4 3.1 2.9 6.3
Estonia 4.8 −0.6 −0.4 9.5 8.1 5.3
Ireland 8.2 0.1 −0.9 9.1 6.0 −18.7
Greece 1.9 1.0 −2.2 2.5 0.9 −12.0
Spain 2.4 −2.5 −1.9 3.5 3.4 7.7
France 1.8 −2.3 −0.4 2.8 2.2 4.6
Croatia 2.7 0.2 −2.7 4.5 4.5 4.7
Italy 0.8 −2.2 −0.6 1.7 2.0 3.8
Cyprus 4.1 −3.7 −2.7 5.5 5.0 −4.5
Latvia 4.3 −0.8 −1.3 8.4 7.3 18.0
Lithuania 3.6 0.6 −0.9 7.1 6.8 10.1
Luxembourg 3.1 3.1 0.1 5.7 6.1 −5.3
Hungary 5.1 −2.1 −0.5 9.9 7.6 24.4
Malta 7.3 1.9 −0.3 9.5 10.2 0.8
Netherlands 2.4 1.4 −1.1 4.9 4.6 6.3
Austria 2.4 0.2 −0.6 4.2 3.3 6.0
Poland 5.3 −0.2 −1.0 6.6 6.4 10.8
Portugal 2.6 −0.4 −1.9 4.3 3.9 9.0
Romania 4.4 −2.9 −0.7 11.0 13.2 3.9
Slovenia 4.1 0.7 −1.5 6.4 5.4 11.4
Slovakia 3.9 −1.0 −1.6 6.0 6.0 4.9
Finland 1.5 −0.9 −1.2 3.4 3.1 6.6
Sweden 2.0 0.8 −0.3 4.4 4.4 4.6
United Kingdom 1.3 −2.2 −0.3 3.5 3.8 1.6
EU-28 (EUR) 2.0 −0.7 −0.9 3.3 3.1 4.2](https://image.slidesharecdn.com/reportno503-201207153322/75/Study-and-Reports-on-the-VAT-Gap-in-the-EU-28-Member-States-2020-Final-Report-17-2048.jpg)


![CASE Reports | No. 503 (2020)
20
c. Sources of Change in VAT Revenue Components
The value of the actual VAT revenue can be decomposed into components, which is helpful
in understanding the underlying sources of its evolution. Since revenue is a product of the
VTTL and the compliance ratio4
, VAT collection could be expressed as:
Actual Revenue = VTTL × Compliance Ratio,
where Compliance Ratio is: 1 – VAT Gap (%).
As the VTTL is a product of the base and the effective rate, the actual revenue could be
further decomposed and expressed as:
Actual Revenue = Net Base × Effective Rate × Compliance Ratio,
where Effective Rate is the ratio of the theoretical VTTL to the Net Base. The Net
Base (which is the sum of the final consumption and investment by households, non-profit
institutions serving households [NPISH], and government), in turn, is calculated as the
difference between the Gross Base, which includes VAT, and the VAT revenues actually
collected.
Table 1.3 and Figure 1.1 present the decomposition of the total changes in nominal
VAT revenues into these three components: change in net taxable base, change in the
effective rate applied to the base, and change in the compliance ratio.5
4 In other words, VAT collection efficiency.
5 In other words, VAT collection efficiency.
5](https://image.slidesharecdn.com/reportno503-201207153322/75/Study-and-Reports-on-the-VAT-Gap-in-the-EU-28-Member-States-2020-Final-Report-20-2048.jpg)


![CASE Working Paper | No 1 (2015)
63
a. Introduction
The examination of tax non-compliance determinants is not new to the economic
literature. Most of the literature dealing with such factors focuses on personal income
taxes, voluntary tax compliance, and deterrence effects. This focus is clearly related to
data availability. The empirical studies are based mostly on micro-data gathered in surveys
and audit statistics. Thus, they concentrate on the impact of individuals’ characteristics
(see e.g. Feinstein [1991]). Similarly, studies scrutinising the determinants of compliance
in corporate and consumption taxation usually look at micro-level revenue figures from
fiscal registers or audit data (see e.g. Casey and Castro [2015]). The studies based on fiscal
registers and audit and survey data face an important limitation, i.e. the inability to observe
the variability of determinants across tax systems and economies. A rather limited num-
ber of studies looking at such cross-country variations focus on the variation of dynamics
in tax revenue (see e.g. Aizenman and Jinjarak, [2018]) or have a qualitative nature (see e.g.
Keen and Smith [2007]).
The European Commission’s VAT Gap Study made available a large set of standardised
data on tax compliance from a group of countries with varying economic and institution-
al characteristics. The series are available across a time period long enough to cover eco-
nomic upturns and downturns. As a result, the Study provides an opportunity to conduct
econometric analyses looking at the determinants of tax non-compliance from a new
perspective. The panel data derived from the VAT Gap Study have already been used by
a number of researchers – such as Barbone et al. (2013), Zídková (2017), Lešnik et al.
(2018), Poniatowski et al. (2018 and 2019), Szczypińska (2019), and Carfora et al. (2020).
The econometric analysis outlined in this Study extends the above-mentioned studies
several-fold. Concerning the data preparation procedure, we eliminate potential bias in
the data by correcting the VAT Gap series for each country for revisions in subsequent
vintages of the Study. Moreover, we account for measurement errors, i.e. changes in
the VAT Gap not related to change in compliance but rather to specific one-off factors.
To deal with the scarcity of observations of exogenous variables, we perform a dummy
5. Econometric Analysis
of VAT Gap Determinants](https://image.slidesharecdn.com/reportno503-201207153322/75/Study-and-Reports-on-the-VAT-Gap-in-the-EU-28-Member-States-2020-Final-Report-63-2048.jpg)


![CASE Reports | No. 503 (2020)
95
The Policy Gap could be further decomposed to account for the loss of revenue. Such
components are the Rate Gap and the Exemption Gap, which capture the loss in VAT
liability due to the application of reduced rates and the loss in liability due to the im-
plementation of exemptions.
The Rate Gap is defined as the difference between the VTTL and what would be obtained
in a counterfactual situation, in which the standard rate, instead of the reduced, parking,
and zero rates, is applied to final consumption. Thus, the Rate Gap captures the loss in
revenue that a particular country incurs by adopting multiple VAT rates instead of a single
standard rate (Barbone et al., 2015).
The Exemption Gap is defined as the difference between the VTTL and what would
be obtained in a counterfactual situation, in which the standard rate is applied to exempt
products and services, and no restriction of the right to deduct applies24
. Thus, the
Exemption Gap captures the amount of revenue that might be lost because of exempted
goods and services. Note that the Exemption Gap is composed of the loss in the VAT
on the value added of exempt sectors, minus the VAT on their inputs, minus the VAT
on GFCF inputs for these sectors. Thus, in principle, the Exemption Gap might be positive
or negative (if the particular sector had negative value added, or if it had large GFCF
expenditures relative to final consumption) (Barbone et al., 2015).
In algebraic terms, we have the following:
Definitions:
VAT Gap in the EU-28 Member States
products and services, and no restriction of the right to deduct applies24
. Thus, the
Exemption Gap captures the amount of revenue that might be lost because of exempted
goods and services. Note that the Exemption Gap is composed of the loss in the VAT on
the value added of exempt sectors, minus the VAT on their inputs, minus the VAT on GFCF
inputs for these sectors. Thus, in principle, the Exemption Gap might be positive or negative
(if the particular sector had negative value added, or if it had large GFCF expenditures
relative to final consumption) (Barbone et al., 2015).
In algebraic terms, we have the following:
Definitions:
𝑇𝑇𝑖𝑖
∗,𝐸𝐸
=
𝑉𝑉𝑉𝑉𝑉𝑉𝐿𝐿𝑖𝑖
∗,𝐸𝐸
𝐶𝐶𝑖𝑖
– effective rate for group i of products in the case where the standard rate
instead of the zero rate, parking rate, or reduced rate is applied (for final consumption and
the GFCF of non-business activities).
𝑉𝑉𝑉𝑉𝑉𝑉𝐿𝐿𝑖𝑖
∗,𝐸𝐸
– liability from final consumption and GFCF of the non-business activities of group
i of products, in the case where the standard rate instead of the zero rate, parking rate, or
reduced rate is applied. Actual liability from intermediate consumption and the GFCF of
business activities is assumed.
𝑇𝑇𝑖𝑖
∗,𝑅𝑅
=
𝑉𝑉𝑇𝑇𝑇𝑇𝐿𝐿𝑖𝑖
∗,𝑅𝑅
𝐶𝐶𝑖𝑖
– effective rate for group i of products in the event where exempt products
within the group are taxed at the standard rate.
𝑉𝑉𝑉𝑉𝑉𝑉𝐿𝐿𝑖𝑖
∗,𝑅𝑅
– liability from the final consumption of group i when exempt products within the
group are taxed at the standard rate. Actual liability from final consumption GFCF of non-
business activities is assumed.
𝜏𝜏𝑠𝑠 – statutory rate.
𝑖𝑖 ∈ (1; 65) – sectors of the economy.
– effective rate for group i of products in the case where the standard
rate instead of the zero rate, parking rate, or reduced rate is applied
(for final consumption and the GFCF of non-business activities).
VAT Gap in the EU-28 Member States
products and services, and no restriction of the right to deduct applies24
. Thus, the
Exemption Gap captures the amount of revenue that might be lost because of exempted
goods and services. Note that the Exemption Gap is composed of the loss in the VAT on
the value added of exempt sectors, minus the VAT on their inputs, minus the VAT on GFCF
inputs for these sectors. Thus, in principle, the Exemption Gap might be positive or negative
(if the particular sector had negative value added, or if it had large GFCF expenditures
relative to final consumption) (Barbone et al., 2015).
In algebraic terms, we have the following:
Definitions:
𝑇𝑇𝑖𝑖
∗,𝐸𝐸
=
𝑉𝑉𝑉𝑉𝑉𝑉𝐿𝐿𝑖𝑖
∗,𝐸𝐸
𝐶𝐶𝑖𝑖
– effective rate for group i of products in the case where the standard rate
instead of the zero rate, parking rate, or reduced rate is applied (for final consumption and
the GFCF of non-business activities).
𝑉𝑉𝑉𝑉𝑉𝑉𝐿𝐿𝑖𝑖
∗,𝐸𝐸
– liability from final consumption and GFCF of the non-business activities of group
i of products, in the case where the standard rate instead of the zero rate, parking rate, or
reduced rate is applied. Actual liability from intermediate consumption and the GFCF of
business activities is assumed.
𝑇𝑇𝑖𝑖
∗,𝑅𝑅
=
𝑉𝑉𝑇𝑇𝑇𝑇𝐿𝐿𝑖𝑖
∗,𝑅𝑅
𝐶𝐶𝑖𝑖
– effective rate for group i of products in the event where exempt products
within the group are taxed at the standard rate.
𝑉𝑉𝑉𝑉𝑉𝑉𝐿𝐿𝑖𝑖
∗,𝑅𝑅
– liability from the final consumption of group i when exempt products within the
group are taxed at the standard rate. Actual liability from final consumption GFCF of non-
business activities is assumed.
𝜏𝜏𝑠𝑠 – statutory rate.
𝑖𝑖 ∈ (1; 65) – sectors of the economy.
– liability from final consumption and GFCF of the non-business activities
of group i of products, in the case where the standard rate instead of
the zero rate, parking rate, or reduced rate is applied. Actual liability from
intermediate consumption and the GFCF of business activities is assumed.
24 The additive decomposition of the Policy Gap into the Exemption and Rate Gap presented in this Report differs from that
in Keen (2013). Keen (2013) defines the Rate Gap as the loss from applying reduced and zero rates to the final consumption
liability, measured as a percentage of the Notional Ideal Revenue. The Exemption Gap measures unrecovered VAT accumu-
lated in the production process as a percentage, on the contrary, of final consumption liability. Due to these definitions, the
Policy Gap can be split multiplicatively into gaps attributable to reduced rates and exemptions. Since the numerator of the “
[1 – Rate Gap]” and denominator of the “[1 – Exemption Gap]” are equal, multiplication of these two components yields
– VAT revenue as a percentage of Notional Ideal Revenue, which equals “[1 – Policy Gap]” (Barbone et al., 2015).](https://image.slidesharecdn.com/reportno503-201207153322/75/Study-and-Reports-on-the-VAT-Gap-in-the-EU-28-Member-States-2020-Final-Report-95-2048.jpg)
![CASE Reports | No. 503 (2020)
96
page 83 of 99
In algebraic terms, we have the following:
Definitions:
𝑇𝑇𝑖𝑖
∗,𝐸𝐸
=
𝑉𝑉𝑉𝑉𝑉𝑉𝐿𝐿𝑖𝑖
∗,𝐸𝐸
𝐶𝐶𝑖𝑖
– effective rate for group i of products in the case where the standard rate
instead of the zero rate, parking rate, or reduced rate is applied (for final consumption and
the GFCF of non-business activities).
𝑉𝑉𝑉𝑉𝑉𝑉𝐿𝐿𝑖𝑖
∗,𝐸𝐸
– liability from final consumption and GFCF of the non-business activities of group
i of products, in the case where the standard rate instead of the zero rate, parking rate, or
reduced rate is applied. Actual liability from intermediate consumption and the GFCF of
business activities is assumed.
𝑇𝑇𝑖𝑖
∗,𝑅𝑅
=
𝑉𝑉𝑇𝑇𝑇𝑇𝐿𝐿𝑖𝑖
∗,𝑅𝑅
𝐶𝐶𝑖𝑖
– effective rate for group i of products in the event where exempt products
within the group are taxed at the standard rate.
𝑉𝑉𝑉𝑉𝑉𝑉𝐿𝐿𝑖𝑖
∗,𝑅𝑅
– liability from the final consumption of group i when exempt products within the
group are taxed at the standard rate. Actual liability from final consumption GFCF of non-
business activities is assumed.
𝜏𝜏𝑠𝑠 – statutory rate.
𝑖𝑖 ∈ (1; 65) – sectors of the economy.
24 The additive decomposition of the Policy Gap into the Exemption and Rate Gap presented in this
Report differs from that in Keen (2013). Keen (2013) defines the Rate Gap as the loss from
applying reduced and zero rates to the final consumption liability, measured as a percentage of
the Notional Ideal Revenue. The Exemption Gap measures unrecovered VAT accumulated in
the production process as a percentage, on the contrary, of final consumption liability. Due to
these definitions, the Policy Gap can be split multiplicatively into gaps attributable to reduced
rates and exemptions. Since the numerator of the “[1 - Rate Gap]” and denominator of the “[1 -
Exemption Gap]” are equal, multiplication of these two components yields – VAT revenue as a
percentage of Notional Ideal Revenue, which equals “[1 - Policy Gap]” (Barbone et al., 2015).
– effective rate for group i of products in the event where exempt products
within the group are taxed at the standard rate.
page 83 of 99
Definitions:
𝑇𝑇𝑖𝑖
∗,𝐸𝐸
=
𝑉𝑉𝑉𝑉𝑉𝑉𝐿𝐿𝑖𝑖
∗,𝐸𝐸
𝐶𝐶𝑖𝑖
– effective rate for group i of products in the case where the standard rate
instead of the zero rate, parking rate, or reduced rate is applied (for final consumption and
the GFCF of non-business activities).
𝑉𝑉𝑉𝑉𝑉𝑉𝐿𝐿𝑖𝑖
∗,𝐸𝐸
– liability from final consumption and GFCF of the non-business activities of group
i of products, in the case where the standard rate instead of the zero rate, parking rate, or
reduced rate is applied. Actual liability from intermediate consumption and the GFCF of
business activities is assumed.
𝑇𝑇𝑖𝑖
∗,𝑅𝑅
=
𝑉𝑉𝑇𝑇𝑇𝑇𝐿𝐿𝑖𝑖
∗,𝑅𝑅
𝐶𝐶𝑖𝑖
– effective rate for group i of products in the event where exempt products
within the group are taxed at the standard rate.
𝑉𝑉𝑉𝑉𝑉𝑉𝐿𝐿𝑖𝑖
∗,𝑅𝑅
– liability from the final consumption of group i when exempt products within the
group are taxed at the standard rate. Actual liability from final consumption GFCF of non-
business activities is assumed.
𝜏𝜏𝑠𝑠 – statutory rate.
𝑖𝑖 ∈ (1; 65) – sectors of the economy.
24 The additive decomposition of the Policy Gap into the Exemption and Rate Gap presented in this
Report differs from that in Keen (2013). Keen (2013) defines the Rate Gap as the loss from
applying reduced and zero rates to the final consumption liability, measured as a percentage of
the Notional Ideal Revenue. The Exemption Gap measures unrecovered VAT accumulated in
the production process as a percentage, on the contrary, of final consumption liability. Due to
these definitions, the Policy Gap can be split multiplicatively into gaps attributable to reduced
rates and exemptions. Since the numerator of the “[1 - Rate Gap]” and denominator of the “[1 -
Exemption Gap]” are equal, multiplication of these two components yields – VAT revenue as a
percentage of Notional Ideal Revenue, which equals “[1 - Policy Gap]” (Barbone et al., 2015).
– liability from the final consumption of group i when exempt products
within the group are taxed at the standard rate. Actual liability from final
consumption GFCF of non-business activities is assumed.
page 83 of 99
Definitions:
𝑇𝑇𝑖𝑖
∗,𝐸𝐸
=
𝑉𝑉𝑉𝑉𝑉𝑉𝐿𝐿𝑖𝑖
∗,𝐸𝐸
𝐶𝐶𝑖𝑖
– effective rate for group i of products in the case where the standard rate
instead of the zero rate, parking rate, or reduced rate is applied (for final consumption and
the GFCF of non-business activities).
𝑉𝑉𝑉𝑉𝑉𝑉𝐿𝐿𝑖𝑖
∗,𝐸𝐸
– liability from final consumption and GFCF of the non-business activities of group
i of products, in the case where the standard rate instead of the zero rate, parking rate, or
reduced rate is applied. Actual liability from intermediate consumption and the GFCF of
business activities is assumed.
𝑇𝑇𝑖𝑖
∗,𝑅𝑅
=
𝑉𝑉𝑇𝑇𝑇𝑇𝐿𝐿𝑖𝑖
∗,𝑅𝑅
𝐶𝐶𝑖𝑖
– effective rate for group i of products in the event where exempt products
within the group are taxed at the standard rate.
𝑉𝑉𝑉𝑉𝑉𝑉𝐿𝐿𝑖𝑖
∗,𝑅𝑅
– liability from the final consumption of group i when exempt products within the
group are taxed at the standard rate. Actual liability from final consumption GFCF of non-
business activities is assumed.
𝜏𝜏𝑠𝑠 – statutory rate.
𝑖𝑖 ∈ (1; 65) – sectors of the economy.
24 The additive decomposition of the Policy Gap into the Exemption and Rate Gap presented in this
Report differs from that in Keen (2013). Keen (2013) defines the Rate Gap as the loss from
applying reduced and zero rates to the final consumption liability, measured as a percentage of
the Notional Ideal Revenue. The Exemption Gap measures unrecovered VAT accumulated in
the production process as a percentage, on the contrary, of final consumption liability. Due to
these definitions, the Policy Gap can be split multiplicatively into gaps attributable to reduced
rates and exemptions. Since the numerator of the “[1 - Rate Gap]” and denominator of the “[1 -
Exemption Gap]” are equal, multiplication of these two components yields – VAT revenue as a
percentage of Notional Ideal Revenue, which equals “[1 - Policy Gap]” (Barbone et al., 2015).
– statutory rate.
page 83 of 99
Definitions:
𝑇𝑇𝑖𝑖
∗,𝐸𝐸
=
𝑉𝑉𝑉𝑉𝑉𝑉𝐿𝐿𝑖𝑖
∗,𝐸𝐸
𝐶𝐶𝑖𝑖
– effective rate for group i of products in the case where the standard rate
instead of the zero rate, parking rate, or reduced rate is applied (for final consumption and
the GFCF of non-business activities).
𝑉𝑉𝑉𝑉𝑉𝑉𝐿𝐿𝑖𝑖
∗,𝐸𝐸
– liability from final consumption and GFCF of the non-business activities of group
i of products, in the case where the standard rate instead of the zero rate, parking rate, or
reduced rate is applied. Actual liability from intermediate consumption and the GFCF of
business activities is assumed.
𝑇𝑇𝑖𝑖
∗,𝑅𝑅
=
𝑉𝑉𝑇𝑇𝑇𝑇𝐿𝐿𝑖𝑖
∗,𝑅𝑅
𝐶𝐶𝑖𝑖
– effective rate for group i of products in the event where exempt products
within the group are taxed at the standard rate.
𝑉𝑉𝑉𝑉𝑉𝑉𝐿𝐿𝑖𝑖
∗,𝑅𝑅
– liability from the final consumption of group i when exempt products within the
group are taxed at the standard rate. Actual liability from final consumption GFCF of non-
business activities is assumed.
𝜏𝜏𝑠𝑠 – statutory rate.
𝑖𝑖 ∈ (1; 65) – sectors of the economy.
24 The additive decomposition of the Policy Gap into the Exemption and Rate Gap presented in this
Report differs from that in Keen (2013). Keen (2013) defines the Rate Gap as the loss from
applying reduced and zero rates to the final consumption liability, measured as a percentage of
the Notional Ideal Revenue. The Exemption Gap measures unrecovered VAT accumulated in
the production process as a percentage, on the contrary, of final consumption liability. Due to
these definitions, the Policy Gap can be split multiplicatively into gaps attributable to reduced
rates and exemptions. Since the numerator of the “[1 - Rate Gap]” and denominator of the “[1 -
Exemption Gap]” are equal, multiplication of these two components yields – VAT revenue as a
percentage of Notional Ideal Revenue, which equals “[1 - Policy Gap]” (Barbone et al., 2015).
– sectors of the economy.
Policy Gap:
Exemption Gap:
Rate Gap:
By definition we have:
Thus:
VAT Gap in the EU-28 Member States
Policy Gap:
1 − 𝑃𝑃 = (
∑ 𝑇𝑇𝑖𝑖 𝐶𝐶𝑖𝑖
𝑁𝑁
𝑖𝑖=1
𝜏𝜏𝑠𝑠 ∑ 𝐶𝐶𝑖𝑖
𝑁𝑁
𝑖𝑖=1
) (
∑ 𝑇𝑇𝑖𝑖
∗
𝐶𝐶𝑖𝑖
𝑁𝑁
𝑖𝑖=1
∑ 𝑇𝑇𝑖𝑖 𝐶𝐶𝑖𝑖
𝑁𝑁
𝑖𝑖=1
) = (
∑ 𝑇𝑇𝑖𝑖
∗
𝐶𝐶𝑖𝑖
𝑁𝑁
𝑖𝑖=1
𝜏𝜏𝑠𝑠 ∑ 𝐶𝐶𝑖𝑖
𝑁𝑁
𝑖𝑖=1
)
Exemption Gap:
1 − 𝑃𝑃𝐸𝐸 = (
∑ 𝑇𝑇𝑖𝑖 𝐶𝐶𝑖𝑖
𝑁𝑁
𝑖𝑖=1
𝜏𝜏𝑠𝑠 ∑ 𝐶𝐶𝑖𝑖
𝑁𝑁
𝑖𝑖=1
) (
∑ 𝑇𝑇𝑖𝑖
∗,𝐸𝐸
𝐶𝐶𝑖𝑖
𝑁𝑁
𝑖𝑖=1
∑ 𝑇𝑇𝑖𝑖 𝐶𝐶𝑖𝑖
𝑁𝑁
𝑖𝑖=1
) = (
∑ 𝑇𝑇𝑖𝑖
∗,𝐸𝐸
𝐶𝐶𝑖𝑖
𝑁𝑁
𝑖𝑖=1
𝜏𝜏𝑠𝑠 ∑ 𝐶𝐶𝑖𝑖
𝑁𝑁
𝑖𝑖=1
)
Rate Gap:
1 − 𝑃𝑃𝑅𝑅 = (
∑ 𝑇𝑇𝑖𝑖 𝐶𝐶𝑖𝑖
𝑁𝑁
𝑖𝑖=1
𝜏𝜏𝑠𝑠 ∑ 𝐶𝐶𝑖𝑖
𝑁𝑁
𝑖𝑖=1
) (
∑ 𝑇𝑇𝑖𝑖
∗,𝑅𝑅
𝐶𝐶𝑖𝑖
𝑁𝑁
𝑖𝑖=1
∑ 𝑇𝑇𝑖𝑖 𝐶𝐶𝑖𝑖
𝑁𝑁
𝑖𝑖=1
) = (
∑ 𝑇𝑇𝑖𝑖
∗,𝑅𝑅
𝐶𝐶𝑖𝑖
𝑁𝑁
𝑖𝑖=1
𝜏𝜏𝑠𝑠 ∑ 𝐶𝐶𝑖𝑖
𝑁𝑁
𝑖𝑖=1
)
By definition we have:
𝜏𝜏𝑠𝑠 ∑ 𝐶𝐶𝑖𝑖
𝑁𝑁
𝑖𝑖=1
= ∑ 𝑇𝑇𝑖𝑖
∗
𝐶𝐶𝑖𝑖
𝑁𝑁
𝑖𝑖=1
+ (𝜏𝜏𝑠𝑠 ∑ 𝐶𝐶𝑖𝑖
𝑁𝑁
𝑖𝑖=1
− ∑ 𝑇𝑇𝑖𝑖
∗
𝐶𝐶𝑖𝑖
𝑁𝑁
𝑖𝑖=1
)
= ∑ 𝑇𝑇𝑖𝑖
∗
𝐶𝐶𝑖𝑖
𝑁𝑁
𝑖𝑖=1
+ (𝜏𝜏𝑠𝑠 ∑ 𝐶𝐶𝑖𝑖
𝑁𝑁
𝑖𝑖=1
− ∑ 𝑇𝑇𝑖𝑖
∗,𝑅𝑅
𝐶𝐶𝑖𝑖
𝑁𝑁
𝑖𝑖=1
) + (𝜏𝜏𝑠𝑠 ∑ 𝐶𝐶𝑖𝑖
𝑁𝑁
𝑖𝑖=1
− ∑ 𝑇𝑇𝑖𝑖
∗,𝐸𝐸
𝐶𝐶𝑖𝑖
𝑁𝑁
𝑖𝑖=1
)
Thus:
𝑃𝑃 = 1 − (
∑ 𝑇𝑇𝑖𝑖
∗
𝐶𝐶𝑖𝑖
𝑁𝑁
𝑖𝑖=1
𝜏𝜏𝑠𝑠 ∑ 𝐶𝐶𝑖𝑖
𝑁𝑁
𝑖𝑖=1
) = (
𝜏𝜏𝑠𝑠 ∑ 𝐶𝐶𝑖𝑖
𝑁𝑁
𝑖𝑖=1 − ∑ 𝑇𝑇𝑖𝑖
∗
𝐶𝐶𝑖𝑖
𝑁𝑁
𝑖𝑖=1
𝜏𝜏𝑠𝑠 ∑ 𝐶𝐶𝑖𝑖
𝑁𝑁
𝑖𝑖=1
) = (
2𝜏𝜏𝑠𝑠 ∑ 𝐶𝐶𝑖𝑖
𝑁𝑁
𝑖𝑖=1 − ∑ 𝑇𝑇𝑖𝑖
∗,𝐸𝐸
𝐶𝐶𝑖𝑖
𝑁𝑁
𝑖𝑖=1 − ∑ 𝑇𝑇𝑖𝑖
∗,𝑅𝑅
𝐶𝐶𝑖𝑖
𝑁𝑁
𝑖𝑖=1
𝜏𝜏𝑠𝑠 ∑ 𝐶𝐶𝑖𝑖
𝑁𝑁
𝑖𝑖=1
)
= 𝑃𝑃𝑅𝑅 + 𝑃𝑃𝐸𝐸
Using the above convention, one can decompose the Rate Gap and the Exemption Gap
into components indicating the loss of the Notional Ideal Revenue due to the implementation
of reduced rates and exemptions on specific goods and services. Such additive
decomposition is carried out for the computation of, as defined by Barbone et al. (2015),
the Actionable Exemption Gap, which excludes the services and notional values that are
unlikely to be taxed even in an ideal world.](https://image.slidesharecdn.com/reportno503-201207153322/75/Study-and-Reports-on-the-VAT-Gap-in-the-EU-28-Member-States-2020-Final-Report-96-2048.jpg)


The report analyzes the VAT gap in the EU-28 member states in 2018. It finds that the total VAT gap in the EU was an estimated €137 billion, representing 12.2% of the total VAT liability. This is an increase compared to 2017, when the gap was €117 billion or 11.2% of the total liability. The report examines VAT revenue, total VAT liability, and VAT gap estimates for each member state from 2014 to 2018. It also conducts econometric analysis to identify factors influencing VAT gap levels across countries.


