ASP.NET System design 2
Download as PPT, PDF•1 like•2,800 views

The document provides information on Unified Modeling Language (UML) and its various diagrams used for modeling software systems. It discusses the background and benefits of object-oriented modeling. It then describes UML as a modeling language comprising various diagram types to capture different views of a system, including structural, behavioral, implementation and user views. Specific diagram types covered include use case diagrams, class diagrams, sequence diagrams, and object diagrams. Examples are provided for each diagram type to illustrate their elements and notation.


![Elements of a Class Diagram[contd..]
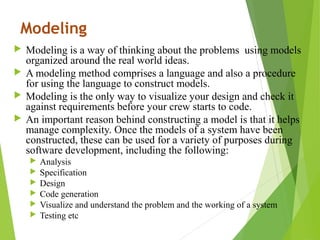
Modifiers are used to indicate visibility of attributes and operations.
‘+’ is used to denote Public visibility (everyone)
‘#’ is used to denote Protected visibility (derived)
‘-’ is used to denote Private visibility (no one)
By default, attributes are hidden and operations are visible
For example:
Here Account is the class name which has three attributes customer_name(type char,
visibility private), account_no( type int, visibility private), balance(type int,
visibility private) and Account class operates addfunds and withdraw method.
Visibility of operations are public.
Account
-customer_name: char
-account_no: int
-balance: int
+addfunds(in amount)
+withdraw(in amount)](https://image.slidesharecdn.com/systemdesign2-130721215751-phpapp01/85/ASP-NET-System-design-2-16-320.jpg)

![Relationship between Classes [contd..]
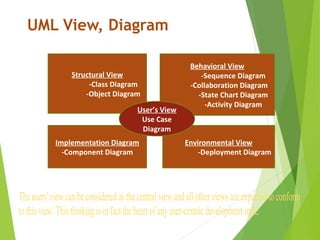
On each side of the association relation the multiplicity is noted as an
individual number or as a value range. The multiplicity indicates how
many instances of one class are associated with the other. Value ranges of
multiplicity are noted by specifying the minimum and maximum value,
separated by two dots. An asterisk is used as a wild card and means many
(zero or more).
The association of above figure should be read as "Many books may be
borrowed by a Library Member”
0..1 Borrowed by 0..*](https://image.slidesharecdn.com/systemdesign2-130721215751-phpapp01/85/ASP-NET-System-design-2-18-320.jpg)
![Relationship between Classes [contd..]
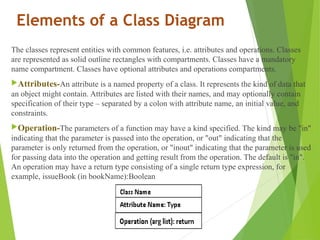
Aggregation -When a class is formed as a collection of other classes, it is
called an aggregation relationship between these classes. It is also called a
"has a" relationship. (It is a special type of association where the involved
classes are not only associated to each other, but a whole- part relationship
exists between them.)
Aggregation is represented by the diamond symbol at the composite/aggregate
end of a relationship. The number of instances of the component class
aggregated can also be shown in diagram.
1..* consist of 1..* 1..* consist of 1..*
A document can be considered as an aggregation of paragraphs. Each
paragraph can in turn be considered as aggregation of lines.](https://image.slidesharecdn.com/systemdesign2-130721215751-phpapp01/85/ASP-NET-System-design-2-19-320.jpg)
![Relationship between Classes [contd..]
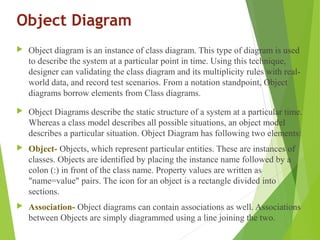
Composition- Composition is a stricter form of aggregation, in which the parts
may belong to only one whole and are existence-dependent on the whole. This
means that the life of each part is closely tied to the life of the whole. In other
words, the lifeline of the whole and the part are identical. When the whole is
created, the parts are created and when the whole is destroyed, the parts are
destroyed. In composition instance of one object contains instances of some
other objects.
A typical example of composition is an invoice object with invoice items. As
soon as the invoice object is created, all the invoice items in it are created and as
soon as the invoice object is destroyed, all invoice items in it are also destroyed.
The composition relationship is represented as a filled diamond drawn at the
composite-end.
1 *](https://image.slidesharecdn.com/systemdesign2-130721215751-phpapp01/85/ASP-NET-System-design-2-20-320.jpg)
![Relationship between Classes [contd..]
Inheritance/Generalization-Also called an "is a" or “is a kind of “
relationship, because the child class is a type of the parent class.
Generalization is the basic type of relationship used to define reusable
elements in the class diagram. Literally, the child classes "inherit" the
common functionality defined in the parent class.
The inheritance relationship is represented by means of an arrow with empty
triangular arrow head pointing from the subclass to the super-class.](https://image.slidesharecdn.com/systemdesign2-130721215751-phpapp01/85/ASP-NET-System-design-2-21-320.jpg)


ASP.NET System design 2
- 3. Background What are object-oriented (OO) methods? OO methods provide a set of techniques for analyzing, decomposing, and modularizing software system architectures In general, OO methods are characterized by structuring the system architecture on the basis of its objects (and classes of objects) rather than the actions it performs What are the benefits of OO? OO enhances key software quality factors of a system and its constituent components What is the rationale for using OO? In general, systems evolve and functionality changes, but objects and classes tend to remain stable over time Using Object Oriented Design Approach the development team creates the abstractions and mechanisms necessary to meet the system's behavioral requirements determined during analysis
- 4. Modeling Modeling is a way of thinking about the problems using models organized around the real world ideas. A modeling method comprises a language and also a procedure for using the language to construct models. Modeling is the only way to visualize your design and check it against requirements before your crew starts to code. An important reason behind constructing a model is that it helps manage complexity. Once the models of a system have been constructed, these can be used for a variety of purposes during software development, including the following: Analysis Specification Design Code generation Visualize and understand the problem and the working of a system Testing etc
- 5. What is UML? • Is a language. It is not simply a notation for drawing diagrams, but a complete language for capturing knowledge about a system and expressing knowledge(syntax) regarding the system for the purpose of communication and visualizing, constructing and documenting software system. • Applies to modeling and systems. Modeling involves a focus on understanding a subject (system) and capturing and being able to communicated in this knowledge. • It is the result of unifying the information systems and technology industry’s best engineering practices (principals, techniques, methods and tools). • The UML uses mostly graphical notations to express the OO analysis and design of software projects. • Help acquire an overall view of a system. UML is not dependent on any one language or technology.
- 6. UML View UML is a multi-diagrammatic language to capture different views of the system. Structural view-The structural view defines the structure of the problem in terms of the kinds of objects (classes) important to the understanding of the working of a system and to its implementation. It also captures the relationships among the classes (objects). The structural model is also called the static model, since the structure of a system does not change with time. Behavioral view-The behavioral view captures how objects interact with each other to realize the system behavior. The system behavior captures the dynamic behavior of the system. Implementation view-This view captures the important components of the system and their dependencies. Environmental view-This view models how the different components are implemented on different pieces of hardware. Users' view- This view defines the functionalities (facilities) made available by the system to its users.
- 7. UML Diagram
- 8. UML View, Diagram Structural View -Class Diagram -Object Diagram Behavioral View -Sequence Diagram -Collaboration Diagram -State Chart Diagram -Activity Diagram Implementation Diagram -Component Diagram Environmental View -Deployment Diagram User’s View Use Case Diagram Theusers'viewcanbeconsideredasthecentralviewandallotherviewsareexpectedtoconform tothisview.Thisthinkingisinfacttheheartofanyuser-centricdevelopmentstyle.
- 9. Use case Diagram represent the different ways in which a system can be used by users. The Use case diagram is used to identify the primary elements and processes that form the system. The primary elements are termed as "actors" and the processes are called "use cases." The Use case diagram shows which actors interact with each use case. These diagrams contain the following components: • Actors: An actor or external agent, lies outside the system model, but interacts with it in some way. An actor may be a user, a representative group of users, machine, or an information system. Actors are drawn as stick figures with the name of the actor written bellow of stick figure. Each actor can participate in one or more use cases. • Use Cases: The use case diagram for any system consists of a set of "use cases". Intuitively, use cases represent the different ways in which the users can use a system. A simple way to find all the use cases of a system is to ask the question: "What the users can do using the system?" Thus for the Library Information System (LIS), the use cases could be: issue-book, query-book, return-book etc. Each use case is represented by an ellipse. Use case diagrams
- 10. Symbols Of Use Case Diagram Actor Symbol: <<actor>> When a stick person icon represents an external system, it is annotated by the stereotype <<external system>> Use Case Symbol: Name of the use case is written inside the ellipse. Use Case Name
- 11. Relationships in Use Cases Include: Literally speaking, in an include relationship; a use case includes the functionality described in another use case as a part of its business process flow. An include relationship is depicted with a directed arrow. The tip of the arrowhead points to the parent use case and the child use case is connected at the base of the arrow. The type "<<includes>>" identifies the relationship as an include relationship. <<include>> Example: “Rent Item” use case executes by a staff in a store “Pay Fee” and “Check Overdue” also executes. <<include>> <<include>>
- 12. Relationships in Use Cases Extend: In an extend relationship between two use cases, the child use case adds to the existing functionality and characteristics of the parent use case. The main idea behind the ‘extends’ relationship among use cases is that it allows to show optional behavior. An extend relationship is depicted with a directed arrow having a dotted shaft, similar to the include relationship. The tip of the arrowhead points to the parent use case and the child use case is connected at the base of the arrow. <<extend>> An example of an extend relationship between the "Perform medical tests" (parent) and "Perform Pathological Tests" (child) use cases. The "Perform Pathological Tests" use case enhances the functionality of the "Perform medical tests" use case. <<extend>>
- 13. A Simple Use Case Diagram On Railway Reservation System
- 14. Class Diagrams Class Diagrams describe the static structure of a system, or how it is structured rather than how it behaves. By definition, a class diagram is a diagram showing a collection of classes and interfaces, along with the relationships among classes and interfaces. The use cases talk about "what are the requirements" of a system. The aim of designing classes is to convert this "what" to a "how" for each requirement. A class diagram is a pictorial representation of the detailed system design. A thing to remember is that a class diagram is a static view of a system. The structure of a system is represented using class diagrams.
- 15. Elements of a Class Diagram The classes represent entities with common features, i.e. attributes and operations. Classes are represented as solid outline rectangles with compartments. Classes have a mandatory name compartment. Classes have optional attributes and operations compartments. Attributes-An attribute is a named property of a class. It represents the kind of data that an object might contain. Attributes are listed with their names, and may optionally contain specification of their type – separated by a colon with attribute name, an initial value, and constraints. Operation-The parameters of a function may have a kind specified. The kind may be "in" indicating that the parameter is passed into the operation, or "out" indicating that the parameter is only returned from the operation, or "inout" indicating that the parameter is used for passing data into the operation and getting result from the operation. The default is "in". An operation may have a return type consisting of a single return type expression, for example, issueBook (in bookName):Boolean
- 16. Elements of a Class Diagram[contd..] Modifiers are used to indicate visibility of attributes and operations. ‘+’ is used to denote Public visibility (everyone) ‘#’ is used to denote Protected visibility (derived) ‘-’ is used to denote Private visibility (no one) By default, attributes are hidden and operations are visible For example: Here Account is the class name which has three attributes customer_name(type char, visibility private), account_no( type int, visibility private), balance(type int, visibility private) and Account class operates addfunds and withdraw method. Visibility of operations are public. Account -customer_name: char -account_no: int -balance: int +addfunds(in amount) +withdraw(in amount)
- 17. Relationship between Classes Association -An Association is a generic relationship between two classes, and is modeled by a solid line connecting the two classes. Associations are needed to enable objects to communicate with each other. A label, which is optional, although highly recommended, is typically one or two words describe the association. Label is shown alongside association line. A filled triangle indicates the direction in which the label should be read. works for An arrow may be attached to the end of the path to indicate that navigation is supported in the direction of the class pointed to. To restrict the navigation one direction only an arrowhead is used to indicate the navigational direction. In following figure, the association is navigable in only one direction, from BankAccount to Person, but not the reverse. The Person class is frozen and cannot be extended to know about the BankAccount class, but the reverse is not true.
- 18. Relationship between Classes [contd..] On each side of the association relation the multiplicity is noted as an individual number or as a value range. The multiplicity indicates how many instances of one class are associated with the other. Value ranges of multiplicity are noted by specifying the minimum and maximum value, separated by two dots. An asterisk is used as a wild card and means many (zero or more). The association of above figure should be read as "Many books may be borrowed by a Library Member” 0..1 Borrowed by 0..*
- 19. Relationship between Classes [contd..] Aggregation -When a class is formed as a collection of other classes, it is called an aggregation relationship between these classes. It is also called a "has a" relationship. (It is a special type of association where the involved classes are not only associated to each other, but a whole- part relationship exists between them.) Aggregation is represented by the diamond symbol at the composite/aggregate end of a relationship. The number of instances of the component class aggregated can also be shown in diagram. 1..* consist of 1..* 1..* consist of 1..* A document can be considered as an aggregation of paragraphs. Each paragraph can in turn be considered as aggregation of lines.
- 20. Relationship between Classes [contd..] Composition- Composition is a stricter form of aggregation, in which the parts may belong to only one whole and are existence-dependent on the whole. This means that the life of each part is closely tied to the life of the whole. In other words, the lifeline of the whole and the part are identical. When the whole is created, the parts are created and when the whole is destroyed, the parts are destroyed. In composition instance of one object contains instances of some other objects. A typical example of composition is an invoice object with invoice items. As soon as the invoice object is created, all the invoice items in it are created and as soon as the invoice object is destroyed, all invoice items in it are also destroyed. The composition relationship is represented as a filled diamond drawn at the composite-end. 1 *
- 21. Relationship between Classes [contd..] Inheritance/Generalization-Also called an "is a" or “is a kind of “ relationship, because the child class is a type of the parent class. Generalization is the basic type of relationship used to define reusable elements in the class diagram. Literally, the child classes "inherit" the common functionality defined in the parent class. The inheritance relationship is represented by means of an arrow with empty triangular arrow head pointing from the subclass to the super-class.
- 22. Steps Followed Draw class symbol in the and name it List the class attributes and try to understand their visibility List the class operations/methods and try to understand their visibility Make the proper links/association and note multiplicity properly Display relationships (if any) between classes. Give notations.
- 23. Example- A Class Diagram to represent the fact that an order consists of one or more order items. Each order item contains the name of the item, its quantity and the date by which it is required. Each order item is described by an item order specification object having details such as its vendor addresses, its unit price, and manufacturer.
- 24. An Example of Class Diagram
- 25. Object Diagram Object diagram is an instance of class diagram. This type of diagram is used to describe the system at a particular point in time. Using this technique, designer can validating the class diagram and its multiplicity rules with real- world data, and record test scenarios. From a notation standpoint, Object diagrams borrow elements from Class diagrams. Object Diagrams describe the static structure of a system at a particular time. Whereas a class model describes all possible situations, an object model describes a particular situation. Object Diagram has following two elements: Object- Objects, which represent particular entities. These are instances of classes. Objects are identified by placing the instance name followed by a colon (:) in front of the class name. Property values are written as "name=value" pairs. The icon for an object is a rectangle divided into sections. Association- Object diagrams can contain associations as well. Associations between Objects are simply diagrammed using a line joining the two.
- 26. An Example Of Object Diagram
- 27. Another Example Of Object Diagram
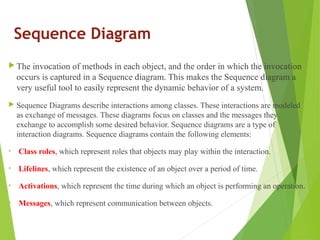
- 28. Sequence Diagram The invocation of methods in each object, and the order in which the invocation occurs is captured in a Sequence diagram. This makes the Sequence diagram a very useful tool to easily represent the dynamic behavior of a system. Sequence Diagrams describe interactions among classes. These interactions are modeled as exchange of messages. These diagrams focus on classes and the messages they exchange to accomplish some desired behavior. Sequence diagrams are a type of interaction diagrams. Sequence diagrams contain the following elements: • Class roles, which represent roles that objects may play within the interaction. • Lifelines, which represent the existence of an object over a period of time. • Activations, which represent the time during which an object is performing an operation. • Messages, which represent communication between objects.
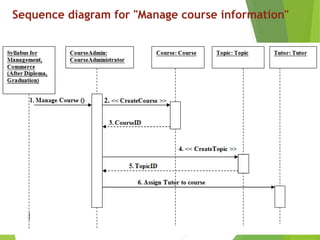
- 29. Sequence diagram for "Manage course information"
- 30. Sequence Diagram
- 31. Thank You !!