IMS HEALTH THE RISING TIDE OF OTC IN EUROPE 1
The RisingTide of OTC in Europe
TRENDS, CHALLENGES AND NEW POTENTIAL IN A RAPIDLY EVOLVING MARKET
Despite the global financial crisis, sales of OTC
medicines have continued to rise, spurred by a swathe of
recent innovation, greater promotion of self-medication
and increased access through expanding channels of
distribution. Consistently outperforming the
pharmaceutical sector, the OTC market is now a key
source of business expansion and competitive edge. In
Europe, powerful dynamics are driving new potential for
growth – in a number of mature markets, and especially
in emerging Central and Eastern Europe.The outlook is
good but challenges abound and identifying the best
opportunities will not be easy.As the market for self-
medication continues to evolve, with increasing layers of
complexity, companies looking to exploit its potential
must prepare, assess, differentiate and execute with a new
understanding of the emerging landscape and the drivers
of success within it.
The facts are telling: in 2008, for the first time ever,
growth in the sales of OTCs surged significantly ahead
of growth in the sales of prescription medicines. Now
worth €73bn globally, the OTC market continues to
outgrow the pharmaceutical sector by a clear and
consistent margin (Figure 1).
This unprecedented reversal of fortunes comes at a time
when ongoing constraints and increasing pressures
continue to hold back performance in the mature
pharmaceutical markets, as generics tighten their hold in
key therapy areas, R&D productivity remains critically
low and payers become increasingly restrictive in
granting market access. Conversely, positive and potent
dynamics are driving the OTC sector forward: emerging
economies with the critical mass to influence growth;
new distribution channels widening product access;
companies exploiting expanding opportunities for Rx to
OTC switch; leading players building strong brand
identities; and payers increasingly encouraging self-
medication.
Against this background of change and opportunity in
the evolving OTC market, more companies have been
actively reconsidering their presence in this key
consumer health segment. Historically, the trend has
been for global pharma to divest their consumer health
activities with a view to sharpening their focus on a
highly profitable core. Roche, BMS and Pfizer have all
sold their OTC business in recent years to concentrate
on their pharmaceutical portfolio.
Total Pharma = €631bn
Total OTC = €73bn
Valuegrowth(%)
OTCshareofpharma(%)
16
11.2
2.3
9.9
15.2%
14.0%
12.9%
12.3%
11.7%
11.6% 11.4% 11.2% 11.3% 11.5% 11.6%
0.3
11.1
2.2
8.2
3.3
9.4
4.2
7.3
6.0
6.4
4.6
6.8
5.4 5.2
6.3
5.5
7.0
6.2
7.0
14
12
10
8
6
4
2
0
16
14
12
10
8
6
4
2
0
2000 2001 2002 2003 2004 2005 2006 2007 2008 2009 2010
Pharma value growth rate OTC value growth rate OTC share of the total market
FIGURE 1: THE OTC MARKET IS NOW WORTH €73bn AND
CONTINUES TO OUTGROW PHARMA
Source: IMS Audits plus estimates
Written by:AndyTisman, Senior Principal, IMS Health
Year on Year Value Growth & OTC Share of
Total Phama - Data for MAT to Q2 2010
2 IMS HEALTH THE RISING TIDE OF OTC IN EUROPE
Today, the emerging picture is very different: suddenly,
erstwhile players are reclaiming their place in the OTC
arena – witness Pfizer’s re-entry to the market through
Wyeth in 2009. At the same time established OTC
players - including Bayer, J&J, GSK and Novartis - are all
reaffirming their commitment to the business with new
investments, open declarations of future intent, the
appointment of high-profile consumer health leaders,
and outreach into new OTC sectors - the strategic
purchase of Chattem Inc. by sanofi-aventis, for example,
has given the French group an important stake in the
U.S. market and a key platform for the conversion of its
prescription medicines to OTC status. Procter &
Gamble has even divested its pharmaceutical unit to
“focus singularly” on winning in the consumer
healthcare space.
Meanwhile, new competitors are also entering the fray,
pursuing major acquisitions to gain a foothold for
growth – Merck’s recent merger with Schering Plough
is a case in point. Nor does the trend end with OTC
and pharma. Food companies such as Danone and
Nestlé are also now vying for a piece of the expanding
pie as they capitalize on growing consumer interest in
matters of personal wellbeing, increasingly differentiating
their products on the basis of health. One thing is clear -
the OTC market is on its way to becoming an
increasingly competitive place.
AN EMERGING NEW WORLD
Globally,Western Europe and the U.S. remain the largest
OTC regions representing 43% of the sector’s sales, but
the real driving forces behind its recent performance are
the developing markets of South East Asia, Latin
America (LA) and Central & Eastern Europe (CEE)
(Figure 2). Powered by the might of China and Russia –
both among the Top 10 markets – and riding high on a
wave of new innovation, expanding core business and
the impact of price changes in CEE and LA markets,
these emerging regions now represent 77% of global
OTC growth (Figure 3).This is despite the fact that they
currently account for 36.3% of total OTC sales – a share
that is set to increase significantly as they continue to
outgrow the developed world.
CEE SETS THE PACE IN EUROPE
The developing economies are also gathering pace in
Europe, where the OTC market grew by nearly 7% in
2009. Here, growth in sales can be broadly divided into
three distinct groups, with the de-reimbursed markets of
France and Germany continuing to trail behind the rest
of Western Europe (Figure 4). Positive developments in
these two segments include a return to growth in
Total Pharma Total OTC
Share of Sales Share of Sales
Japan
N America
CE Europe
W Europe
Latin American
SE Asia/China
Other
Developing
Regions
Share of
Sales
Total Pharma
Total OTC
16.9%
36.2%
7.2
5.9
7.3
10.5
42.1
3.7
23.3
9.0
9.6
17.0
11.7
19.9
9.7
23.2
FIGURE 2: THE DEVELOPING REGIONS OF SEA, LA AND
CEE DRIVE GLOBAL OTC GROWTH
Source: IMS Audits plus estimates, MAT Q2 2010
Total OTC Total OTC
Share of Sales Share of Growth
Japan
N America
CE Europe
W Europe
Latin American
SE Asia/China
Other
9.0
9.6
17.0
11.7
19.9
9.7
23.2
14.5
21.2
38.2
6.3
17.6
8.7
-6.4
Developing
Regions
Total
OTC
Share of Sales
Share of Growth
36.3%
77.0%
T
FIGURE 3: EUROPE AND THE U.S. DOMINATE BUT
DEVELOPING REGIONS SHARE IS SET TO INCREASE
Source: IMS Audits plus estimates, MAT Q2 2010
Regional Shares of the OTC and Pharma Market
OTC Market Regional Share of Growth
IMS HEALTH THE RISING TIDE OF OTC IN EUROPE 3
France, where customers are now able to self-select
certain OTC products in pharmacies, and a strong
performance in Italy, reflecting increased access to OTCs
in this country. However, by far the strongest driver of
growth is CEE, led by the dynamic emerging markets of
Russia and Poland (Figure 4).
Although still in the relatively early stages of
development, and small relative to the size of the
country, the OTC market in Russia has made significant
progress in recent years, fuelled by a rise in disposable
incomes, increased activity by foreign and local
companies and the rapid expansion of pharmacy chains.
On the downside is the significant disparity between
high local currency growth in CEE versus a general
decline in Euro values in the region. However, with
levels of per capita spending on OTCs still relatively low
in these markets – averaging €34 versus a Western
European average of €68 - longer-term, there is thus still
considerable potential for further strong growth within
them (Figure 5).
The increasing importance of CEE has seen more major
players extending their reach into the region.Among
recent examples is the purchase of consumer health
group Nepentes S.A. by sanofi-aventis, in a move to
reinforce its consumer health platform in Poland.
However, while they can be an important source of
growth and innovation, the complex and varying nature
of the emerging CEE economies in terms of market
development, regulatory framework and competitive
structure make a deep understanding of their respective
characteristics imperative for future success.
Europe 3 Year Average Growth 5.8%
Europe Latest Year Growth 5.1%
CEE
Other W Europe
De-reimbursed
Markets
-2
0
0-5 5 10 15 20
3 Year Average Growth (%)
LatestYearGrowth(%)
25
2
4
6
10
14
12
8
FIGURE 4: THREE DISTINCT EUROPEAN SEGMENTS BUT
ONE KEY DRIVER OF GROWTH
Source: IMS OTC Review Plus Q2 2010
Globally,Western Europe and the
U.S. remain the largest OTC
regions representing 43% of the
sector’s sales, but the real driving
forces behind its recent performance
are the developing markets of
South East Asia, Latin America
(LA) and Central & Eastern
Europe (CEE).
Euros
YearonYearChange(%)
180
107
89 89
74 73
64 61
55 54
43
39 38 38 37
68
48 47 45
38 36
27
17
34
4%
0% -2%
7%
3%
1% -1% 0% 1% -1%
2%
7% 4%
12%
1%
10%
-2%
6% 5%
23%
10%
8%
16%
40%
20%
0%
-20%
-40%
-60%
-80%
160
140
120
100
80
60
40
20
0
BelgiumFrance
Germ
any
ItalyFinlandAustriaIreland
SwitzerlandNorway
UK
NLGreeceSpainPortugal
W
E
AveragePolandCzechSlovakiaHungaryRussiaBulgariaRom
ania
CEE
Average
FIGURE 5: THERE IS POTENTIAL FOR FURTHER CEE GROWTH
THROUGH INCREASED PER CAPITA SPENDING ON OTCS
Source: IMS OTCims at Public Prices
OTC Value Growth by Region: Long Term vs Short Term OTC Expenditure per Capita - European Countries
4 IMS HEALTH THE RISING TIDE OF OTC IN EUROPE
COUGHS AND COLDS LEAD THE WAY
Historically, five core therapeutic categories have consistently
dominated the OTC sector in Europe and it is these key
areas that continue to drive the majority of market growth
in the region (Figure 6). Cough and cold remedies remain
the leading segment with a 20% share of sales, although a
poor cold & flu season in winter 2009/2010 restricted
value growth to 4%.
Skin care is one of two product categories that are
currently growing faster than the overall OTC market
(8.8% value share) – the other one Digestive treatments
(14.3% value share), growing at 6.9% and 6.4%
respectively.There are clearly opportunities to be found
in these key therapy areas, but companies considering
their OTC strategies must focus on aligning the growth
potential with their own portfolio strengths, and if
necessary building – or buying – the relevant capabilities
to maximise their chances of success.
Today, despite the very favourable climate for OTCs in
Europe, most of the sector’s leading players are struggling
to match the current rate of market growth.The two
exceptions are GSK, growing at 7.4% in the wake of its
recent alli launch in Europe, and Reckitt Benckiser with
slowing, but nevertheless impressive, growth of 8.2%.
Elsewhere, for some of the leading payers, growth
remains in the low single digits (Figure 7) – a clear
indication that despite the expanding opportunities, there
are increasing challenges to operating well in this sector.
NEW CHANNELS
Among the key trends that are currently impacting the
global OTC market are major changes in product
distribution, characterised by a growing convergence
towards the pioneering UK multi-channel model. In
the U.S., for example, OTCs have long been available in
a variety of retail outlets, even those without a
pharmacy, as part of the country’s two-class (Rx/OTC)
system of drug distribution. In a move that is meeting
with considerable resistance, there are now discussions
around a third “pharmacy only” class in the country, the
emergence of which could potentially herald pharmacy
growth through an Rx to OTC professional supervision
model, along the lines of the Netherlands and UK.
Conversely, in Europe, where the traditional independent
pharmacy model has been the cornerstone of OTC
distribution for many years, countries are gradually evolving
towards broader OTC medicine availability and access.
Driven by the development of GSL lists leading to
movement away from the traditional pharmacy model to
new models within pharmacy (for example in France
where pharmacy self selection has evolved) and also outside
traditional pharmacy outlets (such as pharmacies within
mass market outlets in Italy and GSL medicine availability
outside a pharmacy in UK and Portugal mass market).
The ongoing evolution of OTC distribution in the region
has been marked by a number of notable milestones in
recent years (Figure 8).These include the deregulation of
Total OTC
Cough/Cold
Analgesics
Digestive
VMS & Tonics
Skin
Eye Care
Other OTC
Other OTC
22.9%
Cough/Cold
19.7%
Analgesics
16.5%
Skin
8.8%
Eye
Care
3.7%%
Digestive 14.3%
VMS & Tonics
14.0%
5.1%
4.3%
4.4%
6.4%
4.6%
6.9%
4.7%
5.1%
Value Growth (%)Europe OTC - Key Categories / Value Share (%)
FIGURE 6: FIVE CATEGORIES DOMINATE OTC ALTHOUGH
ONLY TWO ARE GROWING AHEAD OF THE TOTAL OTC MARKET
Source: IMS OTC Review Plus Q2 2010
Europe 3 Year Average Growth 5.8%
Europe Latest Year Growth 5.1%
1. Novartis
2. Sanofi-aventis
3. Bayer
5. GSK 6. RB
10. Stada
8. BMS
9. Pierre Fabre
-4
-2
0
0-2 2 4 6 8
3 Year Average Growth (%)
LatestYearGrowth(%)
10 12 14
2
4
6
8
10
4. J&J
7. BI
FIGURE 7: MATCHING MARKET GROWTH RATES REMAINS
AN ISSUE FOR MAJOR PLAYERS
Source: IMS OTC Review Plus Q2 2010
OTC Value Growth by Corporation: Long Term vs Short Term
IMS HEALTH THE RISING TIDE OF OTC IN EUROPE 5
OTC sales in Denmark, permitting a range of outlets to
stock selected OTC medicines (2001); the release of key
OTC therapeutic categories for sale outside pharmacies in
Norway (2003); provision for all OTC products to be sold
in non-pharmacy outlets in Portugal (2005); the
availability of all OTCs in Supermarket Corners under
pharmacist supervision in Italy (2006); liberalisation of the
OTC market in Hungary (2007); and the phenomenal
breakup of pharmacy monopoly in Sweden (2009),
heralding the return of private pharmacies to the country
for the first time in nearly 40 years.
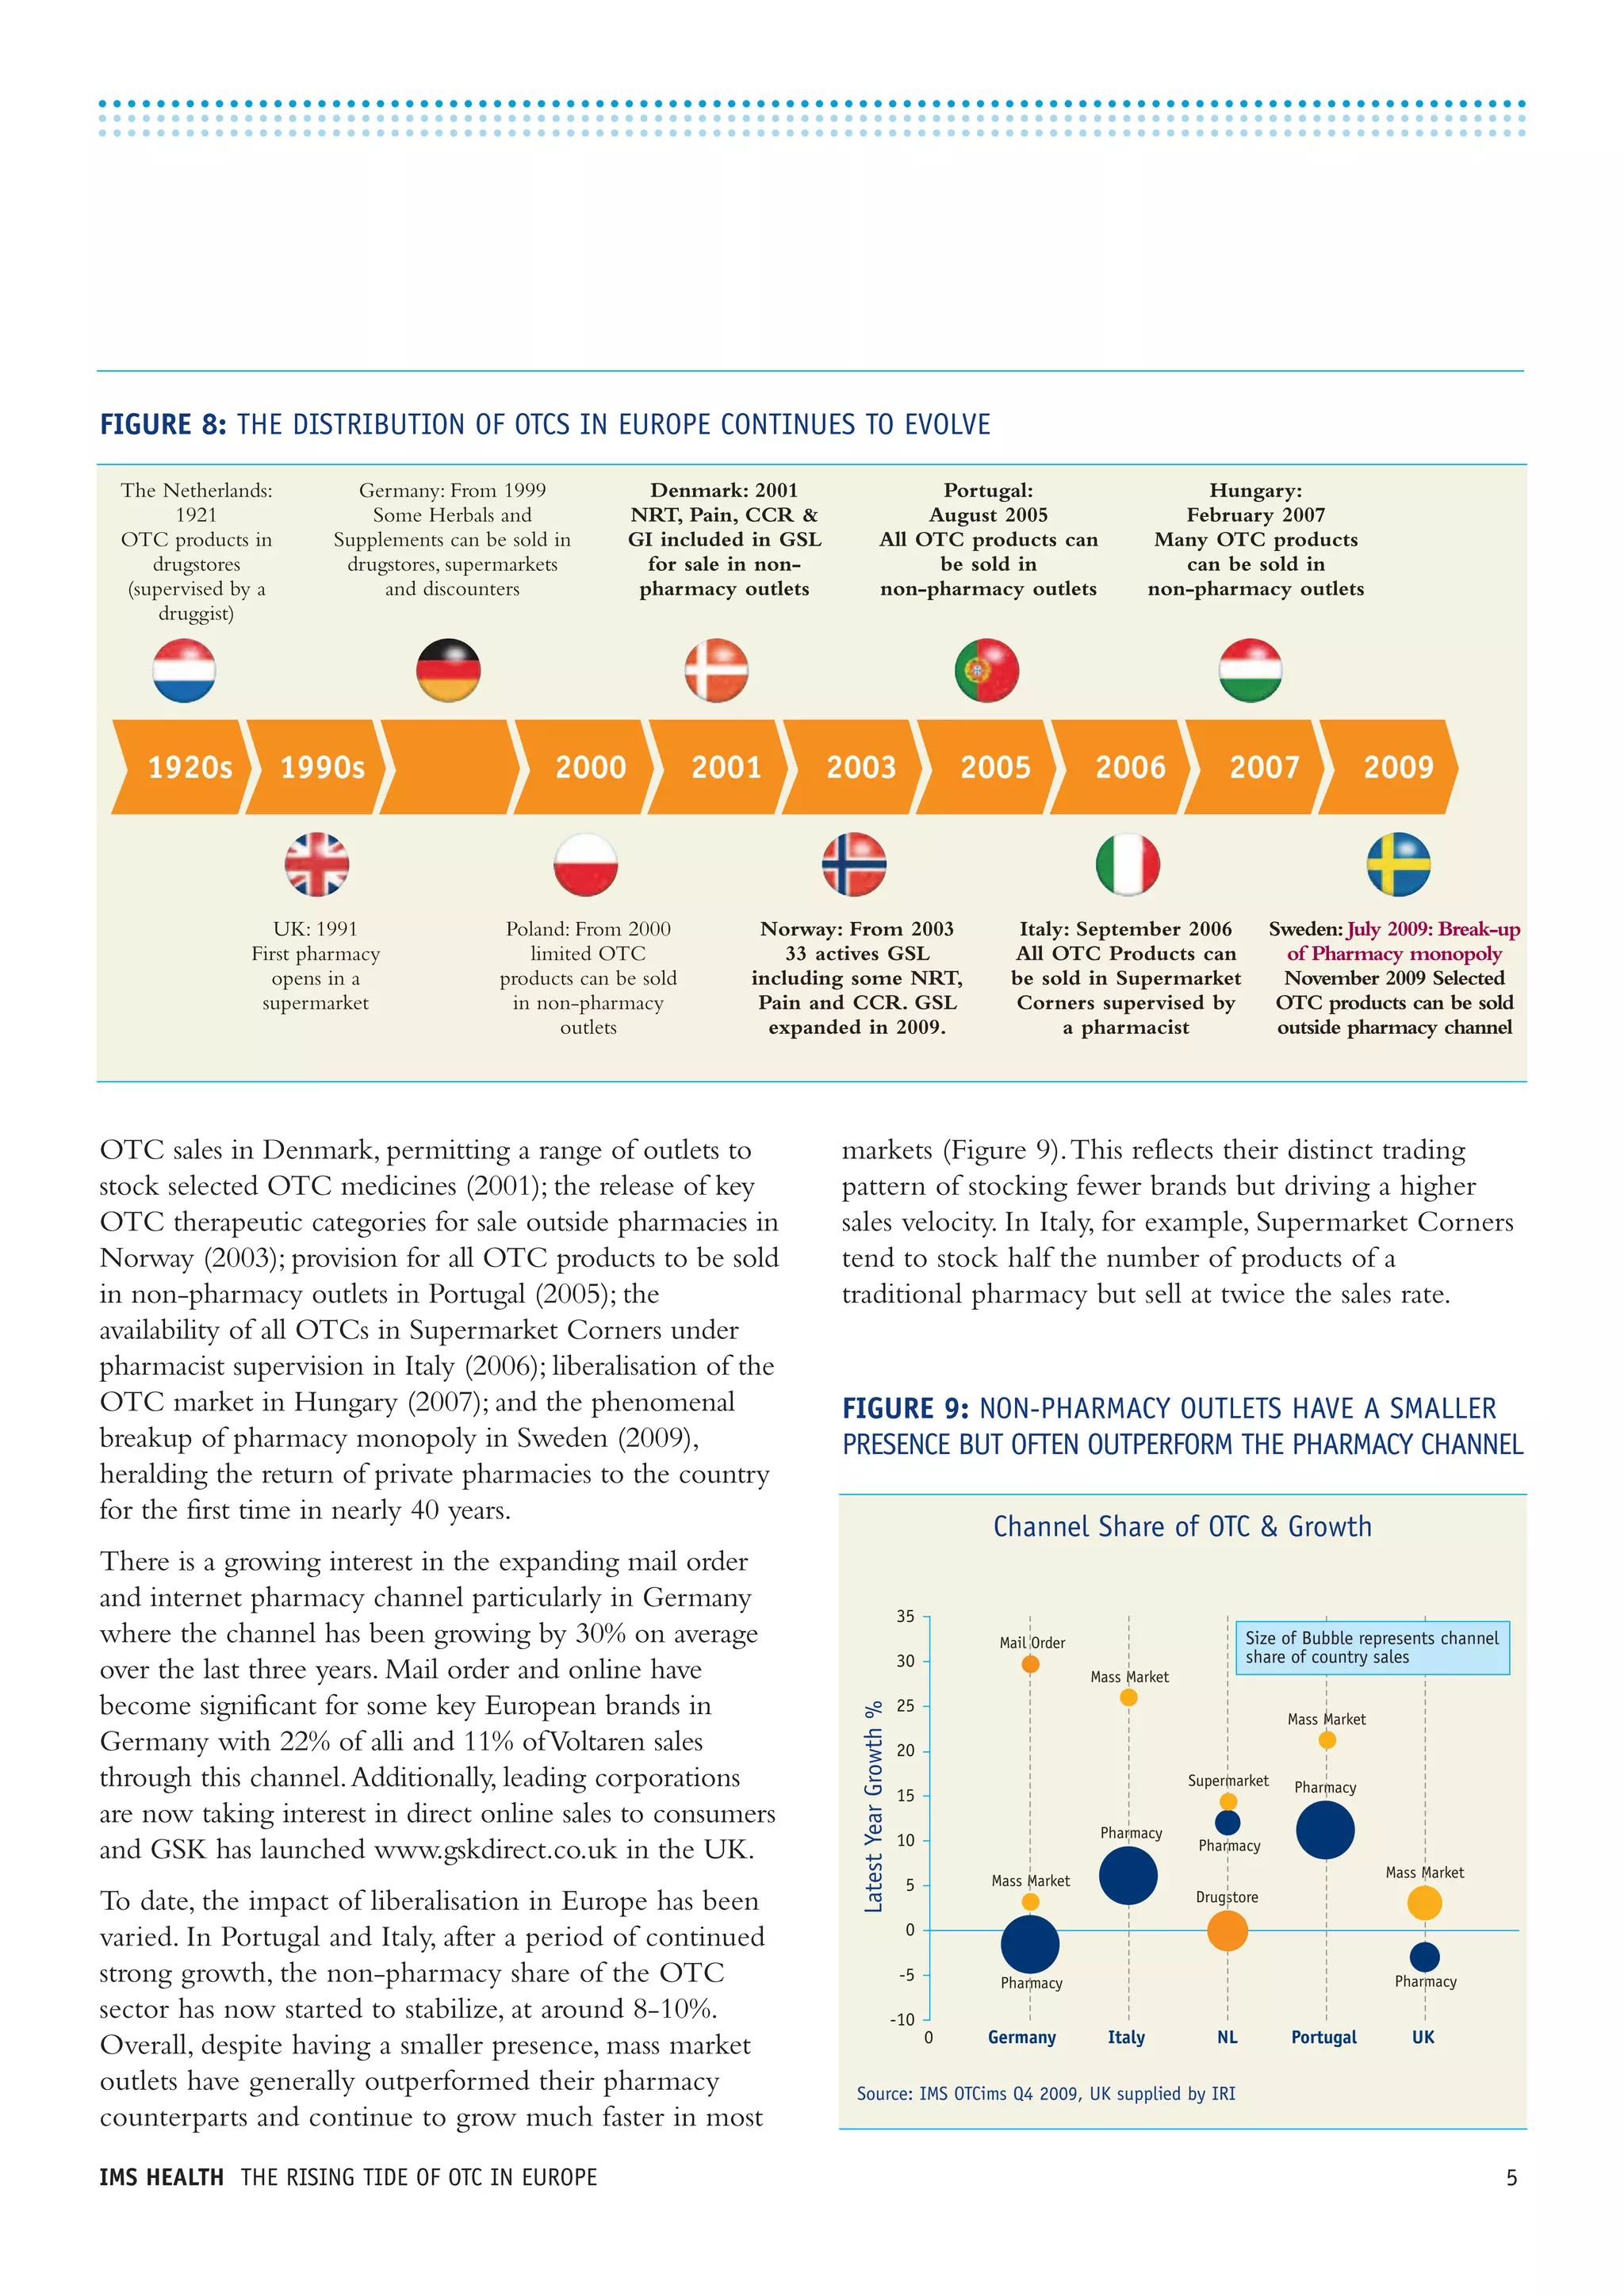
There is a growing interest in the expanding mail order
and internet pharmacy channel particularly in Germany
where the channel has been growing by 30% on average
over the last three years. Mail order and online have
become significant for some key European brands in
Germany with 22% of alli and 11% ofVoltaren sales
through this channel.Additionally, leading corporations
are now taking interest in direct online sales to consumers
and GSK has launched www.gskdirect.co.uk in the UK.
To date, the impact of liberalisation in Europe has been
varied. In Portugal and Italy, after a period of continued
strong growth, the non-pharmacy share of the OTC
sector has now started to stabilize, at around 8-10%.
Overall, despite having a smaller presence, mass market
outlets have generally outperformed their pharmacy
counterparts and continue to grow much faster in most
markets (Figure 9).This reflects their distinct trading
pattern of stocking fewer brands but driving a higher
sales velocity. In Italy, for example, Supermarket Corners
tend to stock half the number of products of a
traditional pharmacy but sell at twice the sales rate.
Germany
Mail Order
Mass Market
Mass Market
Mass Market
Mass Market
Pharmacy
Pharmacy
Pharmacy
Pharmacy
Pharmacy
Drugstore
Supermarket
NL Portugal UK0
-10
-5
0
5
10
15
20
25
30
35
Italy
Size of Bubble represents channel
share of country sales
FIGURE 9: NON-PHARMACY OUTLETS HAVE A SMALLER
PRESENCE BUT OFTEN OUTPERFORM THE PHARMACY CHANNEL
Source: IMS OTCims Q4 2009, UK supplied by IRI
FIGURE 8: THE DISTRIBUTION OF OTCS IN EUROPE CONTINUES TO EVOLVE
Channel Share of OTC & Growth
The Netherlands:
1921
OTC products in
drugstores
(supervised by a
druggist)
Germany: From 1999
Some Herbals and
Supplements can be sold in
drugstores, supermarkets
and discounters
Denmark: 2001
NRT, Pain, CCR &
GI included in GSL
for sale in non-
pharmacy outlets
Portugal:
August 2005
All OTC products can
be sold in
non-pharmacy outlets
Hungary:
February 2007
Many OTC products
can be sold in
non-pharmacy outlets
UK: 1991
First pharmacy
opens in a
supermarket
Poland: From 2000
limited OTC
products can be sold
in non-pharmacy
outlets
Norway: From 2003
33 actives GSL
including some NRT,
Pain and CCR. GSL
expanded in 2009.
Italy: September 2006
All OTC Products can
be sold in Supermarket
Corners supervised by
a pharmacist
Sweden: July 2009: Break-up
of Pharmacy monopoly
November 2009 Selected
OTC products can be sold
outside pharmacy channel
1920s 1990s 2000 2001 2003 2005 2006 2007 2009
LatestYearGrowth%
6 IMS HEALTH THE RISING TIDE OF OTC IN EUROPE
Pharmacies key but changing
Notwithstanding the gradual demise of pharmacy
monopolies over OTC distribution in Europe, much of
the region is, and will remain, essentially pharmacy-
driven (Figure 10). But even here, the picture is
changing.
Although the independent pharmacist is still dominant
in most major European markets, there is a clear trend
towards increased chain ownership. In the Netherlands,
nearly 40% of pharmacies are now owned by chains, in
the UK more than 50%, and in Norway and Sweden
more than 80% come into this category. Pharmacy
chains can take several forms – either corporate
ownership, multiple ownership by a single pharmacist, or
virtual chains, which include buying groups and co-
operative wholesalers. Generally better placed to
introduce new services than their independent
counterparts, chains are also, crucially, in a stronger
position to secure more competitive purchase prices.
Alongside these developments have been major moves
by all three of Europe’s leading wholesalers to increase
their pharmacy activities, aggressively building chains and
expanding across the region:AllianceBoots now owns
3,000 pharmacies, Celesio over 2,300 and the Phoenix
group more than 1,200. For now, however, their march
has been halted or at least diverted, following a
European Court of Justice decision backing member
states choice to prohibit third party ownership of
pharmacies if they so wish – a move that was triggered
by Celesio’s attempt to penetrate the German OTC
market through the purchase of Doc Morris.
Virtual networks
The market evolution also brings increasing
opportunities for private label and generic OTC
products.The Alphega Pharmacy model is one key
example of an emerging framework that is facilitating
this potential. Following the principle of the “SPAR”
food shops, where members remain independent but
enjoy access to collective buying and marketing, national
advertising support and a comprehensive own-brand
range,Alphega enables a network of independent
pharmacists across Europe to operate under a shared
brand and leverage the benefits of partnership and
increased buying and negotiating power, while retaining
full autonomy and control.
The formation of “symbol groups”, as well as formal
chains, opens up the potential for increasing “retailer
own brand” products, significantly increasing the threat
to branded manufacturers market share, as evidenced by
fact that retailer own brand has 25% value/33% volume
share of the USA OTC market.
NEW COMPLEXITIES, NEW IMPERATIVES
The continued deregulation of OTC distribution is not
only transforming the commercial landscape but also
redefining the rules of engagement within it.Along with
the plethora of new marketing channels comes the need
to co-ordinate a wide range of strategies in a region
where countries are evolving at a different rate and few
share the same channel mix (Figure 11). For
manufacturers looking to compete effectively in this
newly complex environment, a relentless focus on
successful execution will be key, through:
• Emerging markets dynamics, understanding
channel dynamics in new markets for optimal entry
strategies and resource allocation
• Consistent messaging, building a strong brand
identity in a multimedia environment
• Differentiated customer calls, with individual
messaging and suitable frequency for each store
• Recommendation, understanding the importance of
the HCP role and the best way to optimise this
within the marketing mix
e Netherlands
UK
Germany
Denmark*
Portugal
Italy
Poland
Sweden
Hungary
France
0
Pharmacy Non-Pharmacy
* Denmark – 17% of GSL products sold in Mass Market
100
FIGURE 10: PHARMACIES RETAIN THE BALANCE OF
POWER IN MOST MARKETS
Pharmacy vs Non-Pharmacy - % of Value Sales
Drugstores dominate, but the introduction of a general
sales list in July 2007 drives supermarket sales.
Supermarkets commoditising key OTC categories
through strong Private Label brand equity.
Non-Pharmacy gradually increasing, mail order is only
non-pharmacy sector to return significant growth.
GSL products available in “OTC Outlets” that are linked
to a specific pharmacy.
Several years on from liberalisation, Non-Pharmacy
share stabilising.
Non-Pharmacy is still a relatively small channel, but
continues to outgrow Pharmacy.
Legislation allows Non-Pharmacy availability, but
Pharmacy still maintains balance of power.
OTC sales outside pharmacy allowed from November
2009, early signs are positive for the new channel.
Some interest in selling OTCs outside pharmacy, but
distribution networks not yet in place.
Self selection of OTCs from May 2008 – impact is
thought to be limited. Leclerc promises cut price OTCs.
Netherlands
The
IMS HEALTH THE RISING TIDE OF OTC IN EUROPE 7
Consider the possibilities: It took 25 years for Nurofen
to build a Eurobrand.When GSK’s weight loss drug alli
(orlistat 60mg) became the first ever drug to be switched
via the centralised EU procedure, it had the opportunity
became a 28-country pan-European brand from day
one, with potential for immediate access to a combined
population of more than 500,000 million people and
160,000 pharmacies and the ability to reach out with
consistent marketing message throughout.While the
launch roll-out was staged over a period of time, within
nine months it was already a very significant product in
sales terms, generating revenues of €92m.
Unprecedented potential but no easy wins
Given its scale, prospects, technical efficiencies, and
potential for sales, marketing and promotional
efficiencies, the centralised EU procedure is a launch
route that can no longer be ignored. For pharmaceutical
manufacturers it brings key opportunities to synergize
Rx portfolios and realize the incremental value of
potentially under-utilized assets; for OTC firms comes
the chance to build a very large brand – efficiently,
effectively and fast. Success, however, is not guaranteed.
There may be one process but there are still 28 disparate
markets each with their own different levels of pharmacy
supervision, advertising regulations, consumer cultures,
pharmacy channel mix and national regulatory
capabilities.And with one process comes one chance to
get it right.Assessing and understanding the complex
dynamics – early - will be key to determining switch
feasibility and maximizing commercial potential.
LOOKING AHEAD
Going forward, the prospects for the OTC market in
Europe remain good as it continues to outpace
performance in the pharmaceutical sector.There are
powerful market forces - new players, new markets, new
regulatory provisions and new channels of OTC
distribution – reshaping the landscape that cannot be
ignored. However, the picture is mixed, competition is
growing and the market is still on the move. Success will
require a very different business model based on a deep
understanding of the market opportunities, the evolving
channel situation, the competitive scenario and more
demanding consumer needs. Companies on all sides who
are entering, re-entering or expanding in OTC will need
to think carefully about the business models they want to
adopt, the key stakeholders they need to address and make
sure they are focusing their resources in the most effective
and efficient way to generate sustainable business growth.
Germany
France
Russia
Italy
UK
Poland
Spain
Belgium
Switzerland
Czech Rep
Greece
Netherlands
Hungary
Sweden
Portugal
Denmark
Norway
Pharmacy


Drugstore Supermarkets Convenience
/Gas
Mail-Order
FIGURE 11: MANY DIFFERENT CHANNEL STRATEGIES
NEED TO BE COORDINATED ACROSS EUROPE
• Maximising commercial partnerships, by
leveraging growth opportunities
• Key account management, with a clear business
plan for each brand within each category and major
retailer chain
• Consumer and trade customer investment
allocation, understanding and assessing the optimum
balance between consumer and trade customer
promotional resources
NEW COMPLEXITIES, NEW IMPERATIVES
Opportunities to enter and expand in the European
OTC market have for some years included Rx-to-OTC
switching, an important driver of growth in the sector
and the source of many leading brands in the region.
Historically approached on a local basis and dogged by
varied regulatory acceptance in each individual market,
the power of switch has now been transformed with the
new, centralized EU application procedure. Not only
does this potentially offer access to all EU countries in a
single application, it also opens up a wealth of
opportunities for growing new categories in the
pan-European OTC arena.
• Denmark – Sales of GSL products are permitted in specific “OTC Outlet” which are linked to a
pharmacy but usually located within another store.
• Spain – Internet sales permitted after pharmacist consultation.
OTCCHWP1110
IMS HEALTH®
CORPORATE HEADQUARTERS
IMS Health
901 Main Avenue, Suite 612
Norwalk, CT 06851–1187
USA
Tel: 203.845.5200
REGIONAL HEADQUARTERS
The Americas
Plymouth Meeting
Executive Campus
660 W. Germantown Pike
Plymouth Meeting, PA
19462-0905
USA
Tel: 610.834.5000
EUROPE / MIDDLE EAST /
AFRICA
7 Harewood Avenue
London
NW1 6JB UK
Tel: +44 (0)20 3075 5888
www.imshealth.com
ASIA PACIFIC
10 Hoe Chiang Road
Keppel Towers #23-01/02
Singapore 089315
Tel: 65 6227 3006
JAPAN
Toranomon Towers
4-1-28 Toranomon
Minato-ku, Tokyo 105-0001
Japan
ABOUT IMS
Operating in more than 100 countries, IMS Health is the
world’s leading provider of market intelligence to the
pharmaceutical and healthcare industries.
With more than 55 years of industry experience, IMS Health
offers leading-edge market intelligence products and services
that are integral to clients’ day-to-day operations, including
product and portfolio management capabilities; commercial
effectiveness innovations; managed care and consumer health
offerings; and consulting and services solutions that improve
productivity and the delivery of quality healthcare
worldwide. Additional information is available at
http://www.imshealth.com
©2010 IMS Health Incorporated or its affiliates. All Rights Reserved.

The rising tide_of_otc_europe

  • 1.
    IMS HEALTH THERISING TIDE OF OTC IN EUROPE 1 The RisingTide of OTC in Europe TRENDS, CHALLENGES AND NEW POTENTIAL IN A RAPIDLY EVOLVING MARKET Despite the global financial crisis, sales of OTC medicines have continued to rise, spurred by a swathe of recent innovation, greater promotion of self-medication and increased access through expanding channels of distribution. Consistently outperforming the pharmaceutical sector, the OTC market is now a key source of business expansion and competitive edge. In Europe, powerful dynamics are driving new potential for growth – in a number of mature markets, and especially in emerging Central and Eastern Europe.The outlook is good but challenges abound and identifying the best opportunities will not be easy.As the market for self- medication continues to evolve, with increasing layers of complexity, companies looking to exploit its potential must prepare, assess, differentiate and execute with a new understanding of the emerging landscape and the drivers of success within it. The facts are telling: in 2008, for the first time ever, growth in the sales of OTCs surged significantly ahead of growth in the sales of prescription medicines. Now worth €73bn globally, the OTC market continues to outgrow the pharmaceutical sector by a clear and consistent margin (Figure 1). This unprecedented reversal of fortunes comes at a time when ongoing constraints and increasing pressures continue to hold back performance in the mature pharmaceutical markets, as generics tighten their hold in key therapy areas, R&D productivity remains critically low and payers become increasingly restrictive in granting market access. Conversely, positive and potent dynamics are driving the OTC sector forward: emerging economies with the critical mass to influence growth; new distribution channels widening product access; companies exploiting expanding opportunities for Rx to OTC switch; leading players building strong brand identities; and payers increasingly encouraging self- medication. Against this background of change and opportunity in the evolving OTC market, more companies have been actively reconsidering their presence in this key consumer health segment. Historically, the trend has been for global pharma to divest their consumer health activities with a view to sharpening their focus on a highly profitable core. Roche, BMS and Pfizer have all sold their OTC business in recent years to concentrate on their pharmaceutical portfolio. Total Pharma = €631bn Total OTC = €73bn Valuegrowth(%) OTCshareofpharma(%) 16 11.2 2.3 9.9 15.2% 14.0% 12.9% 12.3% 11.7% 11.6% 11.4% 11.2% 11.3% 11.5% 11.6% 0.3 11.1 2.2 8.2 3.3 9.4 4.2 7.3 6.0 6.4 4.6 6.8 5.4 5.2 6.3 5.5 7.0 6.2 7.0 14 12 10 8 6 4 2 0 16 14 12 10 8 6 4 2 0 2000 2001 2002 2003 2004 2005 2006 2007 2008 2009 2010 Pharma value growth rate OTC value growth rate OTC share of the total market FIGURE 1: THE OTC MARKET IS NOW WORTH €73bn AND CONTINUES TO OUTGROW PHARMA Source: IMS Audits plus estimates Written by:AndyTisman, Senior Principal, IMS Health Year on Year Value Growth & OTC Share of Total Phama - Data for MAT to Q2 2010
  • 2.
    2 IMS HEALTHTHE RISING TIDE OF OTC IN EUROPE Today, the emerging picture is very different: suddenly, erstwhile players are reclaiming their place in the OTC arena – witness Pfizer’s re-entry to the market through Wyeth in 2009. At the same time established OTC players - including Bayer, J&J, GSK and Novartis - are all reaffirming their commitment to the business with new investments, open declarations of future intent, the appointment of high-profile consumer health leaders, and outreach into new OTC sectors - the strategic purchase of Chattem Inc. by sanofi-aventis, for example, has given the French group an important stake in the U.S. market and a key platform for the conversion of its prescription medicines to OTC status. Procter & Gamble has even divested its pharmaceutical unit to “focus singularly” on winning in the consumer healthcare space. Meanwhile, new competitors are also entering the fray, pursuing major acquisitions to gain a foothold for growth – Merck’s recent merger with Schering Plough is a case in point. Nor does the trend end with OTC and pharma. Food companies such as Danone and Nestlé are also now vying for a piece of the expanding pie as they capitalize on growing consumer interest in matters of personal wellbeing, increasingly differentiating their products on the basis of health. One thing is clear - the OTC market is on its way to becoming an increasingly competitive place. AN EMERGING NEW WORLD Globally,Western Europe and the U.S. remain the largest OTC regions representing 43% of the sector’s sales, but the real driving forces behind its recent performance are the developing markets of South East Asia, Latin America (LA) and Central & Eastern Europe (CEE) (Figure 2). Powered by the might of China and Russia – both among the Top 10 markets – and riding high on a wave of new innovation, expanding core business and the impact of price changes in CEE and LA markets, these emerging regions now represent 77% of global OTC growth (Figure 3).This is despite the fact that they currently account for 36.3% of total OTC sales – a share that is set to increase significantly as they continue to outgrow the developed world. CEE SETS THE PACE IN EUROPE The developing economies are also gathering pace in Europe, where the OTC market grew by nearly 7% in 2009. Here, growth in sales can be broadly divided into three distinct groups, with the de-reimbursed markets of France and Germany continuing to trail behind the rest of Western Europe (Figure 4). Positive developments in these two segments include a return to growth in Total Pharma Total OTC Share of Sales Share of Sales Japan N America CE Europe W Europe Latin American SE Asia/China Other Developing Regions Share of Sales Total Pharma Total OTC 16.9% 36.2% 7.2 5.9 7.3 10.5 42.1 3.7 23.3 9.0 9.6 17.0 11.7 19.9 9.7 23.2 FIGURE 2: THE DEVELOPING REGIONS OF SEA, LA AND CEE DRIVE GLOBAL OTC GROWTH Source: IMS Audits plus estimates, MAT Q2 2010 Total OTC Total OTC Share of Sales Share of Growth Japan N America CE Europe W Europe Latin American SE Asia/China Other 9.0 9.6 17.0 11.7 19.9 9.7 23.2 14.5 21.2 38.2 6.3 17.6 8.7 -6.4 Developing Regions Total OTC Share of Sales Share of Growth 36.3% 77.0% T FIGURE 3: EUROPE AND THE U.S. DOMINATE BUT DEVELOPING REGIONS SHARE IS SET TO INCREASE Source: IMS Audits plus estimates, MAT Q2 2010 Regional Shares of the OTC and Pharma Market OTC Market Regional Share of Growth
  • 3.
    IMS HEALTH THERISING TIDE OF OTC IN EUROPE 3 France, where customers are now able to self-select certain OTC products in pharmacies, and a strong performance in Italy, reflecting increased access to OTCs in this country. However, by far the strongest driver of growth is CEE, led by the dynamic emerging markets of Russia and Poland (Figure 4). Although still in the relatively early stages of development, and small relative to the size of the country, the OTC market in Russia has made significant progress in recent years, fuelled by a rise in disposable incomes, increased activity by foreign and local companies and the rapid expansion of pharmacy chains. On the downside is the significant disparity between high local currency growth in CEE versus a general decline in Euro values in the region. However, with levels of per capita spending on OTCs still relatively low in these markets – averaging €34 versus a Western European average of €68 - longer-term, there is thus still considerable potential for further strong growth within them (Figure 5). The increasing importance of CEE has seen more major players extending their reach into the region.Among recent examples is the purchase of consumer health group Nepentes S.A. by sanofi-aventis, in a move to reinforce its consumer health platform in Poland. However, while they can be an important source of growth and innovation, the complex and varying nature of the emerging CEE economies in terms of market development, regulatory framework and competitive structure make a deep understanding of their respective characteristics imperative for future success. Europe 3 Year Average Growth 5.8% Europe Latest Year Growth 5.1% CEE Other W Europe De-reimbursed Markets -2 0 0-5 5 10 15 20 3 Year Average Growth (%) LatestYearGrowth(%) 25 2 4 6 10 14 12 8 FIGURE 4: THREE DISTINCT EUROPEAN SEGMENTS BUT ONE KEY DRIVER OF GROWTH Source: IMS OTC Review Plus Q2 2010 Globally,Western Europe and the U.S. remain the largest OTC regions representing 43% of the sector’s sales, but the real driving forces behind its recent performance are the developing markets of South East Asia, Latin America (LA) and Central & Eastern Europe (CEE). Euros YearonYearChange(%) 180 107 89 89 74 73 64 61 55 54 43 39 38 38 37 68 48 47 45 38 36 27 17 34 4% 0% -2% 7% 3% 1% -1% 0% 1% -1% 2% 7% 4% 12% 1% 10% -2% 6% 5% 23% 10% 8% 16% 40% 20% 0% -20% -40% -60% -80% 160 140 120 100 80 60 40 20 0 BelgiumFrance Germ any ItalyFinlandAustriaIreland SwitzerlandNorway UK NLGreeceSpainPortugal W E AveragePolandCzechSlovakiaHungaryRussiaBulgariaRom ania CEE Average FIGURE 5: THERE IS POTENTIAL FOR FURTHER CEE GROWTH THROUGH INCREASED PER CAPITA SPENDING ON OTCS Source: IMS OTCims at Public Prices OTC Value Growth by Region: Long Term vs Short Term OTC Expenditure per Capita - European Countries
  • 4.
    4 IMS HEALTHTHE RISING TIDE OF OTC IN EUROPE COUGHS AND COLDS LEAD THE WAY Historically, five core therapeutic categories have consistently dominated the OTC sector in Europe and it is these key areas that continue to drive the majority of market growth in the region (Figure 6). Cough and cold remedies remain the leading segment with a 20% share of sales, although a poor cold & flu season in winter 2009/2010 restricted value growth to 4%. Skin care is one of two product categories that are currently growing faster than the overall OTC market (8.8% value share) – the other one Digestive treatments (14.3% value share), growing at 6.9% and 6.4% respectively.There are clearly opportunities to be found in these key therapy areas, but companies considering their OTC strategies must focus on aligning the growth potential with their own portfolio strengths, and if necessary building – or buying – the relevant capabilities to maximise their chances of success. Today, despite the very favourable climate for OTCs in Europe, most of the sector’s leading players are struggling to match the current rate of market growth.The two exceptions are GSK, growing at 7.4% in the wake of its recent alli launch in Europe, and Reckitt Benckiser with slowing, but nevertheless impressive, growth of 8.2%. Elsewhere, for some of the leading payers, growth remains in the low single digits (Figure 7) – a clear indication that despite the expanding opportunities, there are increasing challenges to operating well in this sector. NEW CHANNELS Among the key trends that are currently impacting the global OTC market are major changes in product distribution, characterised by a growing convergence towards the pioneering UK multi-channel model. In the U.S., for example, OTCs have long been available in a variety of retail outlets, even those without a pharmacy, as part of the country’s two-class (Rx/OTC) system of drug distribution. In a move that is meeting with considerable resistance, there are now discussions around a third “pharmacy only” class in the country, the emergence of which could potentially herald pharmacy growth through an Rx to OTC professional supervision model, along the lines of the Netherlands and UK. Conversely, in Europe, where the traditional independent pharmacy model has been the cornerstone of OTC distribution for many years, countries are gradually evolving towards broader OTC medicine availability and access. Driven by the development of GSL lists leading to movement away from the traditional pharmacy model to new models within pharmacy (for example in France where pharmacy self selection has evolved) and also outside traditional pharmacy outlets (such as pharmacies within mass market outlets in Italy and GSL medicine availability outside a pharmacy in UK and Portugal mass market). The ongoing evolution of OTC distribution in the region has been marked by a number of notable milestones in recent years (Figure 8).These include the deregulation of Total OTC Cough/Cold Analgesics Digestive VMS & Tonics Skin Eye Care Other OTC Other OTC 22.9% Cough/Cold 19.7% Analgesics 16.5% Skin 8.8% Eye Care 3.7%% Digestive 14.3% VMS & Tonics 14.0% 5.1% 4.3% 4.4% 6.4% 4.6% 6.9% 4.7% 5.1% Value Growth (%)Europe OTC - Key Categories / Value Share (%) FIGURE 6: FIVE CATEGORIES DOMINATE OTC ALTHOUGH ONLY TWO ARE GROWING AHEAD OF THE TOTAL OTC MARKET Source: IMS OTC Review Plus Q2 2010 Europe 3 Year Average Growth 5.8% Europe Latest Year Growth 5.1% 1. Novartis 2. Sanofi-aventis 3. Bayer 5. GSK 6. RB 10. Stada 8. BMS 9. Pierre Fabre -4 -2 0 0-2 2 4 6 8 3 Year Average Growth (%) LatestYearGrowth(%) 10 12 14 2 4 6 8 10 4. J&J 7. BI FIGURE 7: MATCHING MARKET GROWTH RATES REMAINS AN ISSUE FOR MAJOR PLAYERS Source: IMS OTC Review Plus Q2 2010 OTC Value Growth by Corporation: Long Term vs Short Term
  • 5.
    IMS HEALTH THERISING TIDE OF OTC IN EUROPE 5 OTC sales in Denmark, permitting a range of outlets to stock selected OTC medicines (2001); the release of key OTC therapeutic categories for sale outside pharmacies in Norway (2003); provision for all OTC products to be sold in non-pharmacy outlets in Portugal (2005); the availability of all OTCs in Supermarket Corners under pharmacist supervision in Italy (2006); liberalisation of the OTC market in Hungary (2007); and the phenomenal breakup of pharmacy monopoly in Sweden (2009), heralding the return of private pharmacies to the country for the first time in nearly 40 years. There is a growing interest in the expanding mail order and internet pharmacy channel particularly in Germany where the channel has been growing by 30% on average over the last three years. Mail order and online have become significant for some key European brands in Germany with 22% of alli and 11% ofVoltaren sales through this channel.Additionally, leading corporations are now taking interest in direct online sales to consumers and GSK has launched www.gskdirect.co.uk in the UK. To date, the impact of liberalisation in Europe has been varied. In Portugal and Italy, after a period of continued strong growth, the non-pharmacy share of the OTC sector has now started to stabilize, at around 8-10%. Overall, despite having a smaller presence, mass market outlets have generally outperformed their pharmacy counterparts and continue to grow much faster in most markets (Figure 9).This reflects their distinct trading pattern of stocking fewer brands but driving a higher sales velocity. In Italy, for example, Supermarket Corners tend to stock half the number of products of a traditional pharmacy but sell at twice the sales rate. Germany Mail Order Mass Market Mass Market Mass Market Mass Market Pharmacy Pharmacy Pharmacy Pharmacy Pharmacy Drugstore Supermarket NL Portugal UK0 -10 -5 0 5 10 15 20 25 30 35 Italy Size of Bubble represents channel share of country sales FIGURE 9: NON-PHARMACY OUTLETS HAVE A SMALLER PRESENCE BUT OFTEN OUTPERFORM THE PHARMACY CHANNEL Source: IMS OTCims Q4 2009, UK supplied by IRI FIGURE 8: THE DISTRIBUTION OF OTCS IN EUROPE CONTINUES TO EVOLVE Channel Share of OTC & Growth The Netherlands: 1921 OTC products in drugstores (supervised by a druggist) Germany: From 1999 Some Herbals and Supplements can be sold in drugstores, supermarkets and discounters Denmark: 2001 NRT, Pain, CCR & GI included in GSL for sale in non- pharmacy outlets Portugal: August 2005 All OTC products can be sold in non-pharmacy outlets Hungary: February 2007 Many OTC products can be sold in non-pharmacy outlets UK: 1991 First pharmacy opens in a supermarket Poland: From 2000 limited OTC products can be sold in non-pharmacy outlets Norway: From 2003 33 actives GSL including some NRT, Pain and CCR. GSL expanded in 2009. Italy: September 2006 All OTC Products can be sold in Supermarket Corners supervised by a pharmacist Sweden: July 2009: Break-up of Pharmacy monopoly November 2009 Selected OTC products can be sold outside pharmacy channel 1920s 1990s 2000 2001 2003 2005 2006 2007 2009 LatestYearGrowth%
  • 6.
    6 IMS HEALTHTHE RISING TIDE OF OTC IN EUROPE Pharmacies key but changing Notwithstanding the gradual demise of pharmacy monopolies over OTC distribution in Europe, much of the region is, and will remain, essentially pharmacy- driven (Figure 10). But even here, the picture is changing. Although the independent pharmacist is still dominant in most major European markets, there is a clear trend towards increased chain ownership. In the Netherlands, nearly 40% of pharmacies are now owned by chains, in the UK more than 50%, and in Norway and Sweden more than 80% come into this category. Pharmacy chains can take several forms – either corporate ownership, multiple ownership by a single pharmacist, or virtual chains, which include buying groups and co- operative wholesalers. Generally better placed to introduce new services than their independent counterparts, chains are also, crucially, in a stronger position to secure more competitive purchase prices. Alongside these developments have been major moves by all three of Europe’s leading wholesalers to increase their pharmacy activities, aggressively building chains and expanding across the region:AllianceBoots now owns 3,000 pharmacies, Celesio over 2,300 and the Phoenix group more than 1,200. For now, however, their march has been halted or at least diverted, following a European Court of Justice decision backing member states choice to prohibit third party ownership of pharmacies if they so wish – a move that was triggered by Celesio’s attempt to penetrate the German OTC market through the purchase of Doc Morris. Virtual networks The market evolution also brings increasing opportunities for private label and generic OTC products.The Alphega Pharmacy model is one key example of an emerging framework that is facilitating this potential. Following the principle of the “SPAR” food shops, where members remain independent but enjoy access to collective buying and marketing, national advertising support and a comprehensive own-brand range,Alphega enables a network of independent pharmacists across Europe to operate under a shared brand and leverage the benefits of partnership and increased buying and negotiating power, while retaining full autonomy and control. The formation of “symbol groups”, as well as formal chains, opens up the potential for increasing “retailer own brand” products, significantly increasing the threat to branded manufacturers market share, as evidenced by fact that retailer own brand has 25% value/33% volume share of the USA OTC market. NEW COMPLEXITIES, NEW IMPERATIVES The continued deregulation of OTC distribution is not only transforming the commercial landscape but also redefining the rules of engagement within it.Along with the plethora of new marketing channels comes the need to co-ordinate a wide range of strategies in a region where countries are evolving at a different rate and few share the same channel mix (Figure 11). For manufacturers looking to compete effectively in this newly complex environment, a relentless focus on successful execution will be key, through: • Emerging markets dynamics, understanding channel dynamics in new markets for optimal entry strategies and resource allocation • Consistent messaging, building a strong brand identity in a multimedia environment • Differentiated customer calls, with individual messaging and suitable frequency for each store • Recommendation, understanding the importance of the HCP role and the best way to optimise this within the marketing mix e Netherlands UK Germany Denmark* Portugal Italy Poland Sweden Hungary France 0 Pharmacy Non-Pharmacy * Denmark – 17% of GSL products sold in Mass Market 100 FIGURE 10: PHARMACIES RETAIN THE BALANCE OF POWER IN MOST MARKETS Pharmacy vs Non-Pharmacy - % of Value Sales Drugstores dominate, but the introduction of a general sales list in July 2007 drives supermarket sales. Supermarkets commoditising key OTC categories through strong Private Label brand equity. Non-Pharmacy gradually increasing, mail order is only non-pharmacy sector to return significant growth. GSL products available in “OTC Outlets” that are linked to a specific pharmacy. Several years on from liberalisation, Non-Pharmacy share stabilising. Non-Pharmacy is still a relatively small channel, but continues to outgrow Pharmacy. Legislation allows Non-Pharmacy availability, but Pharmacy still maintains balance of power. OTC sales outside pharmacy allowed from November 2009, early signs are positive for the new channel. Some interest in selling OTCs outside pharmacy, but distribution networks not yet in place. Self selection of OTCs from May 2008 – impact is thought to be limited. Leclerc promises cut price OTCs. Netherlands The
  • 7.
    IMS HEALTH THERISING TIDE OF OTC IN EUROPE 7 Consider the possibilities: It took 25 years for Nurofen to build a Eurobrand.When GSK’s weight loss drug alli (orlistat 60mg) became the first ever drug to be switched via the centralised EU procedure, it had the opportunity became a 28-country pan-European brand from day one, with potential for immediate access to a combined population of more than 500,000 million people and 160,000 pharmacies and the ability to reach out with consistent marketing message throughout.While the launch roll-out was staged over a period of time, within nine months it was already a very significant product in sales terms, generating revenues of €92m. Unprecedented potential but no easy wins Given its scale, prospects, technical efficiencies, and potential for sales, marketing and promotional efficiencies, the centralised EU procedure is a launch route that can no longer be ignored. For pharmaceutical manufacturers it brings key opportunities to synergize Rx portfolios and realize the incremental value of potentially under-utilized assets; for OTC firms comes the chance to build a very large brand – efficiently, effectively and fast. Success, however, is not guaranteed. There may be one process but there are still 28 disparate markets each with their own different levels of pharmacy supervision, advertising regulations, consumer cultures, pharmacy channel mix and national regulatory capabilities.And with one process comes one chance to get it right.Assessing and understanding the complex dynamics – early - will be key to determining switch feasibility and maximizing commercial potential. LOOKING AHEAD Going forward, the prospects for the OTC market in Europe remain good as it continues to outpace performance in the pharmaceutical sector.There are powerful market forces - new players, new markets, new regulatory provisions and new channels of OTC distribution – reshaping the landscape that cannot be ignored. However, the picture is mixed, competition is growing and the market is still on the move. Success will require a very different business model based on a deep understanding of the market opportunities, the evolving channel situation, the competitive scenario and more demanding consumer needs. Companies on all sides who are entering, re-entering or expanding in OTC will need to think carefully about the business models they want to adopt, the key stakeholders they need to address and make sure they are focusing their resources in the most effective and efficient way to generate sustainable business growth. Germany France Russia Italy UK Poland Spain Belgium Switzerland Czech Rep Greece Netherlands Hungary Sweden Portugal Denmark Norway Pharmacy Drugstore Supermarkets Convenience /Gas Mail-Order FIGURE 11: MANY DIFFERENT CHANNEL STRATEGIES NEED TO BE COORDINATED ACROSS EUROPE • Maximising commercial partnerships, by leveraging growth opportunities • Key account management, with a clear business plan for each brand within each category and major retailer chain • Consumer and trade customer investment allocation, understanding and assessing the optimum balance between consumer and trade customer promotional resources NEW COMPLEXITIES, NEW IMPERATIVES Opportunities to enter and expand in the European OTC market have for some years included Rx-to-OTC switching, an important driver of growth in the sector and the source of many leading brands in the region. Historically approached on a local basis and dogged by varied regulatory acceptance in each individual market, the power of switch has now been transformed with the new, centralized EU application procedure. Not only does this potentially offer access to all EU countries in a single application, it also opens up a wealth of opportunities for growing new categories in the pan-European OTC arena. • Denmark – Sales of GSL products are permitted in specific “OTC Outlet” which are linked to a pharmacy but usually located within another store. • Spain – Internet sales permitted after pharmacist consultation.
  • 8.
    OTCCHWP1110 IMS HEALTH® CORPORATE HEADQUARTERS IMSHealth 901 Main Avenue, Suite 612 Norwalk, CT 06851–1187 USA Tel: 203.845.5200 REGIONAL HEADQUARTERS The Americas Plymouth Meeting Executive Campus 660 W. Germantown Pike Plymouth Meeting, PA 19462-0905 USA Tel: 610.834.5000 EUROPE / MIDDLE EAST / AFRICA 7 Harewood Avenue London NW1 6JB UK Tel: +44 (0)20 3075 5888 www.imshealth.com ASIA PACIFIC 10 Hoe Chiang Road Keppel Towers #23-01/02 Singapore 089315 Tel: 65 6227 3006 JAPAN Toranomon Towers 4-1-28 Toranomon Minato-ku, Tokyo 105-0001 Japan ABOUT IMS Operating in more than 100 countries, IMS Health is the world’s leading provider of market intelligence to the pharmaceutical and healthcare industries. With more than 55 years of industry experience, IMS Health offers leading-edge market intelligence products and services that are integral to clients’ day-to-day operations, including product and portfolio management capabilities; commercial effectiveness innovations; managed care and consumer health offerings; and consulting and services solutions that improve productivity and the delivery of quality healthcare worldwide. Additional information is available at http://www.imshealth.com ©2010 IMS Health Incorporated or its affiliates. All Rights Reserved.