Download as PDF, PPTX


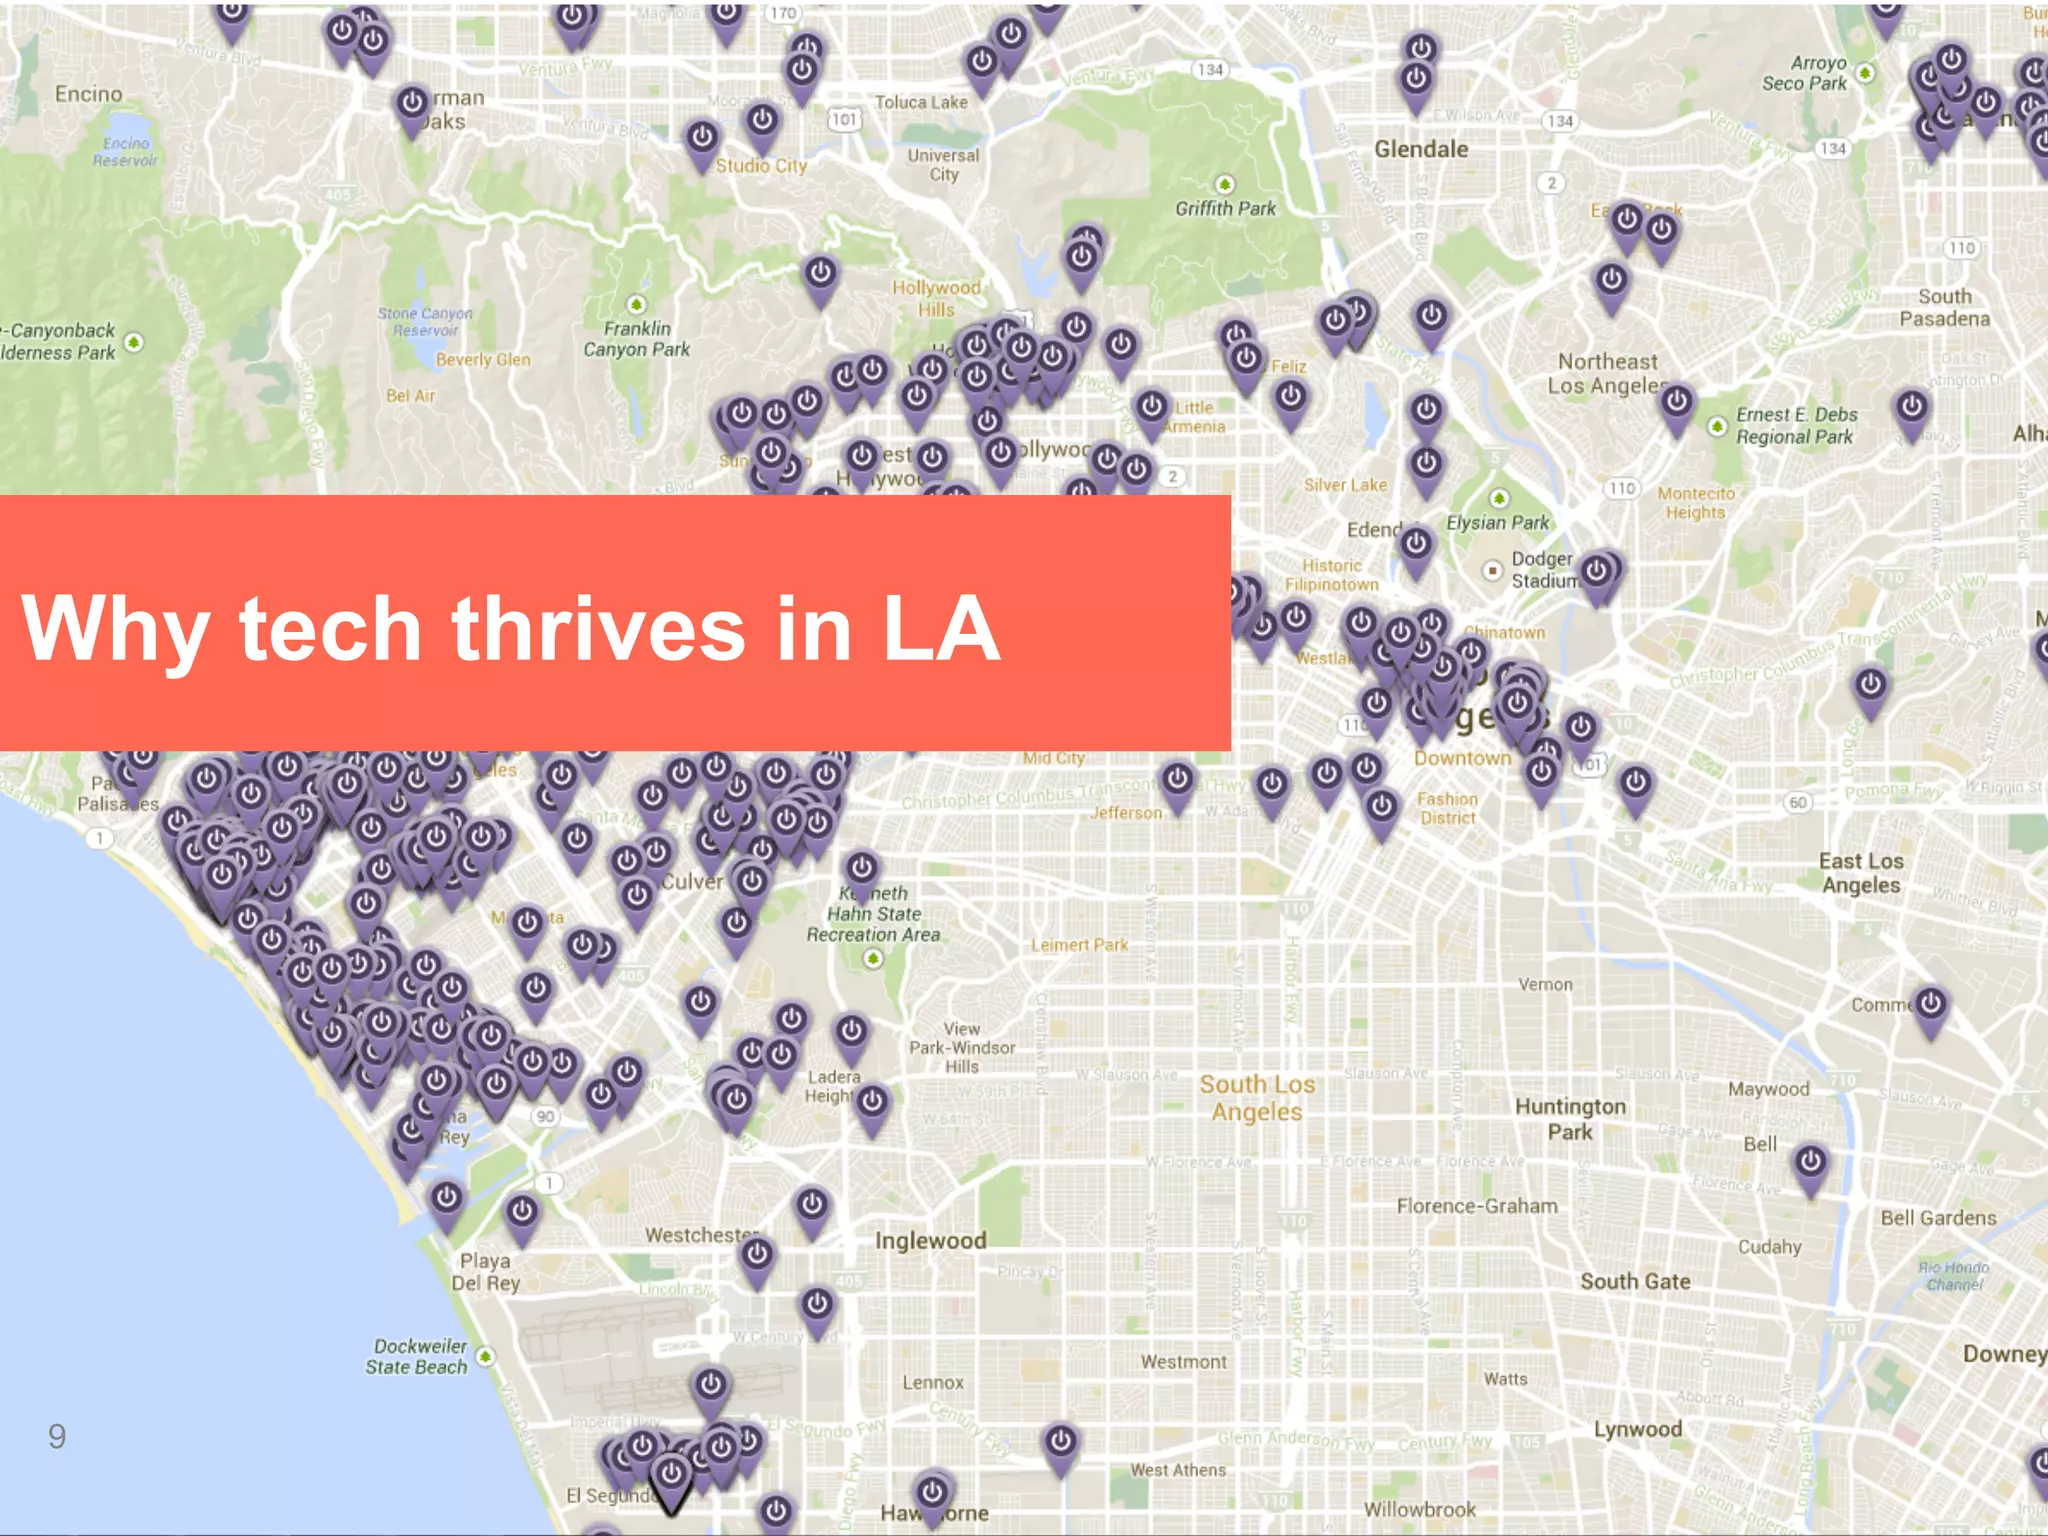


The Los Angeles technology market is one of the largest and fastest growing in the US. It is the third largest tech ecosystem and has grown 4 times faster than the national average in recent years. Capital investment in LA startups has also increased significantly, with over $1.5 billion invested in 2013. LA has a strong talent base and is a leader in the key industries of the future, particularly content, commerce, and communication. The future looks bright for continued growth and success of the LA tech sector.


![[BDD 2025 - Artificial Intelligence] AI for the Underdogs: Innovation for Sma...](https://cdn.slidesharecdn.com/ss_thumbnails/ai-aifortheunderdogsinnovationforsmallbusinesses-251124030839-72a599a4-thumbnail.jpg?width=640&height=640&fit=bounds)


![[BDD 2025 - Mobile Development] Crafting Immersive UI with E2E and AGSL Shade...](https://cdn.slidesharecdn.com/ss_thumbnails/md-craftingimmersiveuiwithe2eandagslshaderveronicaputrianggraini-251124030840-0c677f44-thumbnail.jpg?width=640&height=640&fit=bounds)

![[BDD 2025 - Artificial Intelligence] Building AI Systems That Users (and Comp...](https://cdn.slidesharecdn.com/ss_thumbnails/ai-buildingaisystemsthatusersandcompanieslove-251124030845-038f7732-thumbnail.jpg?width=640&height=640&fit=bounds)


![[DevFest Strasbourg 2025] - NodeJs Can do that !!](https://cdn.slidesharecdn.com/ss_thumbnails/devfeststrasbourg2025-nodejscandothat-251127142731-da65b6fd-thumbnail.jpg?width=640&height=640&fit=bounds)


