TIP1 - Overview of C/C++ Debugging/Tracing/Profiling Tools
115 likes11,460 views

This document provides an overview and comparison of various tools for debugging, profiling, and tracing C/C++ programs on Linux. It discusses concepts and implementations of debugging tools like gdb and Valgrind, profiling tools like gprof and perf, and tracing tools like strace, SystemTap, and LTTng. For each tool, it provides examples of common use cases and highlights strengths and limitations. The document aims to help developers select the appropriate tool based on their specific needs such as debugging memory errors, profiling performance bottlenecks, or tracing system calls.


TIP1 - Overview of C/C++ Debugging/Tracing/Profiling Tools
- 1. TIP1: Linux Dev Tools/Tips for C/C++ Debugging/Tracing/Profiling
- 2. Agenda ● Preface ● Concepts ● Tools for C/C++ ○ Debugging ○ Tracing ○ Profiling ● References ● Postscript
- 3. Preface ● What does our world look like? "There is no remembrance of former things; neither shall there be any remembrance of things that are to come with those that shall come after." -- Ecclesiastes 1:11 We want/need/have to change this... TIP = Technology Inheritance Program
- 4. Concepts ● Debugging - Find the cause of unexpected program behavior, and fix it. ● Profiling - Analyze program runtime behavior, provide statistical conclusions on key measurements (speed/resource/...). ● Tracing - Temporally record program runtime behavior, provide data for further debugging/profiling. All debugging/profiling/tracing tools depend on some kind of instrumentation mechanism, either statical or dynamical.
- 5. Debugging tools for C/C++
- 6. Debugging Tools Implementation ● Breakpoint support ○ Hardware breakpoint ■ DR0~7 regs on Intel CPU ○ Software breakpoint ■ INT3 instruction on x86/x86_64 ■ raise SIGTRAP signal for portable breakpoint ○ Virtual Machine Interpreter ■ Interpret instructions instead of execute it directly ● Linux user-space debug infrastructure ○ ptrace syscall
- 7. Debugging Tools ● gdb - General-purpose debugger ○ ptrace-based ○ Both hw/sw breakpoints supported ○ Reverse executing feature in 7.x version ■ Save reg/mem op before each instr executed, heavy but very handy ○ Usecases: ■ Standalone debug ■ gdb --args <exec> <arg1> <...> ■ Analyze core ■ gdb <exec> <core> ■ Attach to existing process ■ gdb <exec> <pid> ○ Many resources, search and learn:)
- 8. Debugging Tools ● Valgrind family ○ valgrind is an instruction interpreter/vm framework ○ Impossible to attach to a running process :( ○ Useful plugin: ■ memcheck ■ Memory error detector ■ massif ■ Heap usage profiler ■ helgrind ■ Thread error detector ■ DRD ■ (another) Thread error detector ■ ptrcheck(SGCheck) ■ Stack/global array overrun detector
- 9. Debugging Tools ● memcheck usecases: ○ Check memory error for all process in hierarchy: ■ valgrind --tool=memcheck --leak-check=full --leak- resolution=high --track-origins=yes --trace-children=yes -- log-file=./result.log <exec> ○ See flags specified to memchek plugin: ■ valgrind --tool=memcheck --help
- 10. Debugging Tools ● massif usecases: ○ Stats heap and stack usage during a program's life: ■ valgrind --tool=massif --stacks=yes <exec> ■ ms_print massif.* ○ In the output of ms_print: ■ ':' means normal snapshot ■ '@' means detail snapshot ■ '#' means peak snapshot in all
- 11. Debugging Tools ● helgrind usecase: ○ Check POSIX thread API misuse/inconsistent lock order/data races: ■ valgrind --tool=helgrind <exec> ● DRD usecase: ○ Check POSIX thread API misuse/data races/lock contention, and tracing all mutex activities: ■ valgrind --tool=drd --trace-mutex=yes <exec> ● ptrcheck usecase: ○ Check stack/global array overrun: ■ valgrind --tool=exp-ptrcheck <exec>
- 12. Debugging Tools ● Intel Inspect XE (Commercial) ○ Cross-platform proprietary debugging tools ○ Both GUI/CLI usage supported ○ Memory/thread error detector ○ Free for non-commercial use ○ Included in Intel Parallel Studio suite, standalone download available ○ Catch up very slow on new hardwares (e.g. i7...) ○ Works not well on Linux platform, other platform not tested...
- 13. Debugging Guideline ● Generally speaking, all programs should pass Valgrind memcheck/ptrcheck checking, to eliminate most of the memory errors. ● Multithread programs should pass Valgrind helgrind/drd checking, to eliminate common racing errors. ● Valgrind massif can be used to track down the origin of unexpected heap allocation. ● gdb can be used to manually track down logical bugs in the code. ● Multiprocess/thread programs don't fit gdb well, most of the time tracing the program is much easier/faster to find the source of a bug than manually gdb debugging.
- 14. Profiling tools for C/C++
- 15. Profiling Tools Implementation ● Event based profiling ○ Add hook for specified event, count event occuring times ● Sampling based profiling ○ Make a repeating trigger for sampling ○ Record instruction counter and call stack when trigger'd ○ Generate statistically result based on record data NOTE: General profiling tools can NOT reveal sleeping (interruptible blocking, lock wait, etc.) or I/O blocking (non- interruptible blocking) costs! But these are usually the main throttle to the intuitive runtime performance.
- 16. Profiling Tools (event based) ● gcov ○ A coverage testing tool, but can also be used as a line- count profiling tool (user-space only) ○ Need statistically instrument target program, compiling with one of the following gcc flags: ■ --coverage ■ -fprofile-arcs -ftest-coverage ○ When program exits normally, *.gcda/gcno file will be generated ○ Usecase: ■ gcc --coverage x.c -ox ■ gcov x.c # gen x.c.gcov ■ less x.c.gcov
- 17. Profiling Tools (event based) Behind the scene of gcov: ● -ftest-coverage makes compiler generating *.gcno files, which contains infos to reconstruct basic block graph and assign source codes to blocks (used by gcov). ● -fprofile-arcs makes compiler injecting codes adding counters associated with each source code line, and codes that dump out *.gcda files when the program exits. ● See: ○ gcc -S x.c -o x1.s ○ gcc -S --coverage x.c -o x2.s ○ vimdiff *.s
- 18. Profiling Tools (event based) ● lcov ○ Graphical gcov front-end ○ Generate beautiful coverage report in HTML format ○ Usecase: ■ Assuming the source is placed in app/x.c ■ cd app ■ gcc --coverage x.c -ox ■ ./x ■ lcov -d . -c -o x.info ■ genhtml -o report x.info ■ See app/report/index.html for report
- 19. Profiling Tools (event based) ● valgrind (callgrind) ○ Instruction level profiler, with cool GUI frontend kcachegrind ○ Cache/branch prediction profiling and annotated source supported ■ Add -g compiler flag if annotated source is wanted ○ Usecase: ■ gcc -g x.c -ox ■ valgrind --tool=callgrind --dump-instr=yes --cache- sim=yes --branch-sim=yes ./x ■ kcachegrind callgrind.*
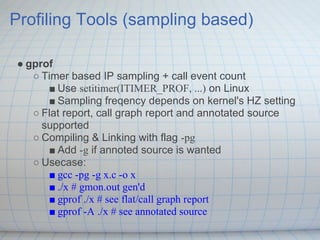
- 20. Profiling Tools (sampling based) ● gprof ○ Timer based IP sampling + call event count ■ Use setitimer(ITIMER_PROF, ...) on Linux ■ Sampling freqency depends on kernel's HZ setting ○ Flat report, call graph report and annotated source supported ○ Compiling & Linking with flag -pg ■ Add -g if annoted source is wanted ○ Usecase: ■ gcc -pg -g x.c -o x ■ ./x # gmon.out gen'd ■ gprof ./x # see flat/call graph report ■ gprof -A ./x # see annotated source
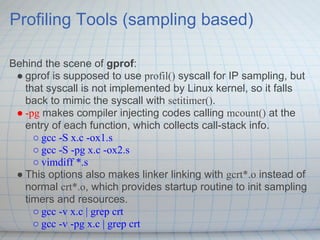
- 21. Profiling Tools (sampling based) Behind the scene of gprof: ● gprof is supposed to use profil() syscall for IP sampling, but that syscall is not implemented by Linux kernel, so it falls back to mimic the syscall with setitimer(). ● -pg makes compiler injecting codes calling mcount() at the entry of each function, which collects call-stack info. ○ gcc -S x.c -ox1.s ○ gcc -S -pg x.c -ox2.s ○ vimdiff *.s ● This options also makes linker linking with gcrt*.o instead of normal crt*.o, which provides startup routine to init sampling timers and resources. ○ gcc -v x.c | grep crt ○ gcc -v -pg x.c | grep crt
- 22. Profiling Tools (sampling based) ● google-perftools (CPU profiler) ○ Timer based call-stack sampling ■ Use setitimer(ITIMER_PROF, ...) on Linux ■ Set sampling freqency through env var PROFILEFREQUENCY ○ Linked-in usage (NOTE: profiler symbols must be referenced in your code, otherwise the dependency of profiler shared library will be eliminated!) ■ gcc -g x.c -ox -lprofiler ■ CPUPROFILE=/tmp/xxx ./x ○ Preload usage: ■ LD_PRELOAD=/usr/local/lib/libprofiler.so CPUPROFILE=/tmp/xxx ./x ○ Show report: pprof --text ./x /tmp/xxx
- 23. Profiling Tools (sampling based) ● oprofile ○ Support timer/interrupt/PMC/tracepoint based sampling ■ PMC = PerforMance Counter ○ Capable of doing system-wide profiling ○ Deprecated in prefer of perf on kernel > 2.6.26(?) ○ Usecase: ■ sudo opcontrol --init # load oprofile module ■ sudo opcontrol -s ■ ./x ■ sudo opcontrol -h ■ sudo opreport # show report ■ sudo opannotate -s # show annotated src
- 24. Profiling Tools (sampling based) ● perf ○ Available on kernel >= 2.6.26(?) ○ PMC frontend released along with kernel itself ○ Support PMC/tracepoint based sampling ○ Capable of doing system-wide profiling, sampling events trace can also be output ○ Usecase: ■ sudo perf record -a -g -- ./x ■ sudo perf report # show prof report ■ sudo perf annotate # show annotated src
- 25. Profiling Tools (sampling based) ● Intel VTune Amplifier XE (Commercial) ○ PMC/timer based sampling, support GUI/CLI ○ System-wide profiling supported, has locks & waits analysis ○ Use Pin for instrumentation ○ CLI works well on Linux, GUI not stable ■ amplxe-cl -collect hotspots ./x ■ amplxe-cl -report hotspots -r rxxxxhs ● AMD CodeAnalyst (Commercial) ○ oprofile based, GUI only ○ System-wide profiling supported ○ Provide much more events on AMD CPUs ○ Works not well on Linux
- 26. Profiling Guideline ● Determine target program performance throttle before actual profiling (time helps) ○ sys time + user time ~ wall clock time ■ sys time >> user time: reduce syscalls / user-kernel space profiling ■ user time >> sys time: user space profiling ○ sys time + user time << wall clock time ■ Don't use general profiling tool, consider user space tracing ● Analysis profiling result hierarchically, starting from outter scope first, don't dive into details too early. ● Spot performance throttle one by one. First deal with the biggest known throttle, then profiling again and find the next throttle.
- 27. Tracing tools for C/C++
- 28. Tracing Tools Implementation ● Decouple event recording and exporting: ring buffer ● User-space tracing ○ Intrusive ■ Call tracing API manually, need recompiling code ○ Non-intrusive ■ ptrace syscall ■ GNU dynamic linker LD_AUDIT ■ utrace-patched kernel ● Kernel-space tracing ○ Dynamical mechanism ■ kprobes / jprobes / kretprobes: trap/short-jmp instr ○ Statical mechanism ■ tracepoints: manually inserted conditional jump ■ ftrace (kernel >= 2.6.26): gcc mcount utilization
- 29. Tracing Tools (ptrace based) ● strace ○ Trace user program's syscalls ○ Support existing process tracing ■ Watch out ptrace protection patch! (for nonroot) /proc/sys/kernel/yama/ptrace_scope ○ Works well with multithread programs ○ Usecase: ■ strace -f -i -tt -T -v -s 1024 -C -o trace.out ./x ■ See man strace for detail description
- 30. Tracing Tools (ptrace based) ● ltrace ○ Trace user program's dynamic library calls ○ Can also trace syscalls, but can't parse their args as strace did ○ Neither library->library nor dlopen'd library call trace supported ○ Can NOT work with multithread programs ○ Usecase: ■ ltrace -C -f -i -n4 -s1024 -S -tt -T ./x ■ See man ltrace for detail description
- 31. Tracing Tools (ptrace based) ● Ptrace-based tracing shortcoming: ○ Heavy overhead, at least 2 ctx sw + 2 syscall plus signal transit overheads per tracepoint, very slow on large tracepoint set; ○ init(1) can not be traced; ○ Processes can not be ptraced by multiple tracers; ○ Ptrace affects the semantics of traced processes: ■ Original parent will not be notified when its child was ptraced and stopped (see notes in man 2 ptrace) ■ The overhead of ptrace will lower the num of concurrent running threads. Race conditions sensitive to timings may disappear due to this, resulting a Heisenberg problem.
- 32. Tracing Tools (LD_AUDIT based) ● latrace ○ Trace user program's dynamic library calls ○ Can NOT trace existing process ○ Use callback function running in target process instead of ptrace signals, much lower overhead ○ Works well with multithread programs ○ Usecase: ■ latrace -SAD -o trace.out ./x ■ See man latrace for detail description
- 33. Tracing Tools (ftrace based) ● trace-cmd ○ Available on kernel >= 2.6.26 ○ CLI frontend for ftrace framework ○ System-wide kernel tracer, no user space event available (except for events like context switching, scheduling etc., but no call-site info) ○ Usecase: ■ sudo trace-cmd record -e all -p function_graph -F ./x ■ trace-cmd report
- 34. Tracing Tools (ftrace based) ● kernelshark ○ GUI viewer for trace-cmd result ○ Usecase: ■ sudo trace-cmd record -e all -p function_graph -F ./x ■ kernelshark
- 35. Tracing Tools (customized) ● SystemTap ○ Linux community's reply to Solaris DTrace ○ Scriptable framework to utilize kprobes/tracepoints ○ User space tracing needs utrace-patched kernel, Redhat distros (RHEL/CentOS/Fedora) all comes with such kernels ○ Usecase: ■ stap -e 'probe syscall.* {println(thread_indent(4),"->", probefunc())} probe syscall.*.return {println(thread_indent (-4), "<-", probefunc())}' -c ./x
- 36. Tracing Tools (customized) ● LTTng 2.0 ○ Rewrite of LTTng 0.9.x, no need to patch kernel anymore, lighter weight compare to SystemTap ○ User space tracing is done by inserting statical tracepoint into user program (not compatible with SystemTap/DTrace probes yet...) ○ Usage: ■ sudo lttng create sess1 ■ sudo lttng enable-event -a -k ■ sudo lttng enable-event -a -u ■ sudo lttng start ■ ./x ■ sudo lttng stop ■ babeltrace ~/lttng/sess1*
- 37. Tracing Tools (customized) ● DTrace ○ Origins from Sun Solaris, adopted by MacOS/FreeBSD/Oracle Unbreakable Linux ○ Scriptable framework, light weight tracing overhead ○ Capable of kernel and user space joint tracing (user space tracing needs inserting statical tracepoints) ○ Handy tracing multiple languages / apps: ■ Java(Sun) / PHP(Zend) / Javascript(Firefox) / CPython / CRuby / MySQL / PostgreSQL / Erlang (DTrace fork) ○ Usecase: see http://dtracehol.com/
- 38. Tracing Guideline ● Be warned! Tracing needs invovled efforts and solid background on Linux kernel. Learn more and deeper about how the system working first! ● Use SystemTap for kernel/user space tracing on Redhat family distros (RHEL/CentOS/Fedora) or utrace-patched kernels ● Use DTrace for kernel/user space tracing on MacOS/FreeBSD ● User space only tracing can be partially done by strace/ltrace ● LTTng 2.0 can do kernel/user space tracing if you can insert statical tracepoints in your code, and it does not need patching your kernel
- 39. Practical Tips
- 40. Other useful technics ● gcc -finstrument-functions ○ https://github.com/agentzh/dodo/tree/master/utils/dodo- hook ● LD_PRELOAD crash signal handler ○ https://github.com/chaoslawful/phoenix-nginx- module/tree/master/misc/dbg_jit ● Add signal handler to normally output gprof/gcov result for a interrupted program See examples at https://github.com/chaoslawful/TIP
- 41. References ● Overview ○ Linux Instrumentation ○ http://lwn.net/Kernel/Index/ ● Tracing ○ 玩转 utrace ○ utrace documentation file ○ Introducing utrace ○ Playing with ptrace, Part I ○ Playing with ptrace, Part II ○ SystemTap/DTrace/LTTng/perf Comparison ○ ftrace 简介 ○ Solaris Dynamic Tracing Guide ○ DTrace for Linux ○ Observing and Optimizing your Application with DTrace
- 42. References ● Tracing ○ SystemTap Beginner's Guide ○ SystemTap Language Reference ○ SystemTap Tapset Reference ○ LTTng recommended bundles ○ LTTng Ubuntu daily PPA ○ An introduction to KProbes ○ 使用KProbes调试内核 ○ Tracing: no shortage of options ○ Uprobes: 11th time is the charm? ○ Ptrace, Utrace, Uprobes: Lightweight, Dynamic Tracing for User Apps ○ LTTng Tracing Book
- 43. References ● Profiling & Debugging ○ google-perftools Profiling heap usage ○ google-perftools CPU Profiler ○ Valgrind User Manual ○ OProfile Manual ○ Debugging with GDB ○ GDB Internals Manual ○ Implementation of GProf ○ Gcov Data Files
- 44. Postscript "The important thing is not to stop questioning; never lose a holy curiosity." -- Albert Einstein