SlideShare a Scribd company logo
Troubleshooting
Real
Production
Problems
Ram Lakshmanan
Architect: GCeasy.io, fastThread.io,HeapHero.io
https://blog.fastthread.io/2018/12/13/how-to-troubleshoot-cpu-problems/
Troubleshooting C P U spike
Step 1:Confirm
Don‘t trust anyone
‘top’ tool is your good friend
Step 2: Identify Threads
Example:
top -H -p31294
top –H –p {pid}
Step 3: Capture thread d u m p s
https://blog.fastthread.io/2016/06/06/how-to-take-thread-dumps-7-options/
03
jVisualVM
JDK tool. Now Open
source. GUI based option.
02
kill-3
Kill -3 <pid>
Useful whenonly JRE is installed
01
jstack (since Java 5)
jstack -l<pid>>
/tmp/threadDump.txt
07
APM Tools
Few APM Tools does
provide this support
06
ThreadMXBean
Programmatic way to capture
thread dumps
04
JMC
JDK tool. Now Open
source. GUI based option.
08
J c m d (since Java 7)
jcmd <pid> Thread.print>
/tmp/threadDump.txt
05
Windows (Ctrl +
Break)
Helpful during development
phase
2019-02-2617:13:23
"Reconnection-1" prio=10 tid=0x00007f0442e10800 nid=0x112a waiting on condition
[0x00007f042f719000]
java.lang.Thread.State: WAITING (parking)
at sun.misc.Unsafe.park(Native Method)
- parking to wait for <0x007b3953a98> (a java.util.concurrent.locks.AbstractQueuedSynchr) at
java.util.concurrent.locks.LockSupport.park(LockSupport.java:186)at java.lang.Thread.run(Thread.java:722)
:
:
1
2
3
1 Timestamp at which thread dump was triggered
2 JVM Versioninfo
3 Thread Details-<<detailsin following slides>>
Anatomy of thread d u m p
Full thread dump Java HotSpot(TM) 64-Bit Server VM (23.7-b01 mixed mode):
"InvoiceThread-A996" prio=10 tid=0x00002b7cfc6fb000 nid=0x4479 runnable [0x00002b7d17ab8000] java.lang.Thread.State:
RUNNABLE
at com.buggycompany.rt.util.ItinerarySegmentProcessor.setConnectingFlight(ItinerarySegmentProcessor.java:380) at
com.buggycompany.rt.util.ItinerarySegmentProcessor.processTripType0(ItinerarySegmentProcessor.java:366)
at com.buggycompany.rt.util.ItinerarySegmentProcessor.processItineraryByTripType(ItinerarySegmentProcessor.java:254) at
com.buggycompany.rt.util.ItinerarySegmentProcessor.templateMethod(ItinerarySegmentProcessor.java:399)
at com.buggycompany.qc.gds.InvoiceGeneratedFacade.readTicketImage(InvoiceGeneratedFacade.java:252) at
com.buggycompany.qc.gds.InvoiceGeneratedFacade.doOrchestrate(InvoiceGeneratedFacade.java:151)
at com.buggycompany.framework.gdstask.BaseGDSFacade.orchestrate(BaseGDSFacade.java:32)
at com.buggycompany.framework.gdstask.BaseGDSFacade.doWork(BaseGDSFacade.java:22)
at com.buggycompany.framework.concurrent.BuggycompanyCallable.call(buggycompanyCallable.java:80) at
java.util.concurrent.FutureTask$Sync.innerRun(FutureTask.java:334)
at java.util.concurrent.FutureTask.run(FutureTask.java:166)
at java.util.concurrent.ThreadPoolExecutor.runWorker(ThreadPoolExecutor.java:1145) at
java.util.concurrent.ThreadPoolExecutor$Worker.run(ThreadPoolExecutor.java:615) at java.lang.Thread.run(Thread.java:722)
"InvoiceThread-A996" prio=10 tid=0x00002b7cfc6fb000 nid=0x4479 runnable
[0x00002b7d17ab8000]
java.lang.Thread.State: RUNNABLE
at com.buggycompany.rt.util.ItinerarySegmentProcessor.setConnectingFlight(ItinerarySegmentProcessor.java:380) at
com.buggycompany.rt.util.ItinerarySegmentProcessor.processTripType0(ItinerarySegmentProcessor.java:366)
at com.buggycompany.rt.util.ItinerarySegmentProcessor.processItineraryByTripType(ItinerarySegmentProcessor.java:254) at
com.buggycompany.rt.util.ItinerarySegmentProcessor.templateMethod(ItinerarySegmentProcessor.java:399)
at com.buggycompany.qc.gds.InvoiceGeneratedFacade.readTicketImage(InvoiceGeneratedFacade.java:252) at
com.buggycompany.qc.gds.InvoiceGeneratedFacade.doOrchestrate(InvoiceGeneratedFacade.java:151)
at com.buggycompany.framework.gdstask.BaseGDSFacade.orchestrate(BaseGDSFacade.java:32) at
com.buggycompany.framework.gdstask.BaseGDSFacade.doWork(BaseGDSFacade.java:22)
at com.buggycompany.framework.concurrent.BuggycompanyCallable.call(buggycompanyCallable.java:80) at
java.util.concurrent.FutureTask$Sync.innerRun(FutureTask.java:334)
at java.util.concurrent.FutureTask.run(FutureTask.java:166)
at java.util.concurrent.ThreadPoolExecutor.runWorker(ThreadPoolExecutor.java:1145) at
java.util.concurrent.ThreadPoolExecutor$Worker.run(ThreadPoolExecutor.java:615) at
java.lang.Thread.run(Thread.java:722)
1 2 3 4 5
6
7
1 Thread Name -InvoiceThread-A996
2 Priority -Can have values from 1to10
3 Thread Id - 0x00002b7cfc6fb000 – Unique ID assigned by JVM. It's returned by calling the Thread.getId() method.
4
5
6
7
Native Id - 0x4479 - This ID is highly platform dependent. On Linux, it's the pid of the thread. On Windows, it's simply the OS-level
thread a process. On Mac OS X, it is said to be the native pthread_t value.
Address space - 0x00002b7d17ab8000 -
Thread State - RUNNABLE
Stack trace -
6 thread states
RUNNABLE
TERMINATED
N E W WAITING03
02
01
06 TIMED_WAITING
Thread.sleep(10);
public void synchronized getData() {
makeDBCall();
}
BLOCKED04
Thread 1:Runnable
05
wait();
Thread12::RBuLnOnCaKbElDe
Step 4: Identify lines of code causing C P U spike
Thread Ids: 31306, 31307, 31308
High CPU consuming Threads Ids reported in ‘top –H’.
Let’s look up these thread Ids in Thread dump
HexaDecimal equivalent:
•31306 7a4a
•31307 7a4b
•31308 7a4c
1: package com.buggyapp.cpuspike;
2:
3: /**
4: *
5: * @author Test User 6: */
7: public class Object1 { 8:
public static void execute() {
while (true) {
doSomething();
}
}
public static void doSomething() {
}
9:
10:
11:
12:
13:
14:
15:
16:
17:
18:
19:
20: }
Source code
‘Free’ Thread d u m p analysis tools
Freely available Thread dump analysis tools
03
IBM Thread & Monitor analyzer
https://developer.ibm.com/j
avasdk/tools/
02
Samurai
http://samuraism.jp/samurai/e
n/index.html
01
FastThread
http://fastThread.io/
04
Visual VM
https://visualvm.github.io/
C P U spike in a major trading application
Troubleshooting unresponsive app
Unresponsiveness in a B 2 B Travel application
Process 70% of N. America oversease Leisure travel ticketing
Troubleshooting OutOfMemoryError
Unable to create new native thread
Major financial institution in N. America
Thread d u m p troubleshooting pattern: RSI
https://map.tinyurl.com/yxho6lan
Java Heap +metaspace
Physical memory
Process-
1
Process-
2
Key: Threads are created outside heap,
metspace
threads
Physical memory
Solution:
1.Fix thread leak
2.Increase the Thread Limits Set at
Operating System(ulimit –u)
3.Reduce Java Heap Size
4.Kills other processes
5.Increase physical memory size
6.Reduce thread stack size (-Xss).
Note: can cause StackOverflowError
OOM: Unable to create n e w native thread
8 types - OutOfMemoryError
Java heap space
G C overhead limit exceeded
Requested array size exceed VM limit
Permgen space
01
02
03
04
Metaspace
Unable to create new native thread
Kill process or sacrifice child
reason stack_trace_with_native method
05
06
07
08
https://blog.gceasy.io/2015/09/25/outofmemoryerror-beautiful-1-page-
document/
java.lang.OutOfMemoryError: <type>
• https://tinyurl.com/yywdmvyy
• RSI Pattern – Same pattern, different problem.
Troubleshooting unresponsive app
Thread d u m p analysis Patterns
https://blog.fastthread.io/category/thread-dump-patterns/
Leprechaun PatternTreadmill PatternRSI Pattern
Athlete PatternTraffic J a m PatternAll Roads leads to
Rome Pattern
few more …Atherosclerosis Pattern Several Scavengers Pattern
Troubleshooting Memory
problems
Enable G C L o g s (always)
Till Java 8:
-XX:+PrintGCDetails -XX:+PrintGCDateStamps -Xloggc:<file-path>
From Java 9:
-Xlog:gc*:file=<file-path>
‘Free’ G C L o g analysis tools
Freely available Garbage collection log analysis tools
03
IBM GC & Memory visualizer
https://developer.ibm.com/j
avasdk/tools/
02
GC Viewer
https://github.com/chewie
b ug/GCViewer
01
GCeasy
http://gceasy.io/
05
Google Garbage cat (cms)
https://code.google.com/ar
chive/a/eclipselabs.org/p/g
arbagecat
04
HP Jmeter
https://h20392.www2.hpe.c
o
m/portal/swdepot/displayPr
oductInfo.do?productNumb
er=HPJMETER
Heap usage graph
W h a t is your observation?
Memory Problem
Corresponding – Reclaimed bytes chart
H o w to diagnose memor y leak?
Capture heap d u m p s
jmap -dump:live,file=<file-path> <pid>
Example: jmap -dump:live,file=/opt/tmp/AddressBook-heapdump.bin37320
-XX:+HeapDumpOnOutOfMemoryError -XX:HeapDumpPath=/logs/heapdump
Eclipse MAT, HeapHero
Two good tools to analyze memory leaks
Capture heap d u m p s
https://blog.fastthread.io/2016/06/06/how-to-take-thread-dumps-7-options/
03
jVisualVM
JDK tool. Now Open
source. GUI based option.
02
HeapDumpOnOutOfMemoryError
-XX:+HeapDumpOnOutOfMemoryError
-XX:HeapDumpPath=<file-path>
01
jmap (since Java 5)
jmap -
dump:live,file=<file-
path> <pid>
06
APM Tools
Few APM Tools does
provide this support
05
ThreadMXBean
Programmatic way to capture
thread dumps
04
IBM administrative console
If you are using WAS, this
option can be used
07
Jcmd (since Java 7)
jcmd <pid>
GC.heap_dump
<file-path>
Micro-metrics
https://blog.gceasy.io/2019/03/13/micrometrics-to-forecast-application-performance/
Macro-Metric s
Can’t forecast scalability, availability, performance problems
C P U
RESPONSE
TIME
MEMO RY
Micro-metrics: Early Indicators
OutOfMemoryError happens here
Repeated Full GCs happens here
Few more…
TCP/IP States, Hosts count, IOPS,..
File Descriptors
File descriptor is a handle to access: File, Pipe,
Network Connections. If count grows it’s a lead
indicator that application isn’t closing resources
properly.
Thread States
If BLOCKED thread state count grows, it’s
an early indication that your application has
potential to become unresponsive
GC Throughput
Amount time
application spends
in processing
customer
transactions vs
amount of time
application spend in
doing GC
Object Reclamation rate
If number of objects created in
unit time
GC Latency
If pause time
starts to
increase,
then it’s an
indication that
app is
suffering from
memory
problems
W h a t are Micrometrics?
https://blog.gceasy.io/2019/03/13/micrometrics-to-forecast-application-performance/
right data @ right time
G C L o g
netstat vmstat
Thread D u m p s
d m esg
Heap D u m p s
W h a t data to capture?
ps
top -H
Disk Usage
top
IBM Script:
https://map.tinyurl.com/y4gz6o7q
Captures all of the above artifacts
Thank you m y friends!
R a m Lakshmanan
ram@tier1ap p .com
@tier1app
https://www.linkedin.com/company/gceasy

More Related Content

What's hot (20)

PPTX
Become a GC Hero
Tier1app
 
PPTX
16 artifacts to capture when there is a production problem
Tier1 app
 
PPTX
7 jvm-arguments-Confoo
Tier1 app
 
PPTX
7 jvm-arguments-v1
Tier1 app
 
PPTX
Lets crash-applications
Tier1 app
 
PPTX
Lets crash-applications
Tier1 app
 
PPTX
Don't dump thread dumps
Tier1app
 
PPTX
Modern Engineer’s Troubleshooting Tools, Techniques & Tricks at Confoo 2018
Tier1app
 
PPTX
Micrometrics to forecast performance tsunamis
Tier1app
 
PPTX
Gc crash course (1)
Tier1 app
 
PPTX
Accelerating Incident Response To Production Outages
Tier1 app
 
PPT
Jdk Tools For Performance Diagnostics
Dror Bereznitsky
 
PDF
So You Want To Write Your Own Benchmark
Dror Bereznitsky
 
PDF
Доклад Антона Поварова "Go in Badoo" с Golang Meetup
Badoo Development
 
PDF
Refactoring for testability c++
Dimitrios Platis
 
PPTX
Pick diamonds from garbage
Tier1 App
 
PPTX
Thread dump troubleshooting
Jerry Chan
 
PDF
Nvidia® cuda™ 5.0 Sample Evaluation Result Part 1
Yukio Saito
 
PDF
Java Heap Dump Analysis Primer
Kyle Hodgson
 
PDF
Java In-Process Caching - Performance, Progress and Pittfalls
cruftex
 
Become a GC Hero
Tier1app
 
16 artifacts to capture when there is a production problem
Tier1 app
 
7 jvm-arguments-Confoo
Tier1 app
 
7 jvm-arguments-v1
Tier1 app
 
Lets crash-applications
Tier1 app
 
Lets crash-applications
Tier1 app
 
Don't dump thread dumps
Tier1app
 
Modern Engineer’s Troubleshooting Tools, Techniques & Tricks at Confoo 2018
Tier1app
 
Micrometrics to forecast performance tsunamis
Tier1app
 
Gc crash course (1)
Tier1 app
 
Accelerating Incident Response To Production Outages
Tier1 app
 
Jdk Tools For Performance Diagnostics
Dror Bereznitsky
 
So You Want To Write Your Own Benchmark
Dror Bereznitsky
 
Доклад Антона Поварова "Go in Badoo" с Golang Meetup
Badoo Development
 
Refactoring for testability c++
Dimitrios Platis
 
Pick diamonds from garbage
Tier1 App
 
Thread dump troubleshooting
Jerry Chan
 
Nvidia® cuda™ 5.0 Sample Evaluation Result Part 1
Yukio Saito
 
Java Heap Dump Analysis Primer
Kyle Hodgson
 
Java In-Process Caching - Performance, Progress and Pittfalls
cruftex
 

Similar to Troubleshooting performanceavailabilityproblems (1) (20)

PPTX
Shooting the troubles: Crashes, Slowdowns, CPU Spikes
Tier1 app
 
PPTX
Don't dump thread dumps
Tier1 App
 
PPTX
DECODING JAVA THREAD DUMPS: MASTER THE ART OF ANALYSIS
Tier1 app
 
PDF
Java troubleshooting thread dump
ejlp12
 
PPTX
Top 5 Java Performance Problems Presentation!
Tier1 app
 
PPTX
16 Critical Artifacts to Capture During Production Problems with Payara Server
KumarNagaraju4
 
PPTX
16 ARTIFACTS TO CAPTURE WHEN THERE IS A PRODUCTION PROBLEM
KumarNagaraju4
 
PPTX
TroubleshootingJVMOutages-3CaseStudies.pptx
Tier1 app
 
PDF
OSCON2012TroubleShootJava
William Au
 
PPTX
Top-5-production-devconMunich-2023-v2.pptx
Tier1 app
 
PDF
Performance Tuning - Memory leaks, Thread deadlocks, JDK tools
Haribabu Nandyal Padmanaban
 
PPTX
Mastering Thread Dump Analysis: 9 Tips & Tricks
Tier1 app
 
PPTX
TroubleshootingJVMOutages-3CaseStudies (1).pptx
Tier1 app
 
PPTX
Top-5-Performance-JaxLondon-2023.pptx
Tier1 app
 
PPTX
Top-5-production-devconMunich-2023.pptx
Tier1 app
 
PPTX
Top-5-java-perf-problems-jax_mainz_2024.pptx
Tier1 app
 
PDF
JavaOne 2014: Java Debugging
Chris Bailey
 
PPT
Heap & thread dump
Nishit Charania
 
PPTX
Effectively Troubleshoot 9 Types of OutOfMemoryError
Tier1 app
 
PDF
Thread Dump Analysis
Dmitry Buzdin
 
Shooting the troubles: Crashes, Slowdowns, CPU Spikes
Tier1 app
 
Don't dump thread dumps
Tier1 App
 
DECODING JAVA THREAD DUMPS: MASTER THE ART OF ANALYSIS
Tier1 app
 
Java troubleshooting thread dump
ejlp12
 
Top 5 Java Performance Problems Presentation!
Tier1 app
 
16 Critical Artifacts to Capture During Production Problems with Payara Server
KumarNagaraju4
 
16 ARTIFACTS TO CAPTURE WHEN THERE IS A PRODUCTION PROBLEM
KumarNagaraju4
 
TroubleshootingJVMOutages-3CaseStudies.pptx
Tier1 app
 
OSCON2012TroubleShootJava
William Au
 
Top-5-production-devconMunich-2023-v2.pptx
Tier1 app
 
Performance Tuning - Memory leaks, Thread deadlocks, JDK tools
Haribabu Nandyal Padmanaban
 
Mastering Thread Dump Analysis: 9 Tips & Tricks
Tier1 app
 
TroubleshootingJVMOutages-3CaseStudies (1).pptx
Tier1 app
 
Top-5-Performance-JaxLondon-2023.pptx
Tier1 app
 
Top-5-production-devconMunich-2023.pptx
Tier1 app
 
Top-5-java-perf-problems-jax_mainz_2024.pptx
Tier1 app
 
JavaOne 2014: Java Debugging
Chris Bailey
 
Heap & thread dump
Nishit Charania
 
Effectively Troubleshoot 9 Types of OutOfMemoryError
Tier1 app
 
Thread Dump Analysis
Dmitry Buzdin
 
Ad

More from Tier1 app (20)

PPTX
Java Native Memory Leaks: The Hidden Villain Behind JVM Performance Issues
Tier1 app
 
PPTX
Key Challenges in Troubleshooting Customer On-Premise Applications
Tier1 app
 
PPTX
Micro-Metrics Every Performance Engineer Should Validate Before Sign-Off
Tier1 app
 
PPTX
GC Tuning: A Masterpiece in Performance Engineering
Tier1 app
 
PPTX
Troubleshooting JVM Outages – 3 Fortune 500 Case Studies
Tier1 app
 
PPTX
Troubleshooting JVM Outages – 3 Fortune 500 case studies
Tier1 app
 
PPTX
How to Troubleshoot 9 Types of OutOfMemoryError
Tier1 app
 
PPTX
Not So Common Memory Leaks in Java Webinar
Tier1 app
 
PPTX
Common Memory Leaks in Java and How to Fix Them
Tier1 app
 
PPTX
7 Micro-Metrics That Predict Production Outages in Performance Labs Webinar
Tier1 app
 
PPTX
How to Check and Optimize Memory Size for Better Application Performance
Tier1 app
 
PPTX
Major Outages in Major Enterprises Payara Conference
Tier1 app
 
PPTX
TROUBLESHOOTING 9 TYPES OF OUTOFMEMORYERROR
Tier1 app
 
PPTX
KnowAPIs-UnknownPerf-jaxMainz-2024 (1).pptx
Tier1 app
 
PPTX
predicting-m3-devopsconMunich-2023-v2.pptx
Tier1 app
 
PPTX
predicting-m3-devopsconMunich-2023.pptx
Tier1 app
 
PPTX
Predicting Production Outages: Unleashing the Power of Micro-Metrics – ADDO C...
Tier1 app
 
PPTX
7-JVM-arguments-JaxLondon-2023.pptx
Tier1 app
 
PPTX
16 ARTIFACTS TO CAPTURE WHEN YOUR CONTAINER APPLICATION IS IN TROUBLE
Tier1 app
 
PPTX
MAJOR OUTAGES IN MAJOR ENTERPRISES
Tier1 app
 
Java Native Memory Leaks: The Hidden Villain Behind JVM Performance Issues
Tier1 app
 
Key Challenges in Troubleshooting Customer On-Premise Applications
Tier1 app
 
Micro-Metrics Every Performance Engineer Should Validate Before Sign-Off
Tier1 app
 
GC Tuning: A Masterpiece in Performance Engineering
Tier1 app
 
Troubleshooting JVM Outages – 3 Fortune 500 Case Studies
Tier1 app
 
Troubleshooting JVM Outages – 3 Fortune 500 case studies
Tier1 app
 
How to Troubleshoot 9 Types of OutOfMemoryError
Tier1 app
 
Not So Common Memory Leaks in Java Webinar
Tier1 app
 
Common Memory Leaks in Java and How to Fix Them
Tier1 app
 
7 Micro-Metrics That Predict Production Outages in Performance Labs Webinar
Tier1 app
 
How to Check and Optimize Memory Size for Better Application Performance
Tier1 app
 
Major Outages in Major Enterprises Payara Conference
Tier1 app
 
TROUBLESHOOTING 9 TYPES OF OUTOFMEMORYERROR
Tier1 app
 
KnowAPIs-UnknownPerf-jaxMainz-2024 (1).pptx
Tier1 app
 
predicting-m3-devopsconMunich-2023-v2.pptx
Tier1 app
 
predicting-m3-devopsconMunich-2023.pptx
Tier1 app
 
Predicting Production Outages: Unleashing the Power of Micro-Metrics – ADDO C...
Tier1 app
 
7-JVM-arguments-JaxLondon-2023.pptx
Tier1 app
 
16 ARTIFACTS TO CAPTURE WHEN YOUR CONTAINER APPLICATION IS IN TROUBLE
Tier1 app
 
MAJOR OUTAGES IN MAJOR ENTERPRISES
Tier1 app
 
Ad

Recently uploaded (20)

PPTX
"Autonomy of LLM Agents: Current State and Future Prospects", Oles` Petriv
Fwdays
 
PDF
CIFDAQ Weekly Market Wrap for 11th July 2025
CIFDAQ
 
PDF
Empower Inclusion Through Accessible Java Applications
Ana-Maria Mihalceanu
 
PDF
Fl Studio 24.2.2 Build 4597 Crack for Windows Free Download 2025
faizk77g
 
PDF
New from BookNet Canada for 2025: BNC BiblioShare - Tech Forum 2025
BookNet Canada
 
PDF
"Beyond English: Navigating the Challenges of Building a Ukrainian-language R...
Fwdays
 
PDF
HCIP-Data Center Facility Deployment V2.0 Training Material (Without Remarks ...
mcastillo49
 
PDF
Log-Based Anomaly Detection: Enhancing System Reliability with Machine Learning
Mohammed BEKKOUCHE
 
PDF
Blockchain Transactions Explained For Everyone
CIFDAQ
 
PDF
Timothy Rottach - Ramp up on AI Use Cases, from Vector Search to AI Agents wi...
AWS Chicago
 
PDF
SWEBOK Guide and Software Services Engineering Education
Hironori Washizaki
 
PDF
Bitcoin for Millennials podcast with Bram, Power Laws of Bitcoin
Stephen Perrenod
 
PDF
LLMs.txt: Easily Control How AI Crawls Your Site
Keploy
 
PDF
DevBcn - Building 10x Organizations Using Modern Productivity Metrics
Justin Reock
 
PDF
Newgen 2022-Forrester Newgen TEI_13 05 2022-The-Total-Economic-Impact-Newgen-...
darshakparmar
 
PPTX
OpenID AuthZEN - Analyst Briefing July 2025
David Brossard
 
PDF
Complete JavaScript Notes: From Basics to Advanced Concepts.pdf
haydendavispro
 
PDF
How Startups Are Growing Faster with App Developers in Australia.pdf
India App Developer
 
PPTX
Building Search Using OpenSearch: Limitations and Workarounds
Sease
 
PDF
Using FME to Develop Self-Service CAD Applications for a Major UK Police Force
Safe Software
 
"Autonomy of LLM Agents: Current State and Future Prospects", Oles` Petriv
Fwdays
 
CIFDAQ Weekly Market Wrap for 11th July 2025
CIFDAQ
 
Empower Inclusion Through Accessible Java Applications
Ana-Maria Mihalceanu
 
Fl Studio 24.2.2 Build 4597 Crack for Windows Free Download 2025
faizk77g
 
New from BookNet Canada for 2025: BNC BiblioShare - Tech Forum 2025
BookNet Canada
 
"Beyond English: Navigating the Challenges of Building a Ukrainian-language R...
Fwdays
 
HCIP-Data Center Facility Deployment V2.0 Training Material (Without Remarks ...
mcastillo49
 
Log-Based Anomaly Detection: Enhancing System Reliability with Machine Learning
Mohammed BEKKOUCHE
 
Blockchain Transactions Explained For Everyone
CIFDAQ
 
Timothy Rottach - Ramp up on AI Use Cases, from Vector Search to AI Agents wi...
AWS Chicago
 
SWEBOK Guide and Software Services Engineering Education
Hironori Washizaki
 
Bitcoin for Millennials podcast with Bram, Power Laws of Bitcoin
Stephen Perrenod
 
LLMs.txt: Easily Control How AI Crawls Your Site
Keploy
 
DevBcn - Building 10x Organizations Using Modern Productivity Metrics
Justin Reock
 
Newgen 2022-Forrester Newgen TEI_13 05 2022-The-Total-Economic-Impact-Newgen-...
darshakparmar
 
OpenID AuthZEN - Analyst Briefing July 2025
David Brossard
 
Complete JavaScript Notes: From Basics to Advanced Concepts.pdf
haydendavispro
 
How Startups Are Growing Faster with App Developers in Australia.pdf
India App Developer
 
Building Search Using OpenSearch: Limitations and Workarounds
Sease
 
Using FME to Develop Self-Service CAD Applications for a Major UK Police Force
Safe Software
 

Troubleshooting performanceavailabilityproblems (1)

  • 3. Step 1:Confirm Don‘t trust anyone ‘top’ tool is your good friend
  • 4. Step 2: Identify Threads Example: top -H -p31294 top –H –p {pid}
  • 5. Step 3: Capture thread d u m p s https://blog.fastthread.io/2016/06/06/how-to-take-thread-dumps-7-options/ 03 jVisualVM JDK tool. Now Open source. GUI based option. 02 kill-3 Kill -3 <pid> Useful whenonly JRE is installed 01 jstack (since Java 5) jstack -l<pid>> /tmp/threadDump.txt 07 APM Tools Few APM Tools does provide this support 06 ThreadMXBean Programmatic way to capture thread dumps 04 JMC JDK tool. Now Open source. GUI based option. 08 J c m d (since Java 7) jcmd <pid> Thread.print> /tmp/threadDump.txt 05 Windows (Ctrl + Break) Helpful during development phase
  • 6. 2019-02-2617:13:23 "Reconnection-1" prio=10 tid=0x00007f0442e10800 nid=0x112a waiting on condition [0x00007f042f719000] java.lang.Thread.State: WAITING (parking) at sun.misc.Unsafe.park(Native Method) - parking to wait for <0x007b3953a98> (a java.util.concurrent.locks.AbstractQueuedSynchr) at java.util.concurrent.locks.LockSupport.park(LockSupport.java:186)at java.lang.Thread.run(Thread.java:722) : : 1 2 3 1 Timestamp at which thread dump was triggered 2 JVM Versioninfo 3 Thread Details-<<detailsin following slides>> Anatomy of thread d u m p Full thread dump Java HotSpot(TM) 64-Bit Server VM (23.7-b01 mixed mode): "InvoiceThread-A996" prio=10 tid=0x00002b7cfc6fb000 nid=0x4479 runnable [0x00002b7d17ab8000] java.lang.Thread.State: RUNNABLE at com.buggycompany.rt.util.ItinerarySegmentProcessor.setConnectingFlight(ItinerarySegmentProcessor.java:380) at com.buggycompany.rt.util.ItinerarySegmentProcessor.processTripType0(ItinerarySegmentProcessor.java:366) at com.buggycompany.rt.util.ItinerarySegmentProcessor.processItineraryByTripType(ItinerarySegmentProcessor.java:254) at com.buggycompany.rt.util.ItinerarySegmentProcessor.templateMethod(ItinerarySegmentProcessor.java:399) at com.buggycompany.qc.gds.InvoiceGeneratedFacade.readTicketImage(InvoiceGeneratedFacade.java:252) at com.buggycompany.qc.gds.InvoiceGeneratedFacade.doOrchestrate(InvoiceGeneratedFacade.java:151) at com.buggycompany.framework.gdstask.BaseGDSFacade.orchestrate(BaseGDSFacade.java:32) at com.buggycompany.framework.gdstask.BaseGDSFacade.doWork(BaseGDSFacade.java:22) at com.buggycompany.framework.concurrent.BuggycompanyCallable.call(buggycompanyCallable.java:80) at java.util.concurrent.FutureTask$Sync.innerRun(FutureTask.java:334) at java.util.concurrent.FutureTask.run(FutureTask.java:166) at java.util.concurrent.ThreadPoolExecutor.runWorker(ThreadPoolExecutor.java:1145) at java.util.concurrent.ThreadPoolExecutor$Worker.run(ThreadPoolExecutor.java:615) at java.lang.Thread.run(Thread.java:722)
  • 7. "InvoiceThread-A996" prio=10 tid=0x00002b7cfc6fb000 nid=0x4479 runnable [0x00002b7d17ab8000] java.lang.Thread.State: RUNNABLE at com.buggycompany.rt.util.ItinerarySegmentProcessor.setConnectingFlight(ItinerarySegmentProcessor.java:380) at com.buggycompany.rt.util.ItinerarySegmentProcessor.processTripType0(ItinerarySegmentProcessor.java:366) at com.buggycompany.rt.util.ItinerarySegmentProcessor.processItineraryByTripType(ItinerarySegmentProcessor.java:254) at com.buggycompany.rt.util.ItinerarySegmentProcessor.templateMethod(ItinerarySegmentProcessor.java:399) at com.buggycompany.qc.gds.InvoiceGeneratedFacade.readTicketImage(InvoiceGeneratedFacade.java:252) at com.buggycompany.qc.gds.InvoiceGeneratedFacade.doOrchestrate(InvoiceGeneratedFacade.java:151) at com.buggycompany.framework.gdstask.BaseGDSFacade.orchestrate(BaseGDSFacade.java:32) at com.buggycompany.framework.gdstask.BaseGDSFacade.doWork(BaseGDSFacade.java:22) at com.buggycompany.framework.concurrent.BuggycompanyCallable.call(buggycompanyCallable.java:80) at java.util.concurrent.FutureTask$Sync.innerRun(FutureTask.java:334) at java.util.concurrent.FutureTask.run(FutureTask.java:166) at java.util.concurrent.ThreadPoolExecutor.runWorker(ThreadPoolExecutor.java:1145) at java.util.concurrent.ThreadPoolExecutor$Worker.run(ThreadPoolExecutor.java:615) at java.lang.Thread.run(Thread.java:722) 1 2 3 4 5 6 7 1 Thread Name -InvoiceThread-A996 2 Priority -Can have values from 1to10 3 Thread Id - 0x00002b7cfc6fb000 – Unique ID assigned by JVM. It's returned by calling the Thread.getId() method. 4 5 6 7 Native Id - 0x4479 - This ID is highly platform dependent. On Linux, it's the pid of the thread. On Windows, it's simply the OS-level thread a process. On Mac OS X, it is said to be the native pthread_t value. Address space - 0x00002b7d17ab8000 - Thread State - RUNNABLE Stack trace -
  • 8. 6 thread states RUNNABLE TERMINATED N E W WAITING03 02 01 06 TIMED_WAITING Thread.sleep(10); public void synchronized getData() { makeDBCall(); } BLOCKED04 Thread 1:Runnable 05 wait(); Thread12::RBuLnOnCaKbElDe
  • 9. Step 4: Identify lines of code causing C P U spike Thread Ids: 31306, 31307, 31308 High CPU consuming Threads Ids reported in ‘top –H’. Let’s look up these thread Ids in Thread dump HexaDecimal equivalent: •31306 7a4a •31307 7a4b •31308 7a4c
  • 10. 1: package com.buggyapp.cpuspike; 2: 3: /** 4: * 5: * @author Test User 6: */ 7: public class Object1 { 8: public static void execute() { while (true) { doSomething(); } } public static void doSomething() { } 9: 10: 11: 12: 13: 14: 15: 16: 17: 18: 19: 20: } Source code
  • 11. ‘Free’ Thread d u m p analysis tools Freely available Thread dump analysis tools 03 IBM Thread & Monitor analyzer https://developer.ibm.com/j avasdk/tools/ 02 Samurai http://samuraism.jp/samurai/e n/index.html 01 FastThread http://fastThread.io/ 04 Visual VM https://visualvm.github.io/
  • 12. C P U spike in a major trading application
  • 14. Unresponsiveness in a B 2 B Travel application Process 70% of N. America oversease Leisure travel ticketing
  • 15. Troubleshooting OutOfMemoryError Unable to create new native thread
  • 16. Major financial institution in N. America Thread d u m p troubleshooting pattern: RSI https://map.tinyurl.com/yxho6lan
  • 17. Java Heap +metaspace Java Heap +metaspace Physical memory Process- 1 Process- 2 Key: Threads are created outside heap, metspace threads Physical memory Solution: 1.Fix thread leak 2.Increase the Thread Limits Set at Operating System(ulimit –u) 3.Reduce Java Heap Size 4.Kills other processes 5.Increase physical memory size 6.Reduce thread stack size (-Xss). Note: can cause StackOverflowError OOM: Unable to create n e w native thread
  • 18. 8 types - OutOfMemoryError Java heap space G C overhead limit exceeded Requested array size exceed VM limit Permgen space 01 02 03 04 Metaspace Unable to create new native thread Kill process or sacrifice child reason stack_trace_with_native method 05 06 07 08 https://blog.gceasy.io/2015/09/25/outofmemoryerror-beautiful-1-page- document/ java.lang.OutOfMemoryError: <type>
  • 19. • https://tinyurl.com/yywdmvyy • RSI Pattern – Same pattern, different problem. Troubleshooting unresponsive app
  • 20. Thread d u m p analysis Patterns https://blog.fastthread.io/category/thread-dump-patterns/ Leprechaun PatternTreadmill PatternRSI Pattern Athlete PatternTraffic J a m PatternAll Roads leads to Rome Pattern few more …Atherosclerosis Pattern Several Scavengers Pattern
  • 22. Enable G C L o g s (always) Till Java 8: -XX:+PrintGCDetails -XX:+PrintGCDateStamps -Xloggc:<file-path> From Java 9: -Xlog:gc*:file=<file-path>
  • 23. ‘Free’ G C L o g analysis tools Freely available Garbage collection log analysis tools 03 IBM GC & Memory visualizer https://developer.ibm.com/j avasdk/tools/ 02 GC Viewer https://github.com/chewie b ug/GCViewer 01 GCeasy http://gceasy.io/ 05 Google Garbage cat (cms) https://code.google.com/ar chive/a/eclipselabs.org/p/g arbagecat 04 HP Jmeter https://h20392.www2.hpe.c o m/portal/swdepot/displayPr oductInfo.do?productNumb er=HPJMETER
  • 25. W h a t is your observation?
  • 28. H o w to diagnose memor y leak? Capture heap d u m p s jmap -dump:live,file=<file-path> <pid> Example: jmap -dump:live,file=/opt/tmp/AddressBook-heapdump.bin37320 -XX:+HeapDumpOnOutOfMemoryError -XX:HeapDumpPath=/logs/heapdump Eclipse MAT, HeapHero Two good tools to analyze memory leaks
  • 29. Capture heap d u m p s https://blog.fastthread.io/2016/06/06/how-to-take-thread-dumps-7-options/ 03 jVisualVM JDK tool. Now Open source. GUI based option. 02 HeapDumpOnOutOfMemoryError -XX:+HeapDumpOnOutOfMemoryError -XX:HeapDumpPath=<file-path> 01 jmap (since Java 5) jmap - dump:live,file=<file- path> <pid> 06 APM Tools Few APM Tools does provide this support 05 ThreadMXBean Programmatic way to capture thread dumps 04 IBM administrative console If you are using WAS, this option can be used 07 Jcmd (since Java 7) jcmd <pid> GC.heap_dump <file-path>
  • 31. Macro-Metric s Can’t forecast scalability, availability, performance problems C P U RESPONSE TIME MEMO RY
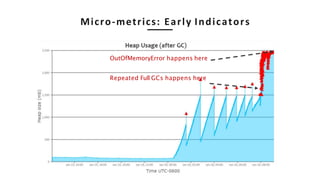
  • 32. Micro-metrics: Early Indicators OutOfMemoryError happens here Repeated Full GCs happens here
  • 33. Few more… TCP/IP States, Hosts count, IOPS,.. File Descriptors File descriptor is a handle to access: File, Pipe, Network Connections. If count grows it’s a lead indicator that application isn’t closing resources properly. Thread States If BLOCKED thread state count grows, it’s an early indication that your application has potential to become unresponsive GC Throughput Amount time application spends in processing customer transactions vs amount of time application spend in doing GC Object Reclamation rate If number of objects created in unit time GC Latency If pause time starts to increase, then it’s an indication that app is suffering from memory problems W h a t are Micrometrics? https://blog.gceasy.io/2019/03/13/micrometrics-to-forecast-application-performance/
  • 34. right data @ right time
  • 35. G C L o g netstat vmstat Thread D u m p s d m esg Heap D u m p s W h a t data to capture? ps top -H Disk Usage top IBM Script: https://map.tinyurl.com/y4gz6o7q Captures all of the above artifacts
  • 36. Thank you m y friends! R a m Lakshmanan ram@tier1ap p .com @tier1app https://www.linkedin.com/company/gceasy