


Tutorial 1.5 - Edit heatmaps
- 1. Tutorial 1.5: Edit heatmaps Edit properties of the heatmaps: change color scale, add annotations, change font size and edit grid.
- 2. STEP 1 Click on Properties and Columns tabs to change properties of the heatmap columns
- 3. STEP 2 Click Select... to change Font, style and Size STEP 3 Increase Font Size for columns to 11
- 4. STEP 4 Click on Rows tabs to change properties of the heatmap rows STEP 5 STEP 6 Click Select... to change Font, Increase Font Size for rows style and Size to 11
- 5. STEP 7 Click on Cells tabs to change properties of the heatmap cells STEP 8 Increase horizontal grid line to 6.
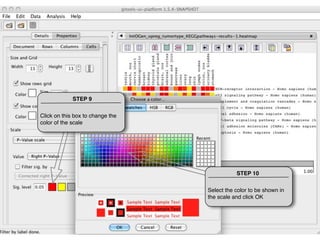
- 6. STEP 9 Click on this box to change the color of the scale STEP 10 Select the color to be shown in the scale and click OK
- 7. You can also select another type of scale for your heatmap
- 8. You can also show another value in your heatmap
- 9. THANKS FOR USING GITOOLS http://www.gitools.org