


![Design implications
#3. Guided support in creating multiple linked views
Authoring interactions, especially linking views, is a complex task.
Provide support by automatic linking of views with shared properties.
“I’m not going to kill myself to make it work. [... ] If it takes
half an hour to do [...] using the tutorial, can I manage to get
something interactive? If I’m like, no, this is too challenging, I’m not
going to make a detour.” – P12](https://image.slidesharecdn.com/ismb2024talk-genomicsvis-250605145817-42b41139/85/Understanding-Visualization-Authoring-for-Genomics-Data-through-User-Interviews-45-320.jpg)
![Design implications
#4. Data and design sensemaking in the same context
Help authors to explore visual designs in the same context as data analysis.
“To have it [the visualization] pop up in line and then in that way,
I can generate it more easily, instead of having to go into the [data
manipulation tool], generate a new file and then in the visualization
tool, see how it works, go tweak again...” – P15](https://image.slidesharecdn.com/ismb2024talk-genomicsvis-250605145817-42b41139/85/Understanding-Visualization-Authoring-for-Genomics-Data-through-User-Interviews-46-320.jpg)
![Design implications
#5. Support collaborative authoring
Users collaborate in multiple ways and for various reasons.
Facilitate different modes of collaboration, for example handoff, by showing the
“delta” between two versions of a visualization.
“We use the same tools or we reuse code [...] between each other” – P15
“I’m not good with aesthetics. So usually I ask people to look at my
plot and tell me what I can improve” – P18
M. Loorak, M. Tory, and S. Carpendale. ChangeCatcher: Increasing Inter-author Awareness for Visualization Development. Computer
Graphics Forum, 3735162](https://image.slidesharecdn.com/ismb2024talk-genomicsvis-250605145817-42b41139/85/Understanding-Visualization-Authoring-for-Genomics-Data-through-User-Interviews-47-320.jpg)
Understanding Visualization Authoring for Genomics Data through User Interviews
- 1. Understanding Visualization Authoring for Genomics Data through User Interviews Astrid van den Brandt Sehi L'Yi Huyen N. Nguyen Etowah Adams Nils Gehlenborg BioVis @ ISMB 2024
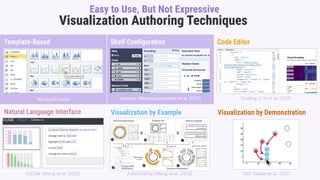
- 4. Gosling Spec (partly) Visualization Authoring Techniques Template-Based Natural Language Interface Visualization by Example Code Editor Visualization by Demonstration VbD Saket et al. 2017 AutoGosling Wang et al. 2022 Voyager Wongsuphasawat et al. 2017 Gosling L'Yi et al. 2021 Microsoft Excel VisTalk Wang et al. 2023 Shelf Configuration
- 5. Gosling Spec (partly) Visualization Authoring Techniques Template-Based Natural Language Interface Visualization by Example Shelf Configuration Code Editor Visualization by Demonstration VbD Saket et al. 2017 AutoGosling Wang et al. 2022 Voyager Wongsuphasawat et al. 2017 Gosling L'Yi et al. 2021 Microsoft Excel VisTalk Wang et al. 2023 Easy to Use, But Not Expressive
- 6. Gosling Spec (partly) Visualization Authoring Techniques Template-Based Natural Language Interface Visualization by Example Shelf Configuration Code Editor Visualization by Demonstration VbD Saket et al. 2017 AutGosling Wang et al. 2022 Voyager Wongsuphasawat et al. 2017 Gosling L'Yi et al. 2021 Microsoft Excel VisTalk Wang et al. 2023 User Friendly, But Not Accurate
- 7. Gosling Spec (partly) Visualization Authoring Techniques Template-Based Natural Language Interface Visualization by Example Shelf Configuration Code Editor Visualization by Demonstration Gosling L'Yi et al. 2021 Microsoft Excel Expressive, But Difficult to Use VbD Saket et al. 2017 AutoGosling Wang et al. 2022 Voyager Wongsuphasawat et al. 2017 VisTalk Wang et al. 2023
- 8. Gosling Spec (partly) Visualization Authoring Techniques Template-Based Natural Language Interface Visualization by Example Shelf Configuration Code Editor Visualization by Demonstration Microsoft Excel Most Common In Genomics Gosling L'Yi et al. 2021 VbD Saket et al. 2017 AutoGosling Wang et al. 2022 Voyager Wongsuphasawat et al. 2017 VisTalk Wang et al. 2023
- 9. Gosling Spec (partly) Visualization Authoring Techniques Template-Based Natural Language Interface Visualization by Example Shelf Configuration Code Editor Visualization by Demonstration VbD Saket et al. 2017 Voyager Wongsuphasawat et al. 2017 Gosling L'Yi et al. 2021 Microsoft Excel Opportunities In Genomics AutGosling Wang et al. 2022 VisTalk Wang et al. 2023
- 10. What visualization authoring techniques can best support a diverse group of genomics experts and in which tasks ?
- 11. Mixed-methods Approach User Interviews (n=20) Exploratory Study (n=13) Study 1 Study 2
- 12. Mixed-methods Approach User Interviews (n=20) Exploratory Study (n=13) Study 1 Study 2 How diverse genomics experts author data visualization?
- 13. Mixed-methods Approach User Interviews (n=20) Exploratory Study (n=13) Study 1 Study 2 How diverse genomics experts author data visualization? Semi-structured paired-interview ▢ Workflow ▢ Tasks ▢ Tools ▢ Challenges Q. “Can you describe the step-by-step process you follow in creating the visualization(s)?” Q. “What tools do you use, and what are their limitations (if any) in the process?” Q. “What are the major obstacles you encounter while creating the visualization?”
- 14. Mixed-methods Approach User Interviews (n=20) Exploratory Study (n=13) Study 1 Study 2 How diverse genomics experts author data visualization? Semi-structured paired-interview ▢ Workflow ▢ Tasks ▢ Tools ▢ Challenges Open and axial coding analysis ATLAS.ti Software
- 15. 5 Personas of Genomics Data Visualization Authors From Study 1
- 16. Mixed-methods Approach User Interviews (n=20) Exploratory Study (n=13) Study 1 Study 2 How diverse genomics experts author data visualization? Semi-structured paired-interview ▢ Workflow ▢ Tasks ▢ Tools ▢ Challenges Open and axial coding analysis
- 17. Mixed-methods Approach User Interviews (n=20) Exploratory Study (n=13) Study 1 Study 2 How diverse genomics experts author data visualization? Semi-structured paired-interview ▢ Workflow ▢ Tasks ▢ Tools ▢ Challenges Open and axial coding analysis How genomics experts ideally want to author data visualizations?
- 18. Mixed-methods Approach User Interviews (n=20) Exploratory Study (n=13) Study 1 Study 2 How diverse genomics experts author data visualization? Semi-structured paired-interview ▢ Workflow ▢ Tasks ▢ Tools ▢ Challenges Open and axial coding analysis How genomics experts ideally want to author data visualizations? Visual Design Probes Crisan et al. Eliciting Model Steering Interactions from Users via Data and Visual Design Probes. IEEE TVCG 2023
- 19. Visual Design Probes From Study 2 Study materials encouraging people to reflect on their experiences, feelings, and attitudes Crisan et al. Eliciting Model Steering Interactions from Users via Data and Visual Design Probes. IEEE TVCG 2023
- 20. Visual Design Probes From Study 2 Training Session For learning 6 authoring techniques Main Session For experiencing techniques in 6 tasks
- 21. Visual Design Probes From Study 2 Training Session For learning 6 authoring techniques Main Session For experiencing techniques in 6 tasks
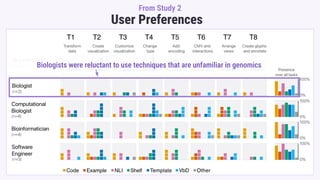
- 22. User Preferences From Study 2 ᐧ Participants provided multiple preferred choices per Task (T1–8)
- 23. User Preferences From Study 2 ᐧ Participants provided multiple preferred choices per Task (T1–8) ᐧ None of the participants stuck to a single technique
- 24. User Preferences From Study 2 ᐧ Participants provided multiple preferred choices per Task (T1–8) ᐧ None of the participants stuck to a single technique ᐧ Noted that different authoring techniques accomplished different tasks
- 29. User Preferences From Study 2 Biologists were reluctant to use techniques that are unfamiliar in genomics
- 30. User Preferences From Study 2 For difficult tasks, all user groups were more open to use novel techniques
- 31. Usefulness of Authoring Techniques
- 32. Natural Language Is Not Always “ Natural ” Usefulness of Authoring Techniques I don't really know .... very very cumbersome to describe it (P6) exact way to defining something is not easy (P10) Text ?
- 33. Design Implications Based on Two Studies
- 34. Design Implications Based on Two Studies 1 Combine techniques for better expressiveness and learnability
- 35. Design Implications Based on Two Studies 1 Combine techniques for better expressiveness and learnability JBrowse 2 Diesh et al. 2023 JBrowse Jupyter Jesus Martinez et al. 2023
- 36. Design Implications Based on Two Studies 1 2 3 4 5 Combine techniques for better expressiveness and learnability Integrate workflows for data exploration and presentation Support guidance in creating multiple linked views Data and design sensemaking in the same context Support collaborative visualization authoring Paper
- 37. 1. 5 personas Biologists, Computational Biologists, Bioinformaticians, Software Engineers, Visualization Experts Contributions & Takeaways Paper
- 38. 1. 5 personas Biologists, Computational Biologists, Bioinformaticians, Software Engineers, Visualization Experts 2. Usefulness of 6 authoring techniques Natural Language Is Not Always “Natural,” Difficulty in Communicating Visually, … 👍 VS. 👎 Contributions & Takeaways Paper
- 39. Contributions & Takeaways 1. 5 personas Biologists, Computational Biologists, Bioinformaticians, Software Engineers, Visualization Experts 2. Usefulness of 6 authoring techniques Natural Language Is Not Always “Natural,” Difficulty in Communicating Visually, … 3. 5 design implications Combine techniques for better expressiveness and learnability, Integrate workflows for data exploration and presentation, … 💡 👍 VS. 👎 Paper
- 40. Astrid van den Brandt Sehi L'Yi Huyen N. Nguyen Etowah Adams Nils Gehlenborg Understanding Visualization Authoring for Genomics Data through User Interviews Paper
- 41. Appendix
- 42. Personas
- 43. Design implications #1. Combine techniques for better expressiveness and learnability Diversity in preferences for techniques calls for combinations of techniques: - Redundantly so users can learn advanced techniques “teaching myself to use shelf construction and then export the code to understand the code” – P11 - Complementary to leverage qualities of individual techniques “start in a certain style or with a figure from another paper”, and to then “adjust that style with NLI and VbD” – P2 J.C. Martin, “Tycoon: Theoretical framework and software tools for multimodal interfaces,ˮ Intelligence and Multimodality in Multimedia interfaces, pp. 125, 1998.
- 44. Design implications #2. Integrating workflows for data exploration and presentation Context switching and discrepancies between data viewers and design tools. More flexibility in how a design can be authored can help to integrate these. “I have to adjust everything in Adobe Illustrator again. That is a significant amount of time.” – P12 L'Yi, Wang, and Gehlenborg, The Role of Visualization in Genomics Data Analysis Workflows: The Interviews, In Proc. IEEE VIS 2023
- 45. Design implications #3. Guided support in creating multiple linked views Authoring interactions, especially linking views, is a complex task. Provide support by automatic linking of views with shared properties. “I’m not going to kill myself to make it work. [... ] If it takes half an hour to do [...] using the tutorial, can I manage to get something interactive? If I’m like, no, this is too challenging, I’m not going to make a detour.” – P12
- 46. Design implications #4. Data and design sensemaking in the same context Help authors to explore visual designs in the same context as data analysis. “To have it [the visualization] pop up in line and then in that way, I can generate it more easily, instead of having to go into the [data manipulation tool], generate a new file and then in the visualization tool, see how it works, go tweak again...” – P15
- 47. Design implications #5. Support collaborative authoring Users collaborate in multiple ways and for various reasons. Facilitate different modes of collaboration, for example handoff, by showing the “delta” between two versions of a visualization. “We use the same tools or we reuse code [...] between each other” – P15 “I’m not good with aesthetics. So usually I ask people to look at my plot and tell me what I can improve” – P18 M. Loorak, M. Tory, and S. Carpendale. ChangeCatcher: Increasing Inter-author Awareness for Visualization Development. Computer Graphics Forum, 3735162