SlideShare a Scribd company logo
2
Most read
4
Most read
Using Dashboards to
Understand Spatial Data
John Reiser
Rowan University
Giving it all isn’t always helpful.
Your users don’t want to use GIS to understand
your data. They don’t want to drink from the fire
hose.
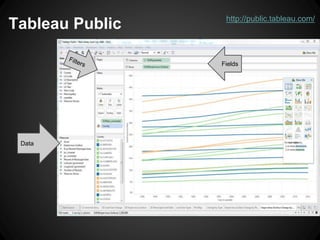
Dashboards
An interactive
view into key
indicators and
metrics your
audience needs
to understand
quickly.
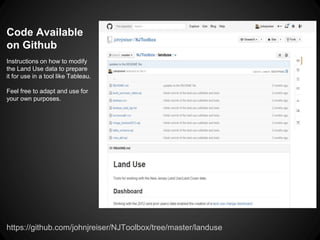
Using Dashboards to Understand Spatial Data
Tab
http://public.tableau.com/
Tableau Public
Data
Fields
Rowan University
Student Enrollment
http://www.rowan.edu/president/ierp/dashboards/
Using Dashboards to Understand Spatial Data
2012 Land Use
http://njgeo.org/2015/04/10/using-tableau-to-visualize-land-use-change/
Using Dashboards to Understand Spatial Data
https://github.com/johnjreiser/NJToolbox/tree/master/landuse
Code Available
on Github
Instructions on how to modify
the Land Use data to prepare
it for use in a tool like Tableau.
Feel free to adapt and use for
your own purposes.
Feel free to contact me:
● jreiser@njgeo.org / reiser@rowan.edu
● @johnjreiser on Twitter, Github, others
● 856 256-5117 (work)
● 856 347-0047 (cell)
● http://njgeo.org/
Thank you for listening!
Discussion

More Related Content

Viewers also liked (13)

PDF
Habitat Change Analysis Project
John Reiser
 
PPT
Network Analysis in ArcGIS
John Reiser
 
PPTX
Data Models - GIS I
John Reiser
 
PPT
Intro to GIS and Remote Sensing
John Reiser
 
PDF
C-Si Module Manufacturers in India
Akash Jauhari
 
PPT
Reading Topographic Maps
duncanpatti
 
PPTX
Are Indian Stock driven by pure Sentiments
Akash Jauhari
 
PDF
Week 1.2 course description 02 251-101
Naynui Cybernet
 
PDF
Location analytics: A New Dimension for your Applications
Esri India
 
PPTX
How culture can make or break a company
Akash Jauhari
 
PDF
New paradigm for national mapping organization
Esri India
 
PDF
Are indian stock market driven more by sentiments than fundamentals- A Resear...
Akash Jauhari
 
PDF
The New Paradigm Towards Geo Enabled Economy
Esri India
 
Habitat Change Analysis Project
John Reiser
 
Network Analysis in ArcGIS
John Reiser
 
Data Models - GIS I
John Reiser
 
Intro to GIS and Remote Sensing
John Reiser
 
C-Si Module Manufacturers in India
Akash Jauhari
 
Reading Topographic Maps
duncanpatti
 
Are Indian Stock driven by pure Sentiments
Akash Jauhari
 
Week 1.2 course description 02 251-101
Naynui Cybernet
 
Location analytics: A New Dimension for your Applications
Esri India
 
How culture can make or break a company
Akash Jauhari
 
New paradigm for national mapping organization
Esri India
 
Are indian stock market driven more by sentiments than fundamentals- A Resear...
Akash Jauhari
 
The New Paradigm Towards Geo Enabled Economy
Esri India
 

Similar to Using Dashboards to Understand Spatial Data (20)

PDF
Python for Geospatial Data Analysis (First Early Release) Bonny P. Mcclain
nghgrinel
 
PPT
A quick overview of geospatial analysis
Md.Farhad Hossen
 
PPT
Env. mon
Ramesh Kumar
 
PPT
GIS.ppt excellent exposure in only 25 slides
JSDhull1
 
PPT
GIS.ppt
safayetmim1
 
PPTX
Comprehensive GIS and Remote Sensing Resources ppt final.pptx
institute of Geoinformatics and Earth Observation at PMAS ARID Agriculture University of Rawalpindi
 
PPTX
Introduction to GIS.pptx
Xian shiyou university
 
PDF
GIS_FDP_Final.pdf
SanthoshKumarP38
 
PPT
FUnding.ppt
suraj7266
 
PPTX
Visualizing Data with Geographic Information Systems (GIS)
Kate Dougherty
 
PPT
fund.ppt
Fatima891926
 
PPT
Fundamentals of Geographical Information System.ppt
bimalp7
 
PPTX
Introduction to Geographic Information Systems
Ange Felix NSANZIYERA
 
PPT
Intro_GIS.ppt
Ashwini Rao
 
PDF
Introduction to Geographic Information System (GIS)
atmnurulhaque
 
PPTX
Introduction to Geographic Information system and Remote Sensing (RS)
chala hailu
 
PPTX
Introduction to GIS_Lecture_ENSC 102.pptx
JomarLucena2
 
PDF
What is gis
Sumant Diwakar
 
PPTX
GIS Level 1 Introduction to GIS and Mapping
MohamudJama6
 
PDF
GIS Basic
Sudhakar Dadhich
 
Python for Geospatial Data Analysis (First Early Release) Bonny P. Mcclain
nghgrinel
 
A quick overview of geospatial analysis
Md.Farhad Hossen
 
Env. mon
Ramesh Kumar
 
GIS.ppt excellent exposure in only 25 slides
JSDhull1
 
GIS.ppt
safayetmim1
 
Introduction to GIS.pptx
Xian shiyou university
 
GIS_FDP_Final.pdf
SanthoshKumarP38
 
FUnding.ppt
suraj7266
 
Visualizing Data with Geographic Information Systems (GIS)
Kate Dougherty
 
fund.ppt
Fatima891926
 
Fundamentals of Geographical Information System.ppt
bimalp7
 
Introduction to Geographic Information Systems
Ange Felix NSANZIYERA
 
Intro_GIS.ppt
Ashwini Rao
 
Introduction to Geographic Information System (GIS)
atmnurulhaque
 
Introduction to Geographic Information system and Remote Sensing (RS)
chala hailu
 
Introduction to GIS_Lecture_ENSC 102.pptx
JomarLucena2
 
What is gis
Sumant Diwakar
 
GIS Level 1 Introduction to GIS and Mapping
MohamudJama6
 
GIS Basic
Sudhakar Dadhich
 
Ad

More from John Reiser (18)

PDF
Python Programming and GIS
John Reiser
 
PDF
NJ MAP: Building a different kind of GIS platform using open source tools.
John Reiser
 
PPTX
Portfolio Workshop
John Reiser
 
PPTX
GIS Day at BCC 2012
John Reiser
 
PPTX
Mapping the Human Environment
John Reiser
 
PPTX
Going Mobile with HTML5
John Reiser
 
PPTX
Mapping the Way
John Reiser
 
PPTX
New Jersey Land Change Viewer
John Reiser
 
PPTX
Measurement and Scale
John Reiser
 
PPTX
Map Projections
John Reiser
 
PPT
Geodatabases
John Reiser
 
PPTX
GIS Modeling
John Reiser
 
PPTX
Data Storage and Processing
John Reiser
 
PPT
GIS Data Types
John Reiser
 
PPTX
Getting your Data Out There: An Introduction to Distributed GIS
John Reiser
 
PPTX
IMGIS - Brief History of Mapping
John Reiser
 
PPTX
Internet-enabled GIS - Spring 2011
John Reiser
 
PPT
Internet-enabled GIS for Planners
John Reiser
 
Python Programming and GIS
John Reiser
 
NJ MAP: Building a different kind of GIS platform using open source tools.
John Reiser
 
Portfolio Workshop
John Reiser
 
GIS Day at BCC 2012
John Reiser
 
Mapping the Human Environment
John Reiser
 
Going Mobile with HTML5
John Reiser
 
Mapping the Way
John Reiser
 
New Jersey Land Change Viewer
John Reiser
 
Measurement and Scale
John Reiser
 
Map Projections
John Reiser
 
Geodatabases
John Reiser
 
GIS Modeling
John Reiser
 
Data Storage and Processing
John Reiser
 
GIS Data Types
John Reiser
 
Getting your Data Out There: An Introduction to Distributed GIS
John Reiser
 
IMGIS - Brief History of Mapping
John Reiser
 
Internet-enabled GIS - Spring 2011
John Reiser
 
Internet-enabled GIS for Planners
John Reiser
 
Ad

Recently uploaded (20)

PDF
July Patch Tuesday
Ivanti
 
PDF
How Startups Are Growing Faster with App Developers in Australia.pdf
India App Developer
 
PDF
TrustArc Webinar - Data Privacy Trends 2025: Mid-Year Insights & Program Stra...
TrustArc
 
PDF
Predicting the unpredictable: re-engineering recommendation algorithms for fr...
Speck&Tech
 
PPTX
Building Search Using OpenSearch: Limitations and Workarounds
Sease
 
PDF
Fl Studio 24.2.2 Build 4597 Crack for Windows Free Download 2025
faizk77g
 
PPTX
Top iOS App Development Company in the USA for Innovative Apps
SynapseIndia
 
PDF
Rethinking Security Operations - SOC Evolution Journey.pdf
Haris Chughtai
 
PDF
NewMind AI Journal - Weekly Chronicles - July'25 Week II
NewMind AI
 
PPTX
Building and Operating a Private Cloud with CloudStack and LINBIT CloudStack ...
ShapeBlue
 
PDF
Apache CloudStack 201: Let's Design & Build an IaaS Cloud
ShapeBlue
 
PDF
Impact of IEEE Computer Society in Advancing Emerging Technologies including ...
Hironori Washizaki
 
PDF
NewMind AI - Journal 100 Insights After The 100th Issue
NewMind AI
 
PPTX
Webinar: Introduction to LF Energy EVerest
DanBrown980551
 
PDF
Women in Automation Presents: Reinventing Yourself — Bold Career Pivots That ...
DianaGray10
 
PDF
SFWelly Summer 25 Release Highlights July 2025
Anna Loughnan Colquhoun
 
PPTX
Extensions Framework (XaaS) - Enabling Orchestrate Anything
ShapeBlue
 
PDF
CIFDAQ Token Spotlight for 9th July 2025
CIFDAQ
 
PDF
LLMs.txt: Easily Control How AI Crawls Your Site
Keploy
 
PDF
Why Orbit Edge Tech is a Top Next JS Development Company in 2025
mahendraalaska08
 
July Patch Tuesday
Ivanti
 
How Startups Are Growing Faster with App Developers in Australia.pdf
India App Developer
 
TrustArc Webinar - Data Privacy Trends 2025: Mid-Year Insights & Program Stra...
TrustArc
 
Predicting the unpredictable: re-engineering recommendation algorithms for fr...
Speck&Tech
 
Building Search Using OpenSearch: Limitations and Workarounds
Sease
 
Fl Studio 24.2.2 Build 4597 Crack for Windows Free Download 2025
faizk77g
 
Top iOS App Development Company in the USA for Innovative Apps
SynapseIndia
 
Rethinking Security Operations - SOC Evolution Journey.pdf
Haris Chughtai
 
NewMind AI Journal - Weekly Chronicles - July'25 Week II
NewMind AI
 
Building and Operating a Private Cloud with CloudStack and LINBIT CloudStack ...
ShapeBlue
 
Apache CloudStack 201: Let's Design & Build an IaaS Cloud
ShapeBlue
 
Impact of IEEE Computer Society in Advancing Emerging Technologies including ...
Hironori Washizaki
 
NewMind AI - Journal 100 Insights After The 100th Issue
NewMind AI
 
Webinar: Introduction to LF Energy EVerest
DanBrown980551
 
Women in Automation Presents: Reinventing Yourself — Bold Career Pivots That ...
DianaGray10
 
SFWelly Summer 25 Release Highlights July 2025
Anna Loughnan Colquhoun
 
Extensions Framework (XaaS) - Enabling Orchestrate Anything
ShapeBlue
 
CIFDAQ Token Spotlight for 9th July 2025
CIFDAQ
 
LLMs.txt: Easily Control How AI Crawls Your Site
Keploy
 
Why Orbit Edge Tech is a Top Next JS Development Company in 2025
mahendraalaska08
 

Using Dashboards to Understand Spatial Data

Editor's Notes

  • #5: Dashboard tools should allow you to make the dashboard custom to your audience’s needs.
  • #10: Initial view of the Public Enrollment Dashboard. You can see enrollment by term, admit type, residency, etc. Each chart is interactive and linked. Selecting an element on one chart will modify the other charts to highlight the common subset of data selected.
  • #11: In this view, we are looking at Enrollment by Term and College, with Counties and ZIP Codes displayed. From here, you can select a ZIP code on the map to see what the past four terms of enrollment were, as well as to which college the students from Hammonton were enrolled.