SlideShare a Scribd company logo
Using R for Customer Segmentation
useR! 2008
Dortmund, Germany
August, 2008
Jim Porzak,
Senior Director of Analytics
Responsys, Inc.
San Francisco, California
11Aug08 userR! 08 - Porzak, Customer Segmentation 2
Outline
● Two main case study examples
– Customer purchase behavior data
● Goal: actionable segments to improve LTV of customer
base
– Prospect intent & interest survey data
● Goal: actionable segments to better target messaging
content and tactics
● Real data from real clients (sanitized)
● Workshop format
– Hands on
– Discussion heavy
11Aug08 userR! 08 - Porzak, Customer Segmentation 3
Introduction
11Aug08 userR! 08 - Porzak, Customer Segmentation 4
Why Segment?
● Better communication with customers and
prospects
– Recipient should feel that we understand him or her
as an individual
– “Send the right message to the right person at the
right time”
● Challenges:
– Widely applicable
● General rules based on readily available data
● A new contact can be placed in their segment easily
– Usable
● Marketing can relate
● Technology can deliver
11Aug08 userR! 08 - Porzak, Customer Segmentation 5
Segmentation in Practice
11Aug08 userR! 08 - Porzak, Customer Segmentation 6
Behavioral Segmentation
11Aug08 userR! 08 - Porzak, Customer Segmentation 7
What's Behavioral Segmentation?
● Based on what people actually do
– Not on what that say they do
● Purchase behavior
– Discuss examples...
● Usage behavior
– Discuss examples...
11Aug08 userR! 08 - Porzak, Customer Segmentation 8
Why do Behavioral Segmentation?
● All comes down to interacting with your
customer or prospect in the appropriate way
– From customers perspective, not yours!
● Ideally a “one-to-one” interaction
– Not practical in today's world
– Goal: perceived by customer as “one-to-one”
11Aug08 userR! 08 - Porzak, Customer Segmentation 9
Today's Purchase Behavior Data Set
● Actual web & phone sales records (sanitized)
– 541k order detail lines
– 135k Customers
– Over 2 ½ years
– Of ~900 different products
– In 5 product categories
● Conventional wisdom
– Strong seasonality
– Have a loyal customer base
– But, have retention problem
11Aug08 userR! 08 - Porzak, Customer Segmentation 10
What we know
Date: 10/10/07 Order #: 12345
Customer: 3894832
Sue Smith
1 Short Street
Qty SKU Description Unit Price Ext Price
1 123 1.50 1.50
3 345 White Widget 2.00 6.00
Total 7.50
Tax 0.60
Shipping 2.00
Grand Total 10.10
Smallville, ND, 39248
Green Gizzmo
Imagine a customer order form:
We get the highlighted data.
Plus: order channel and product (SKU) category
11Aug08 userR! 08 - Porzak, Customer Segmentation 11
Preloaded as “orders” data frame
> load("BehavioralDataSet.Rda")
> str(orders)
'data.frame': 541101 obs. of 9 variables:
$ SKU_ID : int 459 459 459 459 459 459 459 459 459 459 ...
$ ChannelID: int 3 4 3 3 3 3 4 3 3 3 ...
$ CustID : int 134945 212174 39861 11227 137271 60982 ...
$ OrderID : int 326324 109305 172669 132642 20449 40826 ...
$ OrderDate:Class 'Date' num [1:541101] 13211 13649 13670 ...
$ Quantity : int 1 2 1 3 1 1 1 1 1 1 ...
$ Amount : num 18 36 18 54 18 18 18 18 18 18 ...
$ Channel : Factor w/ 4 levels "phone1","phone2",..: 3 4 3
3 ...
$ Category : Factor w/ 7 levels "*","C","G","I",..: 3 3 3 3
3 ...
11Aug08 userR! 08 - Porzak, Customer Segmentation 12
orders summary
> summary(orders[-(1:2)])
CustID OrderID OrderDate Quantity
Min. : 2 Min. : 2 Min. :2005-09-01 Min. : 0.000
1st Qu.: 62221 1st Qu.:105292 1st Qu.:2006-07-18 1st Qu.: 1.000
Median :124343 Median :210908 Median :2007-02-14 Median : 1.000
Mean :152974 Mean :207535 Mean :2007-03-11 Mean : 1.113
3rd Qu.:185119 3rd Qu.:315711 3rd Qu.:2007-12-04 3rd Qu.: 1.000
Max. :506929 Max. :388319 Max. :2008-07-14 Max. :275.000
NA's : 4
Amount Channel Category
Min. : 0.01 phone1: 14303 *: 0
1st Qu.: 20.00 phone2: 90 C:142147
Median : 30.00 web1 :451354 G:114300
Mean : 31.81 web2 : 75354 I: 14961
3rd Qu.: 35.00 N: 50385
Max. :4577.00 T:199354
X: 19954
11Aug08 userR! 08 - Porzak, Customer Segmentation 13
Goal of this exercise?
● Marketers need to come up with a
communication strategy & associated tactics
which will entice customers to exhibit higher
LTV – Long Term Value.
● Segment by past purchase behavior to provide
actionable subsets of customers
– When marketers use our subsets, they get
measurably better results than previous “one size
fits all” method.
11Aug08 userR! 08 - Porzak, Customer Segmentation 14
How are we going to do this?
(Discussion)
11Aug08 userR! 08 - Porzak, Customer Segmentation 15
Hints
● Live Stage
● Value
● Engagement
● Favorite Products
● Timing
11Aug08 userR! 08 - Porzak, Customer Segmentation 16
Recency, Frequency, & Monetary Metrics
● Recency
– How long ago was last purchase? (days)
– Measured for “As Of Date” of data set
● Frequency
– How many orders in analysis period (2 ½ years)
– Attempting to measure engagement
● Monetary
– What is total $ value of all orders in analysis period
Question: Do you expect these three to be uncorrelated?
11Aug08 userR! 08 - Porzak, Customer Segmentation 17
An Aside: Classical RFM
● Invented by direct marketers in 1950's as a way to
model response rates (before good stat software was
readily available)
● One typical method
– R, F, & M each scored in quantile (typically 5)
– Combined score for each recipient was
concatenation of the three digits, eg “351”
– Scores ranked by empirical response rate
– Mailing then done to top xx% of list
● Today we use, lm, glm, randomForest, ...
● But, concepts still valid as conceptional model
● And, R & F measures typically very important in any
predictive model
11Aug08 userR! 08 - Porzak, Customer Segmentation 18
I also typically include...
● Breadth
– How many different SKUs purchased?
● Tenure
– How long as customer been with us?
11Aug08 userR! 08 - Porzak, Customer Segmentation 19
Next Step – Aggregate by Customer
● We need some “raw” RFM values
● Make the data frame “RFM_raw”
– CustomerID: the business key back to database
– FirstPurchaseDate: interesting for tenure metric
– LastPurchaseDate: basis of Recency
– NumberOrders: basis of Frequency
– NumberSKUs: basis of Breadth (engagement metric)
– TotalAmount: basis of Monetary
● Also calculate
– AsOfDate <- max(LastPurchaseDate)
11Aug08 userR! 08 - Porzak, Customer Segmentation 20
Building the RFM_raw data frame
## for performance, make OrderDate an integer during aggregation
orders_n <- orders
orders_n$OrderDate <- as.integer(orders_n$OrderDate)
## build up one column at a time
RFM_raw <- with(orders_n, data.frame(CustomerID = sort(unique(CustID))))
RFM_raw <- cbind(RFM_raw, FirstPurchaseDate = with(orders_n,
as.Date(as.integer(by(OrderDate, CustID, min)), "1970-01-01")))
RFM_raw <- cbind(RFM_raw, LastPurchaseDate = with(orders_n,
as.Date(as.integer(by(OrderDate, CustID, max)), "1970-01-01")))
RFM_raw <- cbind(RFM_raw, NumberOrders = with(orders_n,
as.numeric(by(OrderID, CustID, function(x) length(unique(x))))))
RFM_raw <- cbind(RFM_raw, NumberSKUs = with(orders_n,
as.numeric(by(SKU_ID, CustID, function(x) length(unique(x))))))
RFM_raw <- cbind(RFM_raw, TotalAmount = with(orders_n,
as.numeric(by(Amount, CustID, sum))))
AsOfDate <- max(RFM_raw$LastPurchaseDate)
save(RFM_raw, AsOfDate, file = "RFM_raw.Rda")
This take a while (1 ½ minutes on my laptop). You may want to download RFM_raw.Rda
11Aug08 userR! 08 - Porzak, Customer Segmentation 21
Do some RMF EDA
## Jim's miscellaneous DMA functions
source("dma_misc.R")
## for interactive games:
attach(RFM_raw)
## EDA plots using base graphics
rfm.plot(as.numeric(AsOfDate - LastPurchaseDate) %/% 7, "rec")
rfm.plot(NumberOrders, "freq")
rfm.plot(TotalAmount, "mon")
rfm.plot(NumberSKUs, "breadth")
## EDA plots using iPlots
ihist(as.numeric(AsOfDate - LastPurchaseDate) %/% 7, title = "Recency")
ihist(NumberOrders, title = "Frequency")
ihist(TotalAmount, title = "Monetary")
ihist(NumberSKUs, title = "Breadth")
11Aug08 userR! 08 - Porzak, Customer Segmentation 22
RFM EDA Plots
In all cases, “best is left.”
11Aug08 userR! 08 - Porzak, Customer Segmentation 23
Assign reasonable RFM breaks
● Recency:
– Breaks (weeks <=): 25, 51, 77, 103, <else>
– levels = c("0-5", "6-11", "12-17", "18-23", "24-29"))
● Note levels labeled in months, not weeks
● Frequency:
– Breaks (count <=): 1, 3, 7, <else>
– levels = c("8+", "7-4", "3-2", "1"))
● Note ordering for best is left.
● Monetary:
– Breaks (value <=): 50, 100, 200, 400, <else>
– levels = c("401+", "400-201", "200-101", "100-51", "50-0"))
● Again ordering is best is left.
11Aug08 userR! 08 - Porzak, Customer Segmentation 24
Build RFM_segs data frame
RFM_segs <- data.frame(Recency_weeks = as.numeric(AsOfDate - RFM_raw$LastPurchaseDate) %/% 7)
row.names(RFM_segs) <- row.names(RFM_raw)
## now label levels with months rather than weeks
RFM_segs$Recency <- ordered(ifelse(RFM_segs$Recency_weeks <= 25, "0-5",
ifelse(RFM_segs$Recency_weeks <= 51, "6-11",
ifelse(RFM_segs$Recency_weeks <= 77, "12-17",
ifelse(RFM_segs$Recency_weeks <= 103, "18-23", "24-29")))),
levels = c("0-5", "6-11", "12-17", "18-23", "24-29"))
RFM_segs$Frequency_count <- RFM_raw$NumberOrders
RFM_segs$Frequency <- ordered(ifelse(RFM_segs$Frequency_count == 1, "1",
ifelse(RFM_segs$Frequency_count <= 3, "3-2",
ifelse(RFM_segs$Frequency_count <= 7, "7-4", "8+"))),
levels = c("8+", "7-4", "3-2", "1"))
RFM_segs$Monetary_value <- RFM_raw$TotalAmount
RFM_segs$Monetary <- ordered(ifelse(RFM_segs$Monetary_value <= 50, "50-0",
ifelse(RFM_segs$Monetary_value <= 100, "100-51",
ifelse(RFM_segs$Monetary_value <= 200, "200-101",
ifelse(RFM_segs$Monetary_value <= 400, "400-201", "401+")))),
levels = c("401+", "400-201", "200-101", "100-51", "50-0"))
11Aug08 userR! 08 - Porzak, Customer Segmentation 25
We typically also add Breadth & Tenure:
RFM_segs$Breadth_count <- RFM_raw$NumberSKUs
RFM_segs$Breadth <- ordered(ifelse(RFM_segs$Breadth_count == 1, "1",
ifelse(RFM_segs$Breadth_count == 2, "2",
ifelse(RFM_segs$Breadth_count <= 4, "4-3",
ifelse(RFM_segs$Breadth_count <= 9, "9-5", "10+")))),
levels = c("10+", "9-5", "4-3", "2", "1"))
RFM_segs$Tenure_weeks <- as.numeric(AsOfDate - FirstPurchaseDate) %/% 7
RFM_segs$Tenure <- ordered(ifelse(RFM_segs$Tenure_weeks <= 12, "0-12",
ifelse(RFM_segs$Tenure_weeks <= 25, "13-25",
ifelse(RFM_segs$Tenure_weeks <= 38, "26-38",
ifelse(RFM_segs$Tenure_weeks <= 51, "39-51",
ifelse(RFM_segs$Tenure_weeks <= 64, "52-64",
ifelse(RFM_segs$Tenure_weeks <= 77, "65-77",
ifelse(RFM_segs$Tenure_weeks <= 90, "78-90",
ifelse(RFM_segs$Tenure_weeks <= 103, "91-103",
"104+")))))))),
levels = c("104+", "91-103", "78-90", "65-77", "52-64", "39-51",
"26-38", "13-25", "0-12"))
save(RFM_segs, file = "RFM_segs.Rda")
11Aug08 userR! 08 - Porzak, Customer Segmentation 26
How do customers look in RFM space?
● I like mosaic plots (& especially vcd* package!)
● Set up a “structure table” with assignments:
● And a convenience function for mosaic:
require(vcd)
RFM_st <- structable(~ Recency + Frequency + Monetary + Breadth,
data = RFM_segs)
mm <- function(f) {
mosaic(f, data = RFM_st,
shade = TRUE,
labeling_args = list(rot_labels = c(left = 90, top = 45),
just_labels = c(left = "left",
top = "center")),
spacing = spacing_dimequal(unit(c(0.5, 0.8), "lines")),
keep_aspect_ratio = FALSE
)
}
* To learn more, attend: The strucplot framework for Visualizing Categorical Data. Wed, 11:30. E29
11Aug08 userR! 08 - Porzak, Customer Segmentation 27
mm(~ Recency + Frequency)
11Aug08 userR! 08 - Porzak, Customer Segmentation 28
mm(~ Frequency + Monetary)
11Aug08 userR! 08 - Porzak, Customer Segmentation 29
mm(~ Recency + Monetary)
11Aug08 userR! 08 - Porzak, Customer Segmentation 30
mm(~ Breadth + Monetary)
11Aug08 userR! 08 - Porzak, Customer Segmentation 31
To really show off vcd!
pairs(RFM_st, lower_panel = pairs_assoc, shade = TRUE)
11Aug08 userR! 08 - Porzak, Customer Segmentation 32
Time to get real – remember goal?
11Aug08 userR! 08 - Porzak, Customer Segmentation 33
Actionable for Marketers
The big two concepts:
1. Lifestage
2. Value
Turns out we can do both with Recency &
Frequency!
11Aug08 userR! 08 - Porzak, Customer Segmentation 34
Use Balloon Plots to Communicate
require(gplots)
# Recency by Frequence - Counts
RxF <- as.data.frame(table(RFM_segs$Recency, RFM_segs$Frequency,
dnn = c("Recency", "Frequency")),
responseName = "Number_Customers")
with(RxF, balloonplot(Recency, Frequency, Number_Customers, zlab = "#
Customers"))
# Recency by Frequency - Annual Value (total annual sales to segment)
VbyRxF <- (aggregate(RFM_segs$Monetary_value,
by = list(Recency = factor(RFM_segs$Recency),
Frequency = RFM_segs$Frequency),
sum))
names(VbyRxF)[3] <- "Annual_Sales"
VbyRxF$Annual_Sales <- VbyRxF$Annual_Sales / (28/12) ## normalize to
annual revnue
with(VbyRxF, balloonplot(Recency, Frequency, Annual_Sales / 1000, zlab =
"Annual Sales (000)"))
11Aug08 userR! 08 - Porzak, Customer Segmentation 35
Recency by Frequency - Counts
11Aug08 userR! 08 - Porzak, Customer Segmentation 36
Recency by Frequency - Value
11Aug08 userR! 08 - Porzak, Customer Segmentation 37
Exercise – Assign Segments
● Lifestage “dimension”
– New
– Active
– Lapsed
– Lost
● Value “dimension”
– Gold
– Silver
– Bronze
● Combined as
– High Value, Repeat, New, One-time, Lapsed, & Lost
11Aug08 userR! 08 - Porzak, Customer Segmentation 38
Color & Label Segment Cells
# a matrix of segment codes
RF_segs0 <- matrix("", nrow = 4, ncol = 5)
# manually make assignments
object.browser() ## Fill in H, R, N, L, or O. Save as RF_segs.txt
# get back into R
RF_segs <- as.matrix(read.delim("RF_segs.txt", sep = "t",
na.strings = ""))
RF_segs[is.na(RF_segs)] <- "X" ## N/A's become “Lost”
# add colors and labels to balloon plot
# Magic values for balloon cell centers
RF_x <- matrix(2:6 + 0.25, nrow = 4, ncol = 5, byrow = TRUE)
RF_y <- matrix(4:1, nrow = 4, ncol = 5, byrow = FALSE)
RF_cols <- sapply(RF_segs, function(x) switch(x, H="gold",
R="slategray2", N="green",
L="yellow", O="darkgreen", "red"))
points(RF_x, RF_y, col = RF_cols, pch = 16, cex = 12)
text(RF_x, RF_y, RF_segs, cex = 2)
11Aug08 userR! 08 - Porzak, Customer Segmentation 39
Final Segments for Marketers
11Aug08 userR! 08 - Porzak, Customer Segmentation 40
Conceptual RF Segments
11Aug08 userR! 08 - Porzak, Customer Segmentation 41
Break Time!
11Aug08 userR! 08 - Porzak, Customer Segmentation 42
Attitudinal Segmentation
11Aug08 userR! 08 - Porzak, Customer Segmentation 43
Marketing Challenge
● Our client offers free download of software with
high perceived value, but
● First asks user to fill out a simple survey
● Challenge is to come up with a “few” segments
that will be used by segment to:
– Prioritize contact strategy
– Craft marketing messages based on profile
11Aug08 userR! 08 - Porzak, Customer Segmentation 44
Sample Data
● Surveys from 20k respondents
● All within same time frame (a number of weeks)
● All requested the software download
11Aug08 userR! 08 - Porzak, Customer Segmentation 45
Survey Description
● 35 check boxes or radio buttons
– None required. Coded as binary responses
● Arranged in 5 sections
– License: W and/or X
– Role: one of D, SA, ITM, ITA, Str, Oth (radio
buttons)
– System: any of S, T, A, B, C, D, O (check boxes)
– Interest: any of M, O Pl, Pr, Sup, 64, Con, Per, DT,
Z, Oth. (check boxes)
– Application: any of Web, Inf, Col, Db, J2, Top, Dev,
Per, Other (check boxes)
11Aug08 userR! 08 - Porzak, Customer Segmentation 46
Data Set
Provided as data frame csb, in
InterestPreferenceSurvey.Rda
# Getting started
setwd("C:/Data/useR08/R")
require(lattice)
require(grDevices)
require(vcd)
require(flexclust)
load(file = "InterestPreferenceSurvey.Rda")
str(csb)
'data.frame': 20000 obs. of 35 variables:
$ Lic_W : int 0 0 0 0 0 0 0 0 0 0 ...
$ Lic_X : int 1 1 1 0 1 1 1 1 1 1 ...
$ Role_D : int 0 0 0 0 0 0 0 0 1 0 ...
$ Role_SA : int 0 0 1 0 1 0 0 1 0 0 ...
$ Role_ITM: int 0 0 0 1 0 0 0 0 0 0 ...
$ Role_ITA: int 0 0 0 0 0 0 0 0 0 0 ...
11Aug08 userR! 08 - Porzak, Customer Segmentation 47
Proportion Responders by Question
> mean(csb)
Lic_W Lic_X Role_D Role_SA Role_ITM Role_ITA Role_Stu Role_Oth
0.16040 0.90980 0.19905 0.32910 0.06905 0.08465 0.21080 0.05090
Sys_S Sys_T Sys_A Sys_B Sys_C Sys_D Sys_O Int_M
0.17780 0.39720 0.17020 0.13975 0.09325 0.03510 0.19260 0.36960
Int_O Int_Pl Int_Pr Int_Sup Int_64 Int_Con Int_Per Int_DT
0.46810 0.09395 0.10055 0.08985 0.23445 0.21235 0.31420 0.11790
Int_Z Int_Oth Ap_Web Ap_Inf Ap_Col Ap_Db Ap_J2 Ap_Top
0.23450 0.05995 0.39640 0.19125 0.18365 0.30125 0.19455 0.30145
Ap_Dev Ap_Per Ap_Other
0.18960 0.20050 0.03735
11Aug08 userR! 08 - Porzak, Customer Segmentation 48
Clustering Strategy
● flexclust package by Fritz Leisch
● See his 2006 paper (on his personal page):
A Toolbox for K-Centroids Cluster Analysis
● This is (mostly) an optional response type
survey
– 1 = “yes” is significant
– 0 is just absence not really a “no”
– Respondents checking Role_SA have much more
in common than those not checking Role_SA
● Following Fritz's argument we use the
expectation based Jaccard distance measure.
11Aug08 userR! 08 - Porzak, Customer Segmentation 49
A First Cluster Run
require(flexclust)
## set up flexclust control object
fc_cont <- new("flexclustControl")
fc_cont@tolerance <- 0.1 ## this doesn't seem to work as expected
fc_cont@iter.max <- 30 ## seems to be effective convergence
##fc_cont@verbose <- 1 ## set TRUE if to see each step
my_seed <- 0
my_family <- "ejaccard"
num_clust <- 4
my_seed <- my_seed + 1
set.seed(my_seed)
cl <- kcca(csb, k = num_clust, save.data = TRUE, control = fc_cont,
family = kccaFamily(my_family))
## This takes ~ 1.5 min. on my laptop
11Aug08 userR! 08 - Porzak, Customer Segmentation 50
Cluster Summary
> summary(cl)
kcca object of family 'ejaccard'
call:
kcca(x = csb, k = num_clust, family = kccaFamily(my_family),
control = fc_cont, save.data = TRUE)
cluster info:
size av_dist max_dist separation
1 5551 0.7159832 1 0.6766653
2 4577 0.7707523 1 0.7437616
3 2535 0.7482347 1 0.7038259
4 7337 0.7215583 1 0.6732479
no convergence after 200 iterations
sum of within cluster distances: 14693.00
11Aug08 userR! 08 - Porzak, Customer Segmentation 51
Run Plots
pop_av_dist <- with(cl@clusinfo, sum(size*av_dist)/sum(size))
main_txt <- paste("kcca ", c1@family@name, " - ",
num_clust, " clusters (",
nsamp, "k sample, seed = ", my_seed,
")", sep = "")
# Neighborhood Graph on 1st principle components
csb.pca <- prcomp(csb)
plot(cl, data = as.matrix(csb), project = csb.pca,
main = main_txt,
sub = paste("nAv Dist = ", format(pop_av_dist, digits = 5),
", k = ", c1@k, sep = "")
)
# Activity Profiles for each segment
print(barchart(cl, main = main_txt, strip.prefix = "#",
scales = list(cex = 0.6)))
11Aug08 userR! 08 - Porzak, Customer Segmentation 52
Plots (k=4, seed = 1)
11Aug08 userR! 08 - Porzak, Customer Segmentation 53
Plots (k=4, seed = 2)
11Aug08 userR! 08 - Porzak, Customer Segmentation 54
Plots (k=4, seed = 3)
11Aug08 userR! 08 - Porzak, Customer Segmentation 55
Are any of these any good?
● If so, which?
● How to decide?
● Quoting Fritz (pg 15):
The actual choice of expectation-based Jaccard
with K = 6 clusters ... has been made manually by
comparing various solutions and selecting the one
which made most sense from the practitioners
point of view. This may seem unsatisfying because
the decision is subjective, but cluster analysis here
is used as a tool for exploratory data analysis and
offers simplified views of a complex data set.
11Aug08 userR! 08 - Porzak, Customer Segmentation 56
Our Selection Criteria
1. Choice of k, must have mostly ~ stable
solutions, and
2. Cluster profiles must be interpretable. IOW,
what is the story you can tell about each
cluster? Will the marketers relate to it?
11Aug08 userR! 08 - Porzak, Customer Segmentation 57
Your Challenge...
Do what Fritz said:
The actual choice ... has been made manually by
comparing various solutions and selecting the one
which made most sense.
Here are 4 runs for each k = 3 to 8; 24 in all.
Pick the “best” one, make up stories for each cluster,
and explain your choice to group.
11Aug08 userR! 08 - Porzak, Customer Segmentation 58
For the Record. Jim's Pick:
11Aug08 userR! 08 - Porzak, Customer Segmentation 59
Jim's Stories
Based on knowing a bit more about the client
than I can share with you.
#1: An “S” loyalist, high % SA's
#2: Favors name brands, high responders
#3: A “T” loyalist, broad but reduced responses
#4: Favors name brands, but otherwise low resp.
#5: Student, gray box, open source, desktop.
11Aug08 userR! 08 - Porzak, Customer Segmentation 60
Finally, using predict in flexclust
Once we (analysts & marketers) have decided on
a clustering model, we want to use it to assign
new respondents to likely segment.
flexclust includes predict:
persona <- predict(cl, csb)
head(persona)
str(persona)
PersonaPredict <- as.data.frame(persona)
names(PersonaPredict) <- "cluster"
> table(PersonaPredict)
PersonaPredict
1 2 3 4 5
2313 6479 4654 2702 3852
11Aug08 userR! 08 - Porzak, Customer Segmentation 61
Closing the Loop –
Tying Back to Purchase Model
Where ppBand is probability of purchase band ( 0 = 0.0 – 0.999,
1 = 0.10 – 0.199, … 9 = 0.90 – 0.999). IOW, 0 is really low & 9 is
really high probability of purchase according to the model
11Aug08 userR! 08 - Porzak, Customer Segmentation 62
Conclusion
11Aug08 userR! 08 - Porzak, Customer Segmentation 63
Follow up
● Slides and code will be up next week on
http://www.porzak.com/JimArchive/useR2008/
● Ping me with questions or comments:
jporzak@gmail.com
● Check out the San Francisco useR Group:
ia.meetup.com/67/
Thanks!
11Aug08 userR! 08 - Porzak, Customer Segmentation 64
Appendix
11Aug08 userR! 08 - Porzak, Customer Segmentation 65
section
11Aug08 userR! 08 - Porzak, Customer Segmentation 66
Code slide
##

More Related Content

What's hot (20)

PPTX
String function in my sql
knowledgemart
 
PPTX
Recommender Systems
Lior Rokach
 
PDF
Near Real Time Indexing: Presented by Umesh Prasad & Thejus V M, Flipkart
Lucidworks
 
PPTX
TYPES DATA STRUCTURES( LINEAR AND NON LINEAR)....
Shail Nakum
 
PDF
Recommendation engines
Georgian Micsa
 
PPTX
4 bit Binary counter
Jainee Solanki
 
PDF
Recommendation System Explained
Crossing Minds
 
PDF
Recommender Systems (Machine Learning Summer School 2014 @ CMU)
Xavier Amatriain
 
PDF
Pandas
maikroeder
 
PPTX
Recommendation System
Anamta Sayyed
 
PDF
R decision tree
Learnbay Datascience
 
PPT
Chapter 1( intro &amp; overview)
MUHAMMAD AAMIR
 
PDF
Artwork Personalization at Netflix
Justin Basilico
 
PDF
Recent advances in deep recommender systems
NAVER Engineering
 
PPTX
Tutorial on People Recommendations in Social Networks - ACM RecSys 2013,Hong...
Anmol Bhasin
 
PDF
Evaluation in Information Retrieval
Dishant Ailawadi
 
PDF
Use of data science in recommendation system
AkashPatil334
 
PPTX
Trigger
VForce Infotech
 
PDF
Customer Churn Prediction Using Machine Learning Techniques: the case of Lion...
IIJSRJournal
 
PPTX
Market Basket Analysis
Sandeep Prasad
 
String function in my sql
knowledgemart
 
Recommender Systems
Lior Rokach
 
Near Real Time Indexing: Presented by Umesh Prasad & Thejus V M, Flipkart
Lucidworks
 
TYPES DATA STRUCTURES( LINEAR AND NON LINEAR)....
Shail Nakum
 
Recommendation engines
Georgian Micsa
 
4 bit Binary counter
Jainee Solanki
 
Recommendation System Explained
Crossing Minds
 
Recommender Systems (Machine Learning Summer School 2014 @ CMU)
Xavier Amatriain
 
Pandas
maikroeder
 
Recommendation System
Anamta Sayyed
 
R decision tree
Learnbay Datascience
 
Chapter 1( intro &amp; overview)
MUHAMMAD AAMIR
 
Artwork Personalization at Netflix
Justin Basilico
 
Recent advances in deep recommender systems
NAVER Engineering
 
Tutorial on People Recommendations in Social Networks - ACM RecSys 2013,Hong...
Anmol Bhasin
 
Evaluation in Information Retrieval
Dishant Ailawadi
 
Use of data science in recommendation system
AkashPatil334
 
Customer Churn Prediction Using Machine Learning Techniques: the case of Lion...
IIJSRJournal
 
Market Basket Analysis
Sandeep Prasad
 

Viewers also liked (20)

PDF
Segmentation of Targeting
Kumar P
 
PDF
RFM Segmentation
Kamil Bartocha
 
PDF
RFM: A Cool Tool for Simple Analytics
C.TRAC Inc.
 
PDF
Customer Segmentation Masterclass - IIR 2010
Vladimir Dimitroff
 
PPTX
An Introduction to RFM in Analytics
SAS Canada
 
PDF
How to Create a Customer Segmentation Model
Mark Haubert
 
PPSX
Customer Segmentation with R - Deep Dive into flexclust
Jim Porzak
 
PDF
Customer segmentation
weave Belgium
 
PDF
Customer Clustering For Retail Marketing
Jonathan Sedar
 
PDF
Self-Organising Maps for Customer Segmentation using R - Shane Lynn - Dublin R
shanelynn
 
PPT
Cluster analysis for market segmentation
Vishal Tandel
 
PDF
RFM technical_brochure
RFM business-development
 
PDF
Rfm clustering analysis
air india
 
PDF
Behavioral Segmentation in AppMetrica
Alexander Lukin
 
PPTX
RFM Model Conversion Week
Andra Baragan
 
PDF
R workshop xiv--Survival Analysis with R
Vivian S. Zhang
 
PPTX
Behavioral Segmentation Analytics
Lance Wills
 
PPTX
Learn to Build an App to Find Similar Images using Deep Learning- Piotr Teterwak
PyData
 
PPTX
Important Information About Behavioral Segmentation Models
esavageus
 
PDF
Finding Meaning in Points, Areas and Surfaces: Spatial Analysis in R
Revolution Analytics
 
Segmentation of Targeting
Kumar P
 
RFM Segmentation
Kamil Bartocha
 
RFM: A Cool Tool for Simple Analytics
C.TRAC Inc.
 
Customer Segmentation Masterclass - IIR 2010
Vladimir Dimitroff
 
An Introduction to RFM in Analytics
SAS Canada
 
How to Create a Customer Segmentation Model
Mark Haubert
 
Customer Segmentation with R - Deep Dive into flexclust
Jim Porzak
 
Customer segmentation
weave Belgium
 
Customer Clustering For Retail Marketing
Jonathan Sedar
 
Self-Organising Maps for Customer Segmentation using R - Shane Lynn - Dublin R
shanelynn
 
Cluster analysis for market segmentation
Vishal Tandel
 
RFM technical_brochure
RFM business-development
 
Rfm clustering analysis
air india
 
Behavioral Segmentation in AppMetrica
Alexander Lukin
 
RFM Model Conversion Week
Andra Baragan
 
R workshop xiv--Survival Analysis with R
Vivian S. Zhang
 
Behavioral Segmentation Analytics
Lance Wills
 
Learn to Build an App to Find Similar Images using Deep Learning- Piotr Teterwak
PyData
 
Important Information About Behavioral Segmentation Models
esavageus
 
Finding Meaning in Points, Areas and Surfaces: Spatial Analysis in R
Revolution Analytics
 
Ad

Similar to Using R for customer segmentation (20)

PPTX
E-Commerce Customer Segmentation and Prediction: Unlocking Insights for Smart...
Boston Institute of Analytics
 
PPTX
"Ecommerce Customer Segmentation & Prediction: Enhancing Business Strategies ...
Boston Institute of Analytics
 
DOCX
Datasets using R-StudioUsha Rani Singh.docx
edwardmarivel
 
PPTX
Customer Segmentation Course 21102024(1).pptx
shivalikba25
 
PPTX
E-Commerce Customer Segmentation and Behavior Prediction: A Data-Driven Strategy
Boston Institute of Analytics
 
PPTX
Customer segmentation
Sathya Narayanan
 
PDF
IRJET- Credit Profile of E-Commerce Customer
IRJET Journal
 
PPTX
Moduel 2 _KPMG.pptx
JehanzebXheikh
 
PPTX
Smart Driver Alert: Predictive Fatigue Detection Technology
Boston Institute of Analytics
 
PPTX
Cdac -Project Presentation [Autosaved].pptx
anushriasati
 
PPTX
Is Your Marketing Database "Model Ready"?
Vivastream
 
PPT
Toys R Us, Segmentation Optimization Work Session Dec07
Leadership for Directors | VPs of CRM & Analytics in the Greater New York City Area
 
PPTX
Unlocking Insights: Advanced Customer Segmentation Strategies
Boston Institute of Analytics
 
PPSX
Data Refinement: The missing link between data collection and decisions
Vivastream
 
PDF
Hernan Litvac - eCommerce Day Africa Blended [Professional] Experience 2023
eCommerce Institute
 
PPTX
Is Your Marketing Database "Model Ready"?
Vivastream
 
PPTX
Customer Profiling
manish gupta
 
PDF
E-commerce Customer Segmentation and Predictive Modeling: Enhancing Marketing...
Boston Institute of Analytics
 
PPTX
E-commerce Customer Segmentation: Unlocking Consumer Insights
Boston Institute of Analytics
 
PPTX
RFMAnalysisShort.pptx
AyushSrivastava8761
 
E-Commerce Customer Segmentation and Prediction: Unlocking Insights for Smart...
Boston Institute of Analytics
 
"Ecommerce Customer Segmentation & Prediction: Enhancing Business Strategies ...
Boston Institute of Analytics
 
Datasets using R-StudioUsha Rani Singh.docx
edwardmarivel
 
Customer Segmentation Course 21102024(1).pptx
shivalikba25
 
E-Commerce Customer Segmentation and Behavior Prediction: A Data-Driven Strategy
Boston Institute of Analytics
 
Customer segmentation
Sathya Narayanan
 
IRJET- Credit Profile of E-Commerce Customer
IRJET Journal
 
Moduel 2 _KPMG.pptx
JehanzebXheikh
 
Smart Driver Alert: Predictive Fatigue Detection Technology
Boston Institute of Analytics
 
Cdac -Project Presentation [Autosaved].pptx
anushriasati
 
Is Your Marketing Database "Model Ready"?
Vivastream
 
Toys R Us, Segmentation Optimization Work Session Dec07
Leadership for Directors | VPs of CRM & Analytics in the Greater New York City Area
 
Unlocking Insights: Advanced Customer Segmentation Strategies
Boston Institute of Analytics
 
Data Refinement: The missing link between data collection and decisions
Vivastream
 
Hernan Litvac - eCommerce Day Africa Blended [Professional] Experience 2023
eCommerce Institute
 
Is Your Marketing Database "Model Ready"?
Vivastream
 
Customer Profiling
manish gupta
 
E-commerce Customer Segmentation and Predictive Modeling: Enhancing Marketing...
Boston Institute of Analytics
 
E-commerce Customer Segmentation: Unlocking Consumer Insights
Boston Institute of Analytics
 
RFMAnalysisShort.pptx
AyushSrivastava8761
 
Ad

Recently uploaded (20)

PDF
Development and validation of the Japanese version of the Organizational Matt...
Yoga Tokuyoshi
 
PPTX
apidays Helsinki & North 2025 - API access control strategies beyond JWT bear...
apidays
 
PDF
What does good look like - CRAP Brighton 8 July 2025
Jan Kierzyk
 
PDF
apidays Helsinki & North 2025 - API-Powered Journeys: Mobility in an API-Driv...
apidays
 
PPTX
apidays Munich 2025 - Building Telco-Aware Apps with Open Gateway APIs, Subhr...
apidays
 
PPTX
apidays Helsinki & North 2025 - Vero APIs - Experiences of API development in...
apidays
 
PDF
The European Business Wallet: Why It Matters and How It Powers the EUDI Ecosy...
Lal Chandran
 
PPTX
Advanced_NLP_with_Transformers_PPT_final 50.pptx
Shiwani Gupta
 
PPTX
apidays Helsinki & North 2025 - From Chaos to Clarity: Designing (AI-Ready) A...
apidays
 
PDF
Simplifying Document Processing with Docling for AI Applications.pdf
Tamanna
 
PDF
apidays Singapore 2025 - How APIs can make - or break - trust in your AI by S...
apidays
 
PPT
Growth of Public Expendituuure_55423.ppt
NavyaDeora
 
PPTX
apidays Helsinki & North 2025 - APIs at Scale: Designing for Alignment, Trust...
apidays
 
PDF
Avatar for apidays apidays PRO June 07, 2025 0 5 apidays Helsinki & North 2...
apidays
 
PPTX
SlideEgg_501298-Agentic AI.pptx agentic ai
530BYManoj
 
PDF
Product Management in HealthTech (Case Studies from SnappDoctor)
Hamed Shams
 
PPTX
Numbers of a nation: how we estimate population statistics | Accessible slides
Office for National Statistics
 
PPTX
b6057ea5-8e8c-4415-90c0-ed8e9666ffcd.pptx
Anees487379
 
PPT
AI Future trends and opportunities_oct7v1.ppt
SHIKHAKMEHTA
 
PDF
apidays Helsinki & North 2025 - APIs in the healthcare sector: hospitals inte...
apidays
 
Development and validation of the Japanese version of the Organizational Matt...
Yoga Tokuyoshi
 
apidays Helsinki & North 2025 - API access control strategies beyond JWT bear...
apidays
 
What does good look like - CRAP Brighton 8 July 2025
Jan Kierzyk
 
apidays Helsinki & North 2025 - API-Powered Journeys: Mobility in an API-Driv...
apidays
 
apidays Munich 2025 - Building Telco-Aware Apps with Open Gateway APIs, Subhr...
apidays
 
apidays Helsinki & North 2025 - Vero APIs - Experiences of API development in...
apidays
 
The European Business Wallet: Why It Matters and How It Powers the EUDI Ecosy...
Lal Chandran
 
Advanced_NLP_with_Transformers_PPT_final 50.pptx
Shiwani Gupta
 
apidays Helsinki & North 2025 - From Chaos to Clarity: Designing (AI-Ready) A...
apidays
 
Simplifying Document Processing with Docling for AI Applications.pdf
Tamanna
 
apidays Singapore 2025 - How APIs can make - or break - trust in your AI by S...
apidays
 
Growth of Public Expendituuure_55423.ppt
NavyaDeora
 
apidays Helsinki & North 2025 - APIs at Scale: Designing for Alignment, Trust...
apidays
 
Avatar for apidays apidays PRO June 07, 2025 0 5 apidays Helsinki & North 2...
apidays
 
SlideEgg_501298-Agentic AI.pptx agentic ai
530BYManoj
 
Product Management in HealthTech (Case Studies from SnappDoctor)
Hamed Shams
 
Numbers of a nation: how we estimate population statistics | Accessible slides
Office for National Statistics
 
b6057ea5-8e8c-4415-90c0-ed8e9666ffcd.pptx
Anees487379
 
AI Future trends and opportunities_oct7v1.ppt
SHIKHAKMEHTA
 
apidays Helsinki & North 2025 - APIs in the healthcare sector: hospitals inte...
apidays
 

Using R for customer segmentation

  • 1. Using R for Customer Segmentation useR! 2008 Dortmund, Germany August, 2008 Jim Porzak, Senior Director of Analytics Responsys, Inc. San Francisco, California
  • 2. 11Aug08 userR! 08 - Porzak, Customer Segmentation 2 Outline ● Two main case study examples – Customer purchase behavior data ● Goal: actionable segments to improve LTV of customer base – Prospect intent & interest survey data ● Goal: actionable segments to better target messaging content and tactics ● Real data from real clients (sanitized) ● Workshop format – Hands on – Discussion heavy
  • 3. 11Aug08 userR! 08 - Porzak, Customer Segmentation 3 Introduction
  • 4. 11Aug08 userR! 08 - Porzak, Customer Segmentation 4 Why Segment? ● Better communication with customers and prospects – Recipient should feel that we understand him or her as an individual – “Send the right message to the right person at the right time” ● Challenges: – Widely applicable ● General rules based on readily available data ● A new contact can be placed in their segment easily – Usable ● Marketing can relate ● Technology can deliver
  • 5. 11Aug08 userR! 08 - Porzak, Customer Segmentation 5 Segmentation in Practice
  • 6. 11Aug08 userR! 08 - Porzak, Customer Segmentation 6 Behavioral Segmentation
  • 7. 11Aug08 userR! 08 - Porzak, Customer Segmentation 7 What's Behavioral Segmentation? ● Based on what people actually do – Not on what that say they do ● Purchase behavior – Discuss examples... ● Usage behavior – Discuss examples...
  • 8. 11Aug08 userR! 08 - Porzak, Customer Segmentation 8 Why do Behavioral Segmentation? ● All comes down to interacting with your customer or prospect in the appropriate way – From customers perspective, not yours! ● Ideally a “one-to-one” interaction – Not practical in today's world – Goal: perceived by customer as “one-to-one”
  • 9. 11Aug08 userR! 08 - Porzak, Customer Segmentation 9 Today's Purchase Behavior Data Set ● Actual web & phone sales records (sanitized) – 541k order detail lines – 135k Customers – Over 2 ½ years – Of ~900 different products – In 5 product categories ● Conventional wisdom – Strong seasonality – Have a loyal customer base – But, have retention problem
  • 10. 11Aug08 userR! 08 - Porzak, Customer Segmentation 10 What we know Date: 10/10/07 Order #: 12345 Customer: 3894832 Sue Smith 1 Short Street Qty SKU Description Unit Price Ext Price 1 123 1.50 1.50 3 345 White Widget 2.00 6.00 Total 7.50 Tax 0.60 Shipping 2.00 Grand Total 10.10 Smallville, ND, 39248 Green Gizzmo Imagine a customer order form: We get the highlighted data. Plus: order channel and product (SKU) category
  • 11. 11Aug08 userR! 08 - Porzak, Customer Segmentation 11 Preloaded as “orders” data frame > load("BehavioralDataSet.Rda") > str(orders) 'data.frame': 541101 obs. of 9 variables: $ SKU_ID : int 459 459 459 459 459 459 459 459 459 459 ... $ ChannelID: int 3 4 3 3 3 3 4 3 3 3 ... $ CustID : int 134945 212174 39861 11227 137271 60982 ... $ OrderID : int 326324 109305 172669 132642 20449 40826 ... $ OrderDate:Class 'Date' num [1:541101] 13211 13649 13670 ... $ Quantity : int 1 2 1 3 1 1 1 1 1 1 ... $ Amount : num 18 36 18 54 18 18 18 18 18 18 ... $ Channel : Factor w/ 4 levels "phone1","phone2",..: 3 4 3 3 ... $ Category : Factor w/ 7 levels "*","C","G","I",..: 3 3 3 3 3 ...
  • 12. 11Aug08 userR! 08 - Porzak, Customer Segmentation 12 orders summary > summary(orders[-(1:2)]) CustID OrderID OrderDate Quantity Min. : 2 Min. : 2 Min. :2005-09-01 Min. : 0.000 1st Qu.: 62221 1st Qu.:105292 1st Qu.:2006-07-18 1st Qu.: 1.000 Median :124343 Median :210908 Median :2007-02-14 Median : 1.000 Mean :152974 Mean :207535 Mean :2007-03-11 Mean : 1.113 3rd Qu.:185119 3rd Qu.:315711 3rd Qu.:2007-12-04 3rd Qu.: 1.000 Max. :506929 Max. :388319 Max. :2008-07-14 Max. :275.000 NA's : 4 Amount Channel Category Min. : 0.01 phone1: 14303 *: 0 1st Qu.: 20.00 phone2: 90 C:142147 Median : 30.00 web1 :451354 G:114300 Mean : 31.81 web2 : 75354 I: 14961 3rd Qu.: 35.00 N: 50385 Max. :4577.00 T:199354 X: 19954
  • 13. 11Aug08 userR! 08 - Porzak, Customer Segmentation 13 Goal of this exercise? ● Marketers need to come up with a communication strategy & associated tactics which will entice customers to exhibit higher LTV – Long Term Value. ● Segment by past purchase behavior to provide actionable subsets of customers – When marketers use our subsets, they get measurably better results than previous “one size fits all” method.
  • 14. 11Aug08 userR! 08 - Porzak, Customer Segmentation 14 How are we going to do this? (Discussion)
  • 15. 11Aug08 userR! 08 - Porzak, Customer Segmentation 15 Hints ● Live Stage ● Value ● Engagement ● Favorite Products ● Timing
  • 16. 11Aug08 userR! 08 - Porzak, Customer Segmentation 16 Recency, Frequency, & Monetary Metrics ● Recency – How long ago was last purchase? (days) – Measured for “As Of Date” of data set ● Frequency – How many orders in analysis period (2 ½ years) – Attempting to measure engagement ● Monetary – What is total $ value of all orders in analysis period Question: Do you expect these three to be uncorrelated?
  • 17. 11Aug08 userR! 08 - Porzak, Customer Segmentation 17 An Aside: Classical RFM ● Invented by direct marketers in 1950's as a way to model response rates (before good stat software was readily available) ● One typical method – R, F, & M each scored in quantile (typically 5) – Combined score for each recipient was concatenation of the three digits, eg “351” – Scores ranked by empirical response rate – Mailing then done to top xx% of list ● Today we use, lm, glm, randomForest, ... ● But, concepts still valid as conceptional model ● And, R & F measures typically very important in any predictive model
  • 18. 11Aug08 userR! 08 - Porzak, Customer Segmentation 18 I also typically include... ● Breadth – How many different SKUs purchased? ● Tenure – How long as customer been with us?
  • 19. 11Aug08 userR! 08 - Porzak, Customer Segmentation 19 Next Step – Aggregate by Customer ● We need some “raw” RFM values ● Make the data frame “RFM_raw” – CustomerID: the business key back to database – FirstPurchaseDate: interesting for tenure metric – LastPurchaseDate: basis of Recency – NumberOrders: basis of Frequency – NumberSKUs: basis of Breadth (engagement metric) – TotalAmount: basis of Monetary ● Also calculate – AsOfDate <- max(LastPurchaseDate)
  • 20. 11Aug08 userR! 08 - Porzak, Customer Segmentation 20 Building the RFM_raw data frame ## for performance, make OrderDate an integer during aggregation orders_n <- orders orders_n$OrderDate <- as.integer(orders_n$OrderDate) ## build up one column at a time RFM_raw <- with(orders_n, data.frame(CustomerID = sort(unique(CustID)))) RFM_raw <- cbind(RFM_raw, FirstPurchaseDate = with(orders_n, as.Date(as.integer(by(OrderDate, CustID, min)), "1970-01-01"))) RFM_raw <- cbind(RFM_raw, LastPurchaseDate = with(orders_n, as.Date(as.integer(by(OrderDate, CustID, max)), "1970-01-01"))) RFM_raw <- cbind(RFM_raw, NumberOrders = with(orders_n, as.numeric(by(OrderID, CustID, function(x) length(unique(x)))))) RFM_raw <- cbind(RFM_raw, NumberSKUs = with(orders_n, as.numeric(by(SKU_ID, CustID, function(x) length(unique(x)))))) RFM_raw <- cbind(RFM_raw, TotalAmount = with(orders_n, as.numeric(by(Amount, CustID, sum)))) AsOfDate <- max(RFM_raw$LastPurchaseDate) save(RFM_raw, AsOfDate, file = "RFM_raw.Rda") This take a while (1 ½ minutes on my laptop). You may want to download RFM_raw.Rda
  • 21. 11Aug08 userR! 08 - Porzak, Customer Segmentation 21 Do some RMF EDA ## Jim's miscellaneous DMA functions source("dma_misc.R") ## for interactive games: attach(RFM_raw) ## EDA plots using base graphics rfm.plot(as.numeric(AsOfDate - LastPurchaseDate) %/% 7, "rec") rfm.plot(NumberOrders, "freq") rfm.plot(TotalAmount, "mon") rfm.plot(NumberSKUs, "breadth") ## EDA plots using iPlots ihist(as.numeric(AsOfDate - LastPurchaseDate) %/% 7, title = "Recency") ihist(NumberOrders, title = "Frequency") ihist(TotalAmount, title = "Monetary") ihist(NumberSKUs, title = "Breadth")
  • 22. 11Aug08 userR! 08 - Porzak, Customer Segmentation 22 RFM EDA Plots In all cases, “best is left.”
  • 23. 11Aug08 userR! 08 - Porzak, Customer Segmentation 23 Assign reasonable RFM breaks ● Recency: – Breaks (weeks <=): 25, 51, 77, 103, <else> – levels = c("0-5", "6-11", "12-17", "18-23", "24-29")) ● Note levels labeled in months, not weeks ● Frequency: – Breaks (count <=): 1, 3, 7, <else> – levels = c("8+", "7-4", "3-2", "1")) ● Note ordering for best is left. ● Monetary: – Breaks (value <=): 50, 100, 200, 400, <else> – levels = c("401+", "400-201", "200-101", "100-51", "50-0")) ● Again ordering is best is left.
  • 24. 11Aug08 userR! 08 - Porzak, Customer Segmentation 24 Build RFM_segs data frame RFM_segs <- data.frame(Recency_weeks = as.numeric(AsOfDate - RFM_raw$LastPurchaseDate) %/% 7) row.names(RFM_segs) <- row.names(RFM_raw) ## now label levels with months rather than weeks RFM_segs$Recency <- ordered(ifelse(RFM_segs$Recency_weeks <= 25, "0-5", ifelse(RFM_segs$Recency_weeks <= 51, "6-11", ifelse(RFM_segs$Recency_weeks <= 77, "12-17", ifelse(RFM_segs$Recency_weeks <= 103, "18-23", "24-29")))), levels = c("0-5", "6-11", "12-17", "18-23", "24-29")) RFM_segs$Frequency_count <- RFM_raw$NumberOrders RFM_segs$Frequency <- ordered(ifelse(RFM_segs$Frequency_count == 1, "1", ifelse(RFM_segs$Frequency_count <= 3, "3-2", ifelse(RFM_segs$Frequency_count <= 7, "7-4", "8+"))), levels = c("8+", "7-4", "3-2", "1")) RFM_segs$Monetary_value <- RFM_raw$TotalAmount RFM_segs$Monetary <- ordered(ifelse(RFM_segs$Monetary_value <= 50, "50-0", ifelse(RFM_segs$Monetary_value <= 100, "100-51", ifelse(RFM_segs$Monetary_value <= 200, "200-101", ifelse(RFM_segs$Monetary_value <= 400, "400-201", "401+")))), levels = c("401+", "400-201", "200-101", "100-51", "50-0"))
  • 25. 11Aug08 userR! 08 - Porzak, Customer Segmentation 25 We typically also add Breadth & Tenure: RFM_segs$Breadth_count <- RFM_raw$NumberSKUs RFM_segs$Breadth <- ordered(ifelse(RFM_segs$Breadth_count == 1, "1", ifelse(RFM_segs$Breadth_count == 2, "2", ifelse(RFM_segs$Breadth_count <= 4, "4-3", ifelse(RFM_segs$Breadth_count <= 9, "9-5", "10+")))), levels = c("10+", "9-5", "4-3", "2", "1")) RFM_segs$Tenure_weeks <- as.numeric(AsOfDate - FirstPurchaseDate) %/% 7 RFM_segs$Tenure <- ordered(ifelse(RFM_segs$Tenure_weeks <= 12, "0-12", ifelse(RFM_segs$Tenure_weeks <= 25, "13-25", ifelse(RFM_segs$Tenure_weeks <= 38, "26-38", ifelse(RFM_segs$Tenure_weeks <= 51, "39-51", ifelse(RFM_segs$Tenure_weeks <= 64, "52-64", ifelse(RFM_segs$Tenure_weeks <= 77, "65-77", ifelse(RFM_segs$Tenure_weeks <= 90, "78-90", ifelse(RFM_segs$Tenure_weeks <= 103, "91-103", "104+")))))))), levels = c("104+", "91-103", "78-90", "65-77", "52-64", "39-51", "26-38", "13-25", "0-12")) save(RFM_segs, file = "RFM_segs.Rda")
  • 26. 11Aug08 userR! 08 - Porzak, Customer Segmentation 26 How do customers look in RFM space? ● I like mosaic plots (& especially vcd* package!) ● Set up a “structure table” with assignments: ● And a convenience function for mosaic: require(vcd) RFM_st <- structable(~ Recency + Frequency + Monetary + Breadth, data = RFM_segs) mm <- function(f) { mosaic(f, data = RFM_st, shade = TRUE, labeling_args = list(rot_labels = c(left = 90, top = 45), just_labels = c(left = "left", top = "center")), spacing = spacing_dimequal(unit(c(0.5, 0.8), "lines")), keep_aspect_ratio = FALSE ) } * To learn more, attend: The strucplot framework for Visualizing Categorical Data. Wed, 11:30. E29
  • 27. 11Aug08 userR! 08 - Porzak, Customer Segmentation 27 mm(~ Recency + Frequency)
  • 28. 11Aug08 userR! 08 - Porzak, Customer Segmentation 28 mm(~ Frequency + Monetary)
  • 29. 11Aug08 userR! 08 - Porzak, Customer Segmentation 29 mm(~ Recency + Monetary)
  • 30. 11Aug08 userR! 08 - Porzak, Customer Segmentation 30 mm(~ Breadth + Monetary)
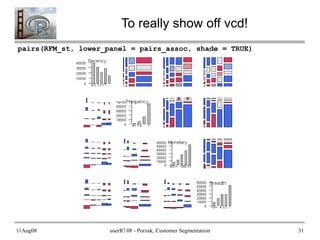
  • 31. 11Aug08 userR! 08 - Porzak, Customer Segmentation 31 To really show off vcd! pairs(RFM_st, lower_panel = pairs_assoc, shade = TRUE)
  • 32. 11Aug08 userR! 08 - Porzak, Customer Segmentation 32 Time to get real – remember goal?
  • 33. 11Aug08 userR! 08 - Porzak, Customer Segmentation 33 Actionable for Marketers The big two concepts: 1. Lifestage 2. Value Turns out we can do both with Recency & Frequency!
  • 34. 11Aug08 userR! 08 - Porzak, Customer Segmentation 34 Use Balloon Plots to Communicate require(gplots) # Recency by Frequence - Counts RxF <- as.data.frame(table(RFM_segs$Recency, RFM_segs$Frequency, dnn = c("Recency", "Frequency")), responseName = "Number_Customers") with(RxF, balloonplot(Recency, Frequency, Number_Customers, zlab = "# Customers")) # Recency by Frequency - Annual Value (total annual sales to segment) VbyRxF <- (aggregate(RFM_segs$Monetary_value, by = list(Recency = factor(RFM_segs$Recency), Frequency = RFM_segs$Frequency), sum)) names(VbyRxF)[3] <- "Annual_Sales" VbyRxF$Annual_Sales <- VbyRxF$Annual_Sales / (28/12) ## normalize to annual revnue with(VbyRxF, balloonplot(Recency, Frequency, Annual_Sales / 1000, zlab = "Annual Sales (000)"))
  • 35. 11Aug08 userR! 08 - Porzak, Customer Segmentation 35 Recency by Frequency - Counts
  • 36. 11Aug08 userR! 08 - Porzak, Customer Segmentation 36 Recency by Frequency - Value
  • 37. 11Aug08 userR! 08 - Porzak, Customer Segmentation 37 Exercise – Assign Segments ● Lifestage “dimension” – New – Active – Lapsed – Lost ● Value “dimension” – Gold – Silver – Bronze ● Combined as – High Value, Repeat, New, One-time, Lapsed, & Lost
  • 38. 11Aug08 userR! 08 - Porzak, Customer Segmentation 38 Color & Label Segment Cells # a matrix of segment codes RF_segs0 <- matrix("", nrow = 4, ncol = 5) # manually make assignments object.browser() ## Fill in H, R, N, L, or O. Save as RF_segs.txt # get back into R RF_segs <- as.matrix(read.delim("RF_segs.txt", sep = "t", na.strings = "")) RF_segs[is.na(RF_segs)] <- "X" ## N/A's become “Lost” # add colors and labels to balloon plot # Magic values for balloon cell centers RF_x <- matrix(2:6 + 0.25, nrow = 4, ncol = 5, byrow = TRUE) RF_y <- matrix(4:1, nrow = 4, ncol = 5, byrow = FALSE) RF_cols <- sapply(RF_segs, function(x) switch(x, H="gold", R="slategray2", N="green", L="yellow", O="darkgreen", "red")) points(RF_x, RF_y, col = RF_cols, pch = 16, cex = 12) text(RF_x, RF_y, RF_segs, cex = 2)
  • 39. 11Aug08 userR! 08 - Porzak, Customer Segmentation 39 Final Segments for Marketers
  • 40. 11Aug08 userR! 08 - Porzak, Customer Segmentation 40 Conceptual RF Segments
  • 41. 11Aug08 userR! 08 - Porzak, Customer Segmentation 41 Break Time!
  • 42. 11Aug08 userR! 08 - Porzak, Customer Segmentation 42 Attitudinal Segmentation
  • 43. 11Aug08 userR! 08 - Porzak, Customer Segmentation 43 Marketing Challenge ● Our client offers free download of software with high perceived value, but ● First asks user to fill out a simple survey ● Challenge is to come up with a “few” segments that will be used by segment to: – Prioritize contact strategy – Craft marketing messages based on profile
  • 44. 11Aug08 userR! 08 - Porzak, Customer Segmentation 44 Sample Data ● Surveys from 20k respondents ● All within same time frame (a number of weeks) ● All requested the software download
  • 45. 11Aug08 userR! 08 - Porzak, Customer Segmentation 45 Survey Description ● 35 check boxes or radio buttons – None required. Coded as binary responses ● Arranged in 5 sections – License: W and/or X – Role: one of D, SA, ITM, ITA, Str, Oth (radio buttons) – System: any of S, T, A, B, C, D, O (check boxes) – Interest: any of M, O Pl, Pr, Sup, 64, Con, Per, DT, Z, Oth. (check boxes) – Application: any of Web, Inf, Col, Db, J2, Top, Dev, Per, Other (check boxes)
  • 46. 11Aug08 userR! 08 - Porzak, Customer Segmentation 46 Data Set Provided as data frame csb, in InterestPreferenceSurvey.Rda # Getting started setwd("C:/Data/useR08/R") require(lattice) require(grDevices) require(vcd) require(flexclust) load(file = "InterestPreferenceSurvey.Rda") str(csb) 'data.frame': 20000 obs. of 35 variables: $ Lic_W : int 0 0 0 0 0 0 0 0 0 0 ... $ Lic_X : int 1 1 1 0 1 1 1 1 1 1 ... $ Role_D : int 0 0 0 0 0 0 0 0 1 0 ... $ Role_SA : int 0 0 1 0 1 0 0 1 0 0 ... $ Role_ITM: int 0 0 0 1 0 0 0 0 0 0 ... $ Role_ITA: int 0 0 0 0 0 0 0 0 0 0 ...
  • 47. 11Aug08 userR! 08 - Porzak, Customer Segmentation 47 Proportion Responders by Question > mean(csb) Lic_W Lic_X Role_D Role_SA Role_ITM Role_ITA Role_Stu Role_Oth 0.16040 0.90980 0.19905 0.32910 0.06905 0.08465 0.21080 0.05090 Sys_S Sys_T Sys_A Sys_B Sys_C Sys_D Sys_O Int_M 0.17780 0.39720 0.17020 0.13975 0.09325 0.03510 0.19260 0.36960 Int_O Int_Pl Int_Pr Int_Sup Int_64 Int_Con Int_Per Int_DT 0.46810 0.09395 0.10055 0.08985 0.23445 0.21235 0.31420 0.11790 Int_Z Int_Oth Ap_Web Ap_Inf Ap_Col Ap_Db Ap_J2 Ap_Top 0.23450 0.05995 0.39640 0.19125 0.18365 0.30125 0.19455 0.30145 Ap_Dev Ap_Per Ap_Other 0.18960 0.20050 0.03735
  • 48. 11Aug08 userR! 08 - Porzak, Customer Segmentation 48 Clustering Strategy ● flexclust package by Fritz Leisch ● See his 2006 paper (on his personal page): A Toolbox for K-Centroids Cluster Analysis ● This is (mostly) an optional response type survey – 1 = “yes” is significant – 0 is just absence not really a “no” – Respondents checking Role_SA have much more in common than those not checking Role_SA ● Following Fritz's argument we use the expectation based Jaccard distance measure.
  • 49. 11Aug08 userR! 08 - Porzak, Customer Segmentation 49 A First Cluster Run require(flexclust) ## set up flexclust control object fc_cont <- new("flexclustControl") fc_cont@tolerance <- 0.1 ## this doesn't seem to work as expected [email protected] <- 30 ## seems to be effective convergence ##fc_cont@verbose <- 1 ## set TRUE if to see each step my_seed <- 0 my_family <- "ejaccard" num_clust <- 4 my_seed <- my_seed + 1 set.seed(my_seed) cl <- kcca(csb, k = num_clust, save.data = TRUE, control = fc_cont, family = kccaFamily(my_family)) ## This takes ~ 1.5 min. on my laptop
  • 50. 11Aug08 userR! 08 - Porzak, Customer Segmentation 50 Cluster Summary > summary(cl) kcca object of family 'ejaccard' call: kcca(x = csb, k = num_clust, family = kccaFamily(my_family), control = fc_cont, save.data = TRUE) cluster info: size av_dist max_dist separation 1 5551 0.7159832 1 0.6766653 2 4577 0.7707523 1 0.7437616 3 2535 0.7482347 1 0.7038259 4 7337 0.7215583 1 0.6732479 no convergence after 200 iterations sum of within cluster distances: 14693.00
  • 51. 11Aug08 userR! 08 - Porzak, Customer Segmentation 51 Run Plots pop_av_dist <- with(cl@clusinfo, sum(size*av_dist)/sum(size)) main_txt <- paste("kcca ", c1@family@name, " - ", num_clust, " clusters (", nsamp, "k sample, seed = ", my_seed, ")", sep = "") # Neighborhood Graph on 1st principle components csb.pca <- prcomp(csb) plot(cl, data = as.matrix(csb), project = csb.pca, main = main_txt, sub = paste("nAv Dist = ", format(pop_av_dist, digits = 5), ", k = ", c1@k, sep = "") ) # Activity Profiles for each segment print(barchart(cl, main = main_txt, strip.prefix = "#", scales = list(cex = 0.6)))
  • 52. 11Aug08 userR! 08 - Porzak, Customer Segmentation 52 Plots (k=4, seed = 1)
  • 53. 11Aug08 userR! 08 - Porzak, Customer Segmentation 53 Plots (k=4, seed = 2)
  • 54. 11Aug08 userR! 08 - Porzak, Customer Segmentation 54 Plots (k=4, seed = 3)
  • 55. 11Aug08 userR! 08 - Porzak, Customer Segmentation 55 Are any of these any good? ● If so, which? ● How to decide? ● Quoting Fritz (pg 15): The actual choice of expectation-based Jaccard with K = 6 clusters ... has been made manually by comparing various solutions and selecting the one which made most sense from the practitioners point of view. This may seem unsatisfying because the decision is subjective, but cluster analysis here is used as a tool for exploratory data analysis and offers simplified views of a complex data set.
  • 56. 11Aug08 userR! 08 - Porzak, Customer Segmentation 56 Our Selection Criteria 1. Choice of k, must have mostly ~ stable solutions, and 2. Cluster profiles must be interpretable. IOW, what is the story you can tell about each cluster? Will the marketers relate to it?
  • 57. 11Aug08 userR! 08 - Porzak, Customer Segmentation 57 Your Challenge... Do what Fritz said: The actual choice ... has been made manually by comparing various solutions and selecting the one which made most sense. Here are 4 runs for each k = 3 to 8; 24 in all. Pick the “best” one, make up stories for each cluster, and explain your choice to group.
  • 58. 11Aug08 userR! 08 - Porzak, Customer Segmentation 58 For the Record. Jim's Pick:
  • 59. 11Aug08 userR! 08 - Porzak, Customer Segmentation 59 Jim's Stories Based on knowing a bit more about the client than I can share with you. #1: An “S” loyalist, high % SA's #2: Favors name brands, high responders #3: A “T” loyalist, broad but reduced responses #4: Favors name brands, but otherwise low resp. #5: Student, gray box, open source, desktop.
  • 60. 11Aug08 userR! 08 - Porzak, Customer Segmentation 60 Finally, using predict in flexclust Once we (analysts & marketers) have decided on a clustering model, we want to use it to assign new respondents to likely segment. flexclust includes predict: persona <- predict(cl, csb) head(persona) str(persona) PersonaPredict <- as.data.frame(persona) names(PersonaPredict) <- "cluster" > table(PersonaPredict) PersonaPredict 1 2 3 4 5 2313 6479 4654 2702 3852
  • 61. 11Aug08 userR! 08 - Porzak, Customer Segmentation 61 Closing the Loop – Tying Back to Purchase Model Where ppBand is probability of purchase band ( 0 = 0.0 – 0.999, 1 = 0.10 – 0.199, … 9 = 0.90 – 0.999). IOW, 0 is really low & 9 is really high probability of purchase according to the model
  • 62. 11Aug08 userR! 08 - Porzak, Customer Segmentation 62 Conclusion
  • 63. 11Aug08 userR! 08 - Porzak, Customer Segmentation 63 Follow up ● Slides and code will be up next week on http://www.porzak.com/JimArchive/useR2008/ ● Ping me with questions or comments: [email protected] ● Check out the San Francisco useR Group: ia.meetup.com/67/ Thanks!
  • 64. 11Aug08 userR! 08 - Porzak, Customer Segmentation 64 Appendix
  • 65. 11Aug08 userR! 08 - Porzak, Customer Segmentation 65 section
  • 66. 11Aug08 userR! 08 - Porzak, Customer Segmentation 66 Code slide ##