Virtual Flink Forward 2020: Lessons learned on Apache Flink application availability in a hosted Apache Flink service - Praveen Gattu, Hwanju Kim, Ryan Nienhuis
Download as PPTX, PDF1 like318 views

The document discusses real-time interaction with streaming data using Amazon Kinesis and Apache Flink, highlighting the challenges of measuring application availability due to issues like resource exhaustion and system failures. It suggests various metrics for tracking uptime and downtime, the importance of differentiating user and system failures, and the need for robust monitoring and health detection mechanisms. Additionally, it lays out a framework for improving metrics related to job execution and exception classification in Flink applications.


![© 2020, Amazon Web Services, Inc. or its Affiliates. All rights reserved.
[DISCUSS] Proposal for Flink job execution/availability metrics
improvment
[Design] Flink Job Execution Tracking
[Design] Flink Exception Classifier for Downtime Cause Classificaiton](https://image.slidesharecdn.com/lessonslearnedonapacheflinkapplicationavailability-final-200506101650/85/Virtual-Flink-Forward-2020-Lessons-learned-on-Apache-Flink-application-availability-in-a-hosted-Apache-Flink-service-Praveen-Gattu-Hwanju-Kim-Ryan-Nienhuis-41-320.jpg)

More Related Content


Similar to Virtual Flink Forward 2020: Lessons learned on Apache Flink application availability in a hosted Apache Flink service - Praveen Gattu, Hwanju Kim, Ryan Nienhuis (20)


More from Flink Forward (20)


Virtual Flink Forward 2020: Lessons learned on Apache Flink application availability in a hosted Apache Flink service - Praveen Gattu, Hwanju Kim, Ryan Nienhuis
- 1. © 2020, Amazon Web Services, Inc. or its Affiliates. All rights reserved.
- 2. © 2020, Amazon Web Services, Inc. or its Affiliates. All rights reserved. Hello World Hwanju Kim Sr Software Engineer Amazon Kinesis Praveen Gattu Sr Software Dev Manager Amazon Kinesis
- 3. © 2020, Amazon Web Services, Inc. or its Affiliates. All rights reserved.
- 4. © 2020, Amazon Web Services, Inc. or its Affiliates. All rights reserved.
- 5. © 2020, Amazon Web Services, Inc. or its Affiliates. All rights reserved.
- 6. © 2020, Amazon Web Services, Inc. or its Affiliates. All rights reserved. • Interact with streaming data in real time using SQL or integrated Apache Flink applications • Build fully managed and elastic stream processing applications
- 7. © 2020, Amazon Web Services, Inc. or its Affiliates. All rights reserved. Build applications in your IDE of choice using Apache Flink Upload your application code to Kinesis Data Analytics Run your application in a fully managed and elastic service APIs to update, stop an app APIs for state management 1 2 3
- 8. © 2020, Amazon Web Services, Inc. or its Affiliates. All rights reserved.
- 9. © 2020, Amazon Web Services, Inc. or its Affiliates. All rights reserved.
- 10. © 2020, Amazon Web Services, Inc. or its Affiliates. All rights reserved.
- 11. © 2020, Amazon Web Services, Inc. or its Affiliates. All rights reserved. Problems Measuring Availability: How to measure availability of an Apache Flink Cluster
- 12. © 2020, Amazon Web Services, Inc. or its Affiliates. All rights reserved.
- 13. © 2020, Amazon Web Services, Inc. or its Affiliates. All rights reserved.
- 14. © 2020, Amazon Web Services, Inc. or its Affiliates. All rights reserved.
- 15. © 2020, Amazon Web Services, Inc. or its Affiliates. All rights reserved. KDA-Apache Flink Applications can go down for various reasons: • System/Infrastructure Issues • Customer Application Code Issues
- 16. © 2020, Amazon Web Services, Inc. or its Affiliates. All rights reserved. In our experience application code issues cause most of the issues • Sources and sinks not present • Permission issues with sources and sinks • Resource exhaustion • Out of memory • Too many open files
- 17. © 2020, Amazon Web Services, Inc. or its Affiliates. All rights reserved. How to Measure Application Availability
- 18. © 2020, Amazon Web Services, Inc. or its Affiliates. All rights reserved.
- 19. © 2020, Amazon Web Services, Inc. or its Affiliates. All rights reserved. + Accurate high-level downtime from user’s perspective - Too application-specific to be measured by service provider + Straightforward to be measured by service provider - Low-level downtime from user’s perspective User can rely on various other metrics for app-level downtime depending on their use cases (e.g., source latency, event time lag, etc)
- 20. © 2020, Amazon Web Services, Inc. or its Affiliates. All rights reserved. CREATED RUNNING FAILING RESTARTING UptimeDowntime No!Full state machine: https://ci.apache.org/projects/flink/flink-docs-stable/internals/job_scheduling.html
- 21. © 2020, Amazon Web Services, Inc. or its Affiliates. All rights reserved. RUNNING Task Job Graph SCHEDULED DEPLOYING RUNNING Allocate task manager’s slot for a task Deploy a task to an allocated slot Invoke user-defined function of a task Actual running state
- 22. © 2020, Amazon Web Services, Inc. or its Affiliates. All rights reserved. RUNNING SCHEDULED DEPLOYING RUNNING SCHEDULED DEPLOYING RUNNING SCHEDULED DEPLOYING RUNNING SCHEDULED DEPLOYING RUNNING Task Job Graph Task Task Task Need to track individual task states
- 23. © 2020, Amazon Web Services, Inc. or its Affiliates. All rights reserved. CREATED SCHEDULING (sub state) DEPLOYING (sub state) RUNNING (sub state) FAILINGRESTARTING Once a task firstly is scheduled Once a task starts being deployed Once all tasks transition to running Measure elapsed time for each state
- 24. © 2020, Amazon Web Services, Inc. or its Affiliates. All rights reserved. Job tracking state Elapsed time CREATED 3s SCHEDULING 20s DEPLOYING 28s RUNNING 125000s FAILING 15s RESTARTING 10s • RUNNING time is uptime, otherwise downtime • Better uptime metric than RUNNING job state • No false measurement of scheduling/deploying time as uptime • Downtime is effectively time spent in fail-over states • What caused fail-over? • Next topic Why? ? ? ? ? ? ?
- 25. © 2020, Amazon Web Services, Inc. or its Affiliates. All rights reserved.
- 26. © 2020, Amazon Web Services, Inc. or its Affiliates. All rights reserved. CREATED SCHEDULING (sub state) DEPLOYING (sub state) RUNNING (sub state) FAILINGRESTARTING Exception slot.request.timeout taskmanager.network.request-backoff.max task.cancellation.timeout
- 27. © 2020, Amazon Web Services, Inc. or its Affiliates. All rights reserved. 1. Exception 2. Context information (e.g., ExecutionGraph) Label (failure type) Label (failure type) Label (failure type) Label (failure type) Exception filter 1 Exception filter 2 Exception filter 3 Exception filter 4 Initial label: SYSTEM failure Result failure type
- 28. © 2020, Amazon Web Services, Inc. or its Affiliates. All rights reserved. UDF Operator Task Task slot UDF Operator UDF Operator Task UDF Operator Task Task slot UDF Operator UDF Operator Task executor Task manager Exception Source Map Window Filter Map SinkJob Graph
- 29. © 2020, Amazon Web Services, Inc. or its Affiliates. All rights reserved. Task manager System class loader (system bundled JARs) User class loader (submitted user JAR) class class Exception Flink runtime, network, states, etc (including Netty, S3A) User codes + dependency Not applicable on per-job cluster where user artifacts are installed along with system ones in library directory, in which case this filter can be excluded. Q) What about case where user artifacts were just victim by system issues such as network problem? Runtime artifacts like network module and heartbeat monitor can generally detect system issues
- 30. © 2020, Amazon Web Services, Inc. or its Affiliates. All rights reserved.
- 31. © 2020, Amazon Web Services, Inc. or its Affiliates. All rights reserved.
- 32. © 2020, Amazon Web Services, Inc. or its Affiliates. All rights reserved.
- 33. © 2020, Amazon Web Services, Inc. or its Affiliates. All rights reserved. CREATED SCHEDULING DEPLOYING RUNNING FAILINGRESTARTING Exception Label (failure type) Label (failure type) Label (failure type) Label (failure type) Exception filter 1 Exception filter 2 Exception filter 3 Exception filter 4 State Label Elapsed time RUNNING USER 125000s FAILING SYSTEM 15s … SYSTEM 10s
- 34. © 2020, Amazon Web Services, Inc. or its Affiliates. All rights reserved. CREATED SCHEDULING DEPLOYING RUNNING FAILINGRESTARTING User downtime System downtime ① User exception ② ③ ④ ⑤ Scheduling timeout ⑥⑦ ⑧ ⑨ ⑩ Solution: Stack-based downtime tracking for nested fail-over loops
- 35. © 2020, Amazon Web Services, Inc. or its Affiliates. All rights reserved.
- 36. © 2020, Amazon Web Services, Inc. or its Affiliates. All rights reserved. State Label Elapsed time RUNNING USER 125000s FAILING SYSTEM 15s … SYSTEM 10s Gauge Variables (labels or dimensions) Flink Prometheus metrics reporter AWS CloudWatch Prometheus server Prometheus-to-CloudWatch Aggregation/transformation by rules
- 37. © 2020, Amazon Web Services, Inc. or its Affiliates. All rights reserved. • Down status (Boolean) – by Prometheus rule • Better visibility for operation • Classified execution time • Good for low-level diagnosis but not intuitive for operation
- 38. © 2020, Amazon Web Services, Inc. or its Affiliates. All rights reserved.
- 39. © 2020, Amazon Web Services, Inc. or its Affiliates. All rights reserved. FLINK-9912 FLINK-12260 FLINK-14589 FLINK-14949
- 40. © 2020, Amazon Web Services, Inc. or its Affiliates. All rights reserved. • Majority failures are recoverable by task manager restarts • Job manager has rich information about task manager status • Fast health problem detection and recovery can minimize downtime as well as human operators’ burdens
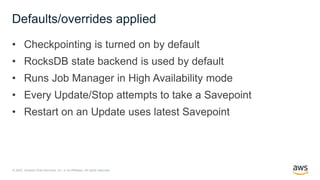
- 41. © 2020, Amazon Web Services, Inc. or its Affiliates. All rights reserved. [DISCUSS] Proposal for Flink job execution/availability metrics improvment [Design] Flink Job Execution Tracking [Design] Flink Exception Classifier for Downtime Cause Classificaiton
- 42. © 2020, Amazon Web Services, Inc. or its Affiliates. All rights reserved.
Editor's Notes
- #2: Welcome to the presentation on Real-time Analytics and Data Streaming.
- #4: 2 minutes During this presentation I am going to quickly describe the opportunity for real-time data streaming technology and why we, as a company, should be excited about this capability. I am then going to walk through some highlights of a typical first call deck, highlighting the use cases that real-time streaming technology enables, provide some high-level customer examples and then introduce the AWS services that enable such use cases. (Note that details of the services will be discussed on Thursday – this session is really focused on the core use cases, challenges and high level overview). I am then going to hand over to Ajit Singh, the Business Development Manager for Kinesis. He will provide a quick overview of core sales plays, common objections we hear in the market, and how to respond to such questions. We do our best to save at least 20 minutes for questions, as we want this to be interactive and give you a chance to tell us what is top of your mind in this space.
- #5: The AWS solution is easy to setup and use, has high availability and durability (default being across 3 regions), is full-managed and scalable reducing the complexity of managing the system over time and scaling as demands increase, and also comes with seamless integration into other core AWS services such as Elasticsearch for Log Analytics, S3 for data lake storage, Redshift for data warehousing purposes, Lambda for serverless processing etc. etc. Finally with AWS you only pay for what you use making the solution very cost effective.
- #6: 4 minutes So finally – I would like to introduce the AWS services that we have built to enable real-time analytics for our customers. The Kinesis family consists of 3 core services for data streaming (note we also have a fourth service Kinesis Video Streams enabling our customers to stream and analyze video and audio in real-time – although we are not covering that today it is a very exciting capability). Kinesis Data Streams enables customers to capture and store data Kinesis Data Analytics allows customers to build real-time applications in SQL or Java (with fully-managed Apache Flink) And Kinesis Data Firehose enables customers to load streaming data into streams, data lakes and or warehouses and is a very effective way of conducting ETL on continuous, high velocity data. We will go into the details of these services tomorrow during Damian Wylie’s session. Finally we are very excited to announce the latest service that we announced at Re:Invent 2018 and is currently in public preview, and has already achieved a run rate of $5million. Amazon Managed Streaming for Apache Kafka is a fully-managed service for Apache Kafka, a highly popular open-source framework for data streaming. Customers, who chose to use Kafka, currently either managed clusters on premise or on EC2, with many of the challenges that we spoke about before. My introducing Amazon MSK customers can now lift and shift their existing workloads and get full benefits of a fully-managed service where clusters are setup automatically and can be created or torn down on demand. This is a very exciting opportunity this year, and if you hear of any customer who uses Apache Kafka do mention Amazon MSK and convince them to give it a go. Another huge advantage of these 4 services is that it provides our customers with the flexibility to choose the right streaming technology depending on their use case, needs and preferences. Damian will discuss this in depth tomorrow, but we are certainly excited to be able to offer our customers choice in this space.
- #7: This is the Processing Section Are KDS and KDF the only streams that KDA can work with? (with MSK on the roadmap). Can the output be sent to any of the consumers on slide 17? Would KDA ever be replaced another consumer completely, if so why/what use cases? What is the standard architecture here? KDS/KDF -> KDA -> Lambda/ES/EMR -> S3/Redshift/DyanmoDB? If so we should talk about multiple consumers working in a workflow to execute effectively across many use cases.
- #18: Hi I am Hwanju, software engineer at Kinesis. I am taking over to present how we have measured Flink application availability in our service.
- #19: Let me go over the challenges we tried to address step by step. Firstly I am going to talk about how to measure uptime and downtime as fundamental requirement for availability measurement.
- #20: What is application downtime? One is application-level downtime, which is the time during which an application is not making any progress of record processing. So such no progress can be due to catchup time during replay from checkpoint after crash happens, or your user-defined function is stuck or throttled by external resources. This definition is high-level downtime from user's perspective but it's too application-specific to be measured by service provider, as various factors from application artifacts can affect this type of downtime. Second approach is service-level downtime, which can effectively measure the time that application is not in running state. It is fairly straightforward from the viewpoint of service, but conversely it may be low-level view from users. However Flink provides various useful metrics for users to measure application-level progress such as source latency and event time lag, so this downside can be compensated by those metrics. As a service provider, we focused on service-level downtime.
- #21: To measure service-level downtime, we wanted to know whether an application is in running state or not. So, we looked at job state machine managed by Flink runtime. This is pretty simplified state machine where many other states are omitted for presentation and you can see full state machine in Flink document shown below. As you can see, it has running state, which is what we want, so simply regarding running time as uptime, while the rest of the states as downtime seemed to be straightforward and this is also what Flink provides as uptime/downtime metrics. But it wasn't necessarily true and we needed to zoom into the running state further.
- #22: As shown here, Flink implements a job into a graph formed by multiple user-defined tasks. So, once a job transitions to running state, it's just simply ready to schedule individual tasks from a job graph. In the scheduling stage, Flink scheduler tries to find a resource called slot in available task manager to execute the task. And once available resource is reserved, the task is deployed to the allocated task manager and then finally the task can run user-defined function on the task manager. So while scheduling and deploying, a task is effectively not up and running, so only once those steps are finished, we can see user code actually starts running.
- #23: Since a job can consist of more than one task, we need to track individual task states to determine if an application is actually up and running with all of its tasks, or not.
- #24: To take that into account, we introduced job tracking state, which is finer-grained job state only for tracking purpose. A job tracking state effectively divides a single job state into multiple sub states and is derived from underlying job and individual task states. It's extensible but currently for our purpose, we divide running state into scheduling, deploying, and running sub states. So in this refined state machine, once a first task is scheduled, it goes into scheduling, and once a first task is deployed, transition to deploying, and finally once after all the tasks transition to running, we consider that uptime starts ticking.
- #25: The job tracking state allows us to measure time elapsed in each state, and we can now consider running time as uptime, otherwise downtime. This turned out to be much better standard to avoid false measurement, as we’ve observed nontrivial downtime takes place in scheduling phase by system issues. So now downtime is effectively fail-over time and we started figuring out what caused such fail-over.
- #26: The failure can happen either by user or system issues. Users as programmer has unlimited freedom to fail application, but as a service operator, we wanted to focus on failures caused by system not being distracted by the issues introduced by user's artifacts.
- #27: As a first step, we can look at how Flink can perceive failure? Flink is written in Java and has pretty clear state machine in which when failure happens, an exception is thrown switching any state to failing state shown as red arrows in the figure. Moreover, to avoid stuck state, configurable timeout is defined for each state, so when timeout happens through exception, Flink would know that something went wrong initiating fail-over. So we can look at how to classify such an exception into user vs. system failure.
- #28: So we introduced exception classifier, which is effectively rule-based labeling component based on how Flink runtime invokes user codes, and we also analyzed exception data gathered from production for better classification. As shown here, each rule can be defined as an exception filter and each filter is pluggable and configurable in Flink config file. This configuration change can be detected without restarting job manager to allow operators to reconfigure the filters on the fly during operation. This is mainly because as usual classification problem, there could be misclassification to amend on runtime. The classifier begins with system failure type, so that we can be conservative by treating unfiltered and unknown exceptions as system issue. With the input of exception and context like execution graph, each filter may label failure type based on its logic.
- #29: So, let's look at some filters. One major filter is user function filter. Fink programmers define their logic such as source, map, filter, sink, and so on in user-defined function or UDF. As shown here, each UDF in a job graph is internally mapped to UDF encapsulated as an operator, which is run by each task on top of assigned task slot in task manager. So all of the components except UDF is considered as Flink runtime system, but as UDF runs user code, if an exception is thrown from UDF, we can consider it as user issue.
- #30: Another similar filter is user class loader filter. Flink has a separate class loader for user artifacts including their code and its dependency, while system class loader is responsible for loading Flink runtime including network and state management. So if an exception is thrown from a class loaded by user class loader, it comes from user submitted artifact, and since service provider treats user artifacts as black box without any control, such exception is classified into user. It's only applicable to the model where user submits a JAR to flink cluster, but not to per-job cluster where user artifacts are embedded in system directory. So in that case, this filter can be excluded. One question is what if an exception from user code is just a victim of system issue such as network problem. The answer is once such issue happens, runtime components like network layer, scheduler, and heartbeat monitor generally detects the problem as well, so to be classified as system failure properly.
- #31: Next filter is user serialization filter, which is dealing with one of the challenging problems. Flink allows programmers to register their own custom serializer to Flink. But any failure from such serializer takes place in Flink runtime not from UDF or user artifacts, so this is sort of injected user failure to runtime. So we analyzed code path as well as data, and added the rules that detect exceptions from TypeSerializer and TypeSerializerSnapshot, which are interface for custom serializer and schema evolution. In addition to that, we added StateMigrationException to detect incompatible states and StreamTaskException for user config serialization. Another one is user API filter which catches invalid use of Flink public API module, which is part of runtime. Based on the analysis, we conservatively chose this small set of exceptions as user issues.
- #32: Finally, there are out-of-resource filters. Out-of-resource exception is typically blurring the boundary between user and system, since exception itself is thrown from virtually anywhere and that could be a victim not necessarily a culprit. And tracking resource provenance like by doing heap object graph analysis on runtime is practically infeasible, as it's too expensive. Our approach is to label such errors separately and defers analysis and recovery decision to human operators. So we added out-of-memory and too-many-open-files filters, which are most frequent resource errors.
- #33: Now that we have downtime tracking and classification, let's put those things together.
- #34: We consider the exception that triggers state transition to failing is the cause of fail-over, so all the downtime during that fail-over stages is attributed to the cause of the failure, which is decided by exception classifier. So, on the right hand side, now we can label the cause of each downtime, so we can gauge system downtime.
- #35: Typically one failure causes one fail-over, but interestingly we have noticed that multiple cascaded failures are not uncommon in real world, and in other words, another failure can happen during fail-over, which can possibly have different failure type. For example, in this figure, while running, user code throws an exception triggering fail-over, where its downtime is accounted to user. But some system issue can make scheduling to be timed out, which triggers another fail-over, where its downtime should be accounted to system. Finally the system issue is either transient or recovered, original fail-over could be finished reaching running state again. As this last downtime is from original fail-over regardless of nested system failure, this downtime is accounted back to user. So, to address this type of nested fail-over loops, we implemented stack-based downtime tracking.
- #36: Finally, let me move on to how we have been doing operations with this classified downtime?
- #37: As expected, metric is the way for us to have visibility to do operation. From the classified downtime, we set the state and failure type to metrics variables, which is also called labels or dimensions in different metrics system, and downtime is exposed as gauge metric value. Then this metric values are exported through Flink metrics framework, where we use Promethues metrics reporter, and then our service prometheus server periodically scrapes this data and pushes it to AWS Cloudwatch. There we do set alarm and do dashboard investigation. As shown here, we do some aggregation and transformation of raw metrics using prometheus rule for better visibility.
- #38: At CloudWatch, the top graph shows uptime and downtime increase for each state and failure type from an application with constant failures. This raw metrics are useful for deeper diagnosis, but it's not so useful for operation. So we transformed raw downtime metrics to boolean state labeled with each failure type. The bottom graph is from a different example where an application was constantly failing with user exceptions, but during fail-over it kept leaking heap memory eventually running into out-of-memory, but as you can see on the right-hand side, interestingly out-of-memory started affecting system component, in this case Flink scheduler couldn't allocate such unhealthy task manager. So, in this view, we can easily identify historical failure transitions.
- #39: Here are some lessons learned from engineering perspective. Like any classification problem, failure classification is hard especially because Flink is large and rapidly evolving, so classification needs to be more generic not depending on specific exception types and messages. User function and user class loader filters help much but still need nontrivial special filters. And as a general-purpose stream processing platform, Flink gives programmers unlimited freedom to induce various failures. In this space, as trade-off, declarative programming such as SQL, which is also supported by Flink, would reduce such failure surface by limiting such high degree of freedom. Next, as a general problem, flink doesn't provide isolated sandbox for user execution environment by hosting user code with Flink runtime in the same JVM. To deal with this problem, Flink can allow user code to be hosted in a separate process or container, but performance would be impacted as a trade-off. Last one is Java exception may not contain full context of why failure happened especially from externally-triggered failures. For example, heartbeat timeout or scheduling timeout exceptions do not contain the reason why it happened, so we had to conservatively consider those as all system failures, but some can be caused by user issue like out-of-memory or incorrect slot sharing group assignment. For this issue, external health monitor can compensate the limitation by providing more context outside Flink.
- #40: And this is second set of lessons from operation experience. The downtime we have experienced is not just from infrastructure but also from software issue. Major issues have been mostly from scheduling failure, which manifests itself as slot allocation timeout, and they are due to code bug like race condition and inconsistent states. The last two issues are what we reported and upstreamed the fix. The second one is from failed timeout guard for stuck cancellation due to out-of-memory, so indeed sometimes timeout safetynet was not working properly, so fail-over was completely stuck. This issue is also what we reported and upstreamed the fix. Secondly, those software issues are mostly coming from fail-over stages, which means scheduling and cancelling are normally fine as long as application is healthy without any failure, but once application and its taskmanager become unhealthy, fail-over stages may be exposed to uncommon path like race condition. Next is that such failure is typically started with minor user issues like permission error, but throwing such an exception to Flink triggering full job fail-over is not really helping but instead making things worse causing cascaded failures. So, Flink programmers should think through what exceptions to catch and handle inside operator not blindly throwing it to Flink triggering unnecessary fail-over. Finally, resource overuse is typical and this issue oftentimes impacts system components making operation challenging.
- #41: Based on those lessons, we've been working on auto-recovery system. We've noticed that majority failures especially software issues are recoverable by task manager restarts. And also job manager already maintains and exposes rich information about task manager status. So our monitor system probes health from job manager REST API, and once unhealthy component is detected, it automatically takes recovery action, which is typically restarting failed component, after gathering relevant information for later investigation. This is effectively baking human operator's knowledge to software to minimize the downtime as well as operator's burden.
- #42: In conclusion, availability is key metrics for long-running application like stream processing. For platform providers like AWS, it's mainly for better operation focusing on service-related availability issues filtering out frequent failures caused by user code or configuration. And since long-running application can run for days and months, such metrics can help us do causal analysis about when an initial issue happened and how different failures have occurred as time goes by. Not just from service provider, developers can also use this metrics for better debugging before deep log dive, which normally takes long time to spot relevant logs because of huge volume of logs with a lot of noise. And as mentioned, the exception filter is pluggable, so developers can have custom filters and labels to enable customized downtime metrics for their own purpose. Here's the references for mailing list discussion and design docs, so you can find more details from these references.