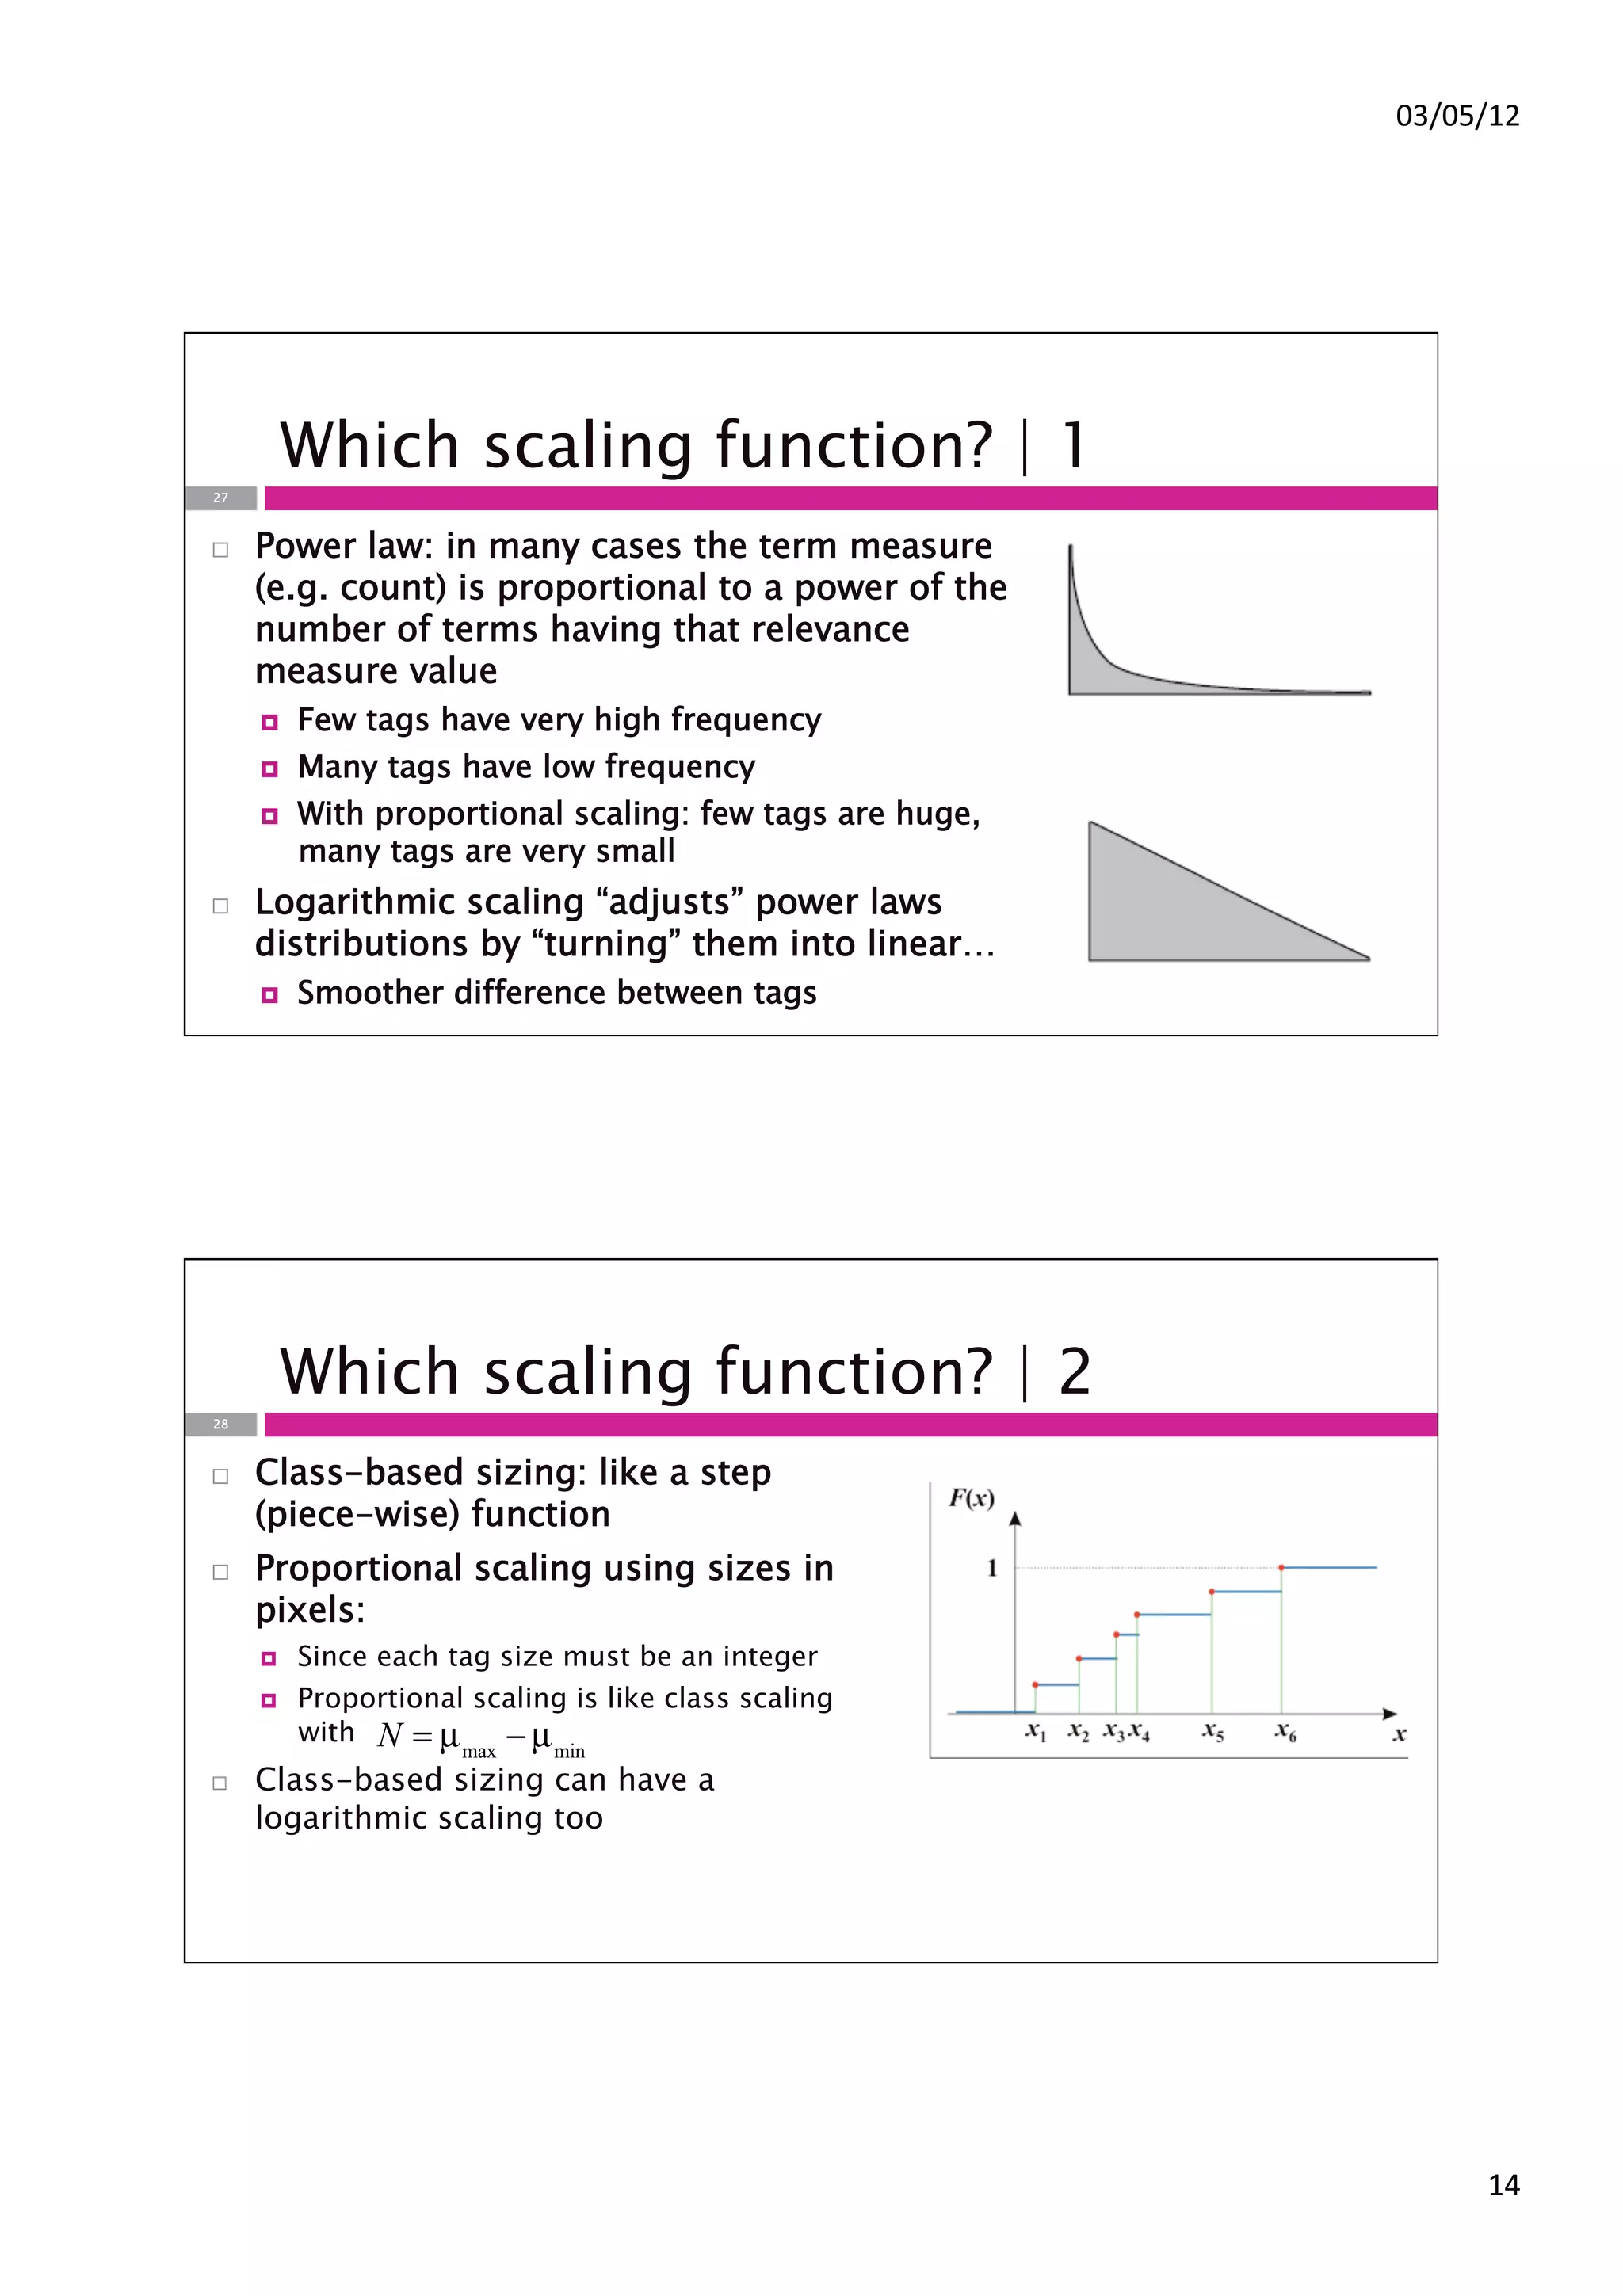
This document discusses different types of visualizations that can be used for information exploration interfaces. It describes tag clouds, bar charts, histograms, pie charts and scatter plots for visualizing facets. It also covers lists, grids and icons for representing items and matrix charts for showing aggregate views and correlations between features. The roles of proportional, logarithmic and class-based scaling techniques are explained.


![!"#!$#%&'
Class-based scaling | 2
23
!! Each range is !k = [lk , hk ]
µ max,q ! µ min,q
!! (
Lower bound: lk = µ min,q + k ! 1 ) N
µ max,q ! µ min,q
!! Higher bound h = µ +k
k min,q
N
An analogy…
24
!! A list of students
!! Each student has her own mark between
18-30
!! Studenti = <namei, marki>
!! We want to display the list such that the size of
each name depends on how high is the mark
!! We create 3 ranges: !max ! !min = 30 !18 = 12
!! 18-22, 22-26, 26-30
%&'](https://image.slidesharecdn.com/2012-05-02spagnolovisualization-120508112945-phpapp02/75/Visualization-for-exploratory-interfaces-12-2048.jpg)


![!"#!$#%&'
The project
79
!! Choose a topic of your interest
!! Find information, create and organize a collection
of information items
!! Design the application:
!! The features (facets) used for the exploration
!! The visualization of results
!! Delivery material: report + prototype (one week
before the exam)
So now what?
80
!! Start deciding the groups (max two people)
!! Communicate us:
!! The team members
!! The choice between Project A (1001stories narrative) vs. Project B (exploratory
app)
!! The topic of your work (to be approved in both cases)
!! Each group should open a thread on the BEEP website forum (category
“PROJECT GROUPS”)
!! Write the title of the post as follows:
[Project X] Surname01 - Surname02
where X = A or B, e.g.
[Project A] Di Blas – Spagnolo!
[Project B] Smith – Rossi
!! All further communications and delivery will be on that thread
(!'](https://image.slidesharecdn.com/2012-05-02spagnolovisualization-120508112945-phpapp02/75/Visualization-for-exploratory-interfaces-40-2048.jpg)